33334 Investment Properties for Sale
Browse homes for sale and investment properties in 33334. Refine your search by price, property type, or more.
Best cash flowing properties in 33334
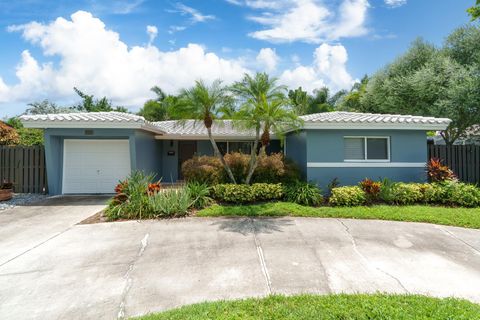
Active
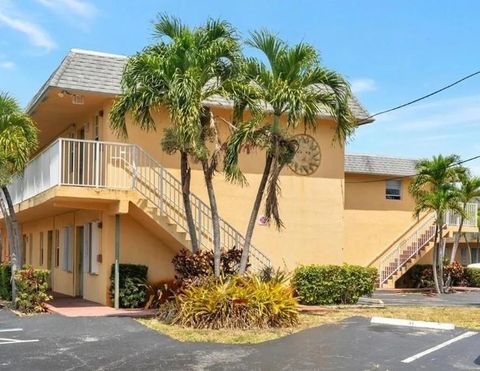
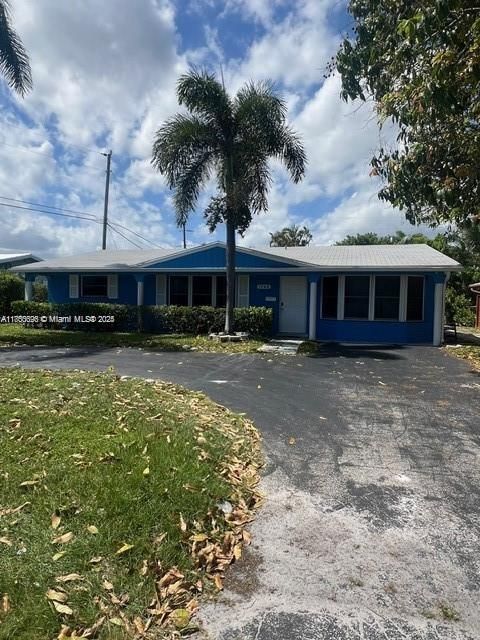
$140,000
2
bds
|
1
ba
|
650
sqft
|
built
1972
4061 N Dixie Hwy, Oakland Park, FL 33334
$-78
Cash flow
-2.9%
Cash-on-Cash Return
5.5%
Cap rate
1.3%
Rent to Value Ratio
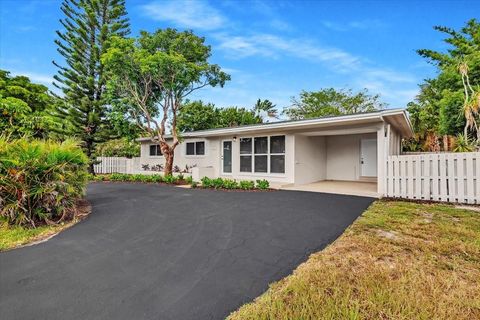
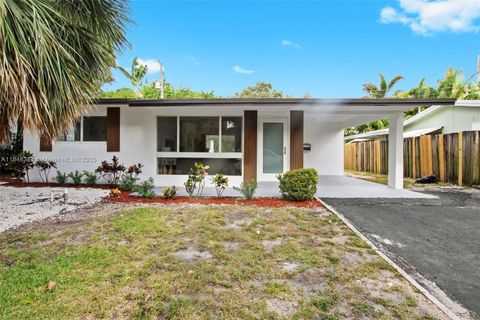
Active
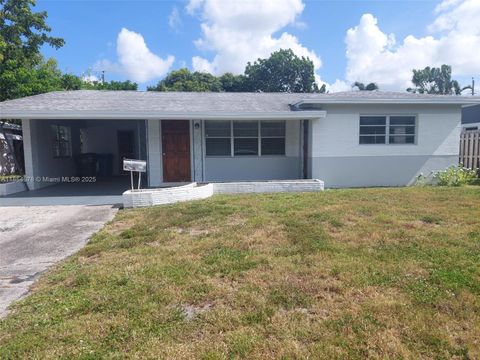
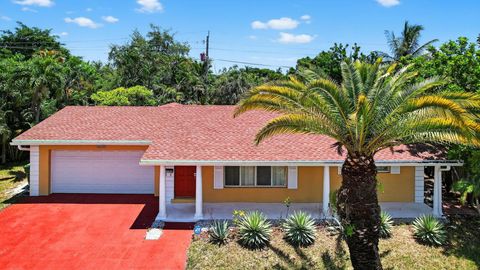
$389,000
2
bds
|
3
ba
|
1,291
sqft
|
built
1959
331 NE 42nd Ct, Oakland Park, FL 33334
$-140
Cash flow
-1.9%
Cash-on-Cash Return
5.7%
Cap rate
0.7%
Rent to Value Ratio
168 out of 191 properties for sale in 33334
Limited Results Shown
Create a free account, or log in to reveal all property listings and enjoy the complete experience.
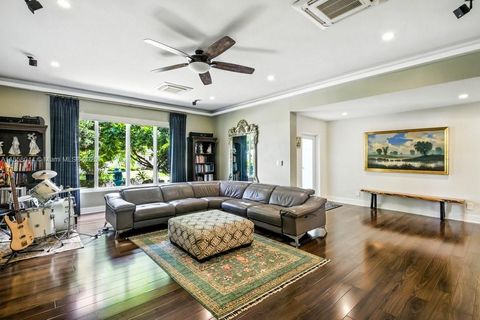
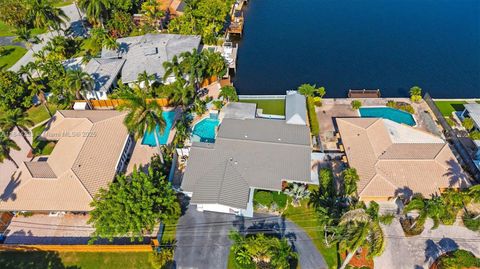
Active
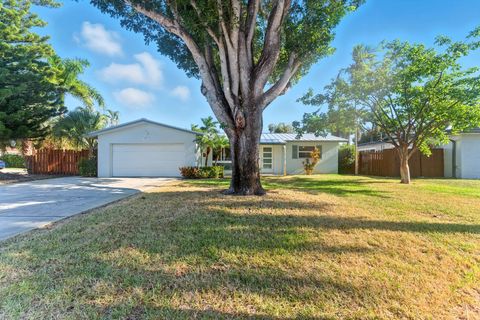
$714,990
2
bds
|
2
ba
|
1,352
sqft
|
built
1965
1531 NE 59th Pl, Fort Lauderdale, FL 33334
$-903
Cash flow
-6.6%
Cash-on-Cash Return
4.6%
Cap rate
0.6%
Rent to Value Ratio
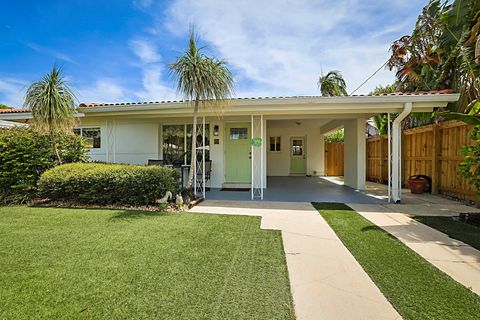
Active
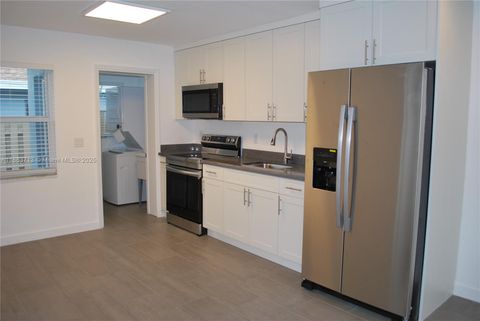
$720,000
bds
|
0
ba
|
1,700
sqft
|
built
1971
3621 NE 1st Ter, Oakland Park, FL 33334
$-3,163
Cash flow
-22.9%
Cash-on-Cash Return
0.9%
Cap rate
0.3%
Rent to Value Ratio
Active
$950,000
4
bds
|
3
ba
|
2,050
sqft
|
built
1963
1301 NE 42nd St, Oakland Park, FL 33334
$-2,243
Cash flow
-12.3%
Cash-on-Cash Return
3.3%
Cap rate
0.6%
Rent to Value Ratio
Active
$191,000
1
bds
|
1
ba
|
535
sqft
|
built
1972
1407 NE 56th St, Fort Lauderdale, FL 33334
$-290
Cash flow
-7.9%
Cash-on-Cash Return
4.3%
Cap rate
1.0%
Rent to Value Ratio
Active
$975,000
3
bds
|
3
ba
|
1,268
sqft
|
built
1967
1430 NE 53rd Ct, Fort Lauderdale, FL 33334
$-1,337
Cash flow
-7.2%
Cash-on-Cash Return
4.5%
Cap rate
0.7%
Rent to Value Ratio

Active
$175,000
2
bds
|
1
ba
|
609
sqft
|
built
1978
5162 NE 6th Ave, Oakland Park, FL 33334
$-394
Cash flow
-11.7%
Cash-on-Cash Return
3.4%
Cap rate
1.0%
Rent to Value Ratio
Active
$1,195,000
3
bds
|
3
ba
|
1,802
sqft
|
built
1964
1461 NE 57th Ct, Fort Lauderdale, FL 33334
$-2,562
Cash flow
-11.2%
Cash-on-Cash Return
3.6%
Cap rate
0.5%
Rent to Value Ratio
Active
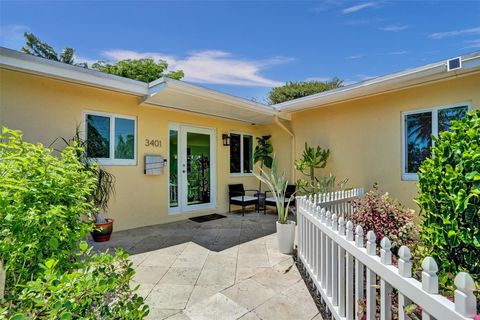
$649,000
3
bds
|
3
ba
|
1,716
sqft
|
built
1953
3401 NE 17th Ave, Oakland Park, FL 33334
$-965
Cash flow
-7.8%
Cash-on-Cash Return
4.4%
Cap rate
0.6%
Rent to Value Ratio
Active
$330,000
2
bds
|
2
ba
|
912
sqft
|
built
1972
3050 NE 16th Ave, Oakland Park, FL 33334
$-1,501
Cash flow
-23.7%
Cash-on-Cash Return
0.7%
Cap rate
0.7%
Rent to Value Ratio
Active
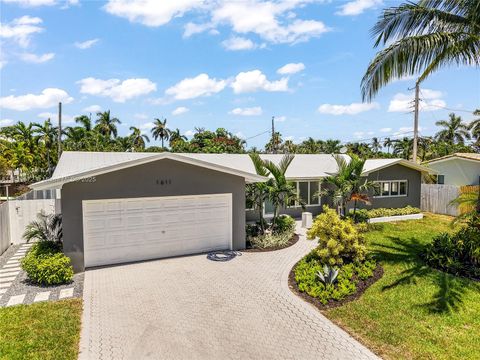
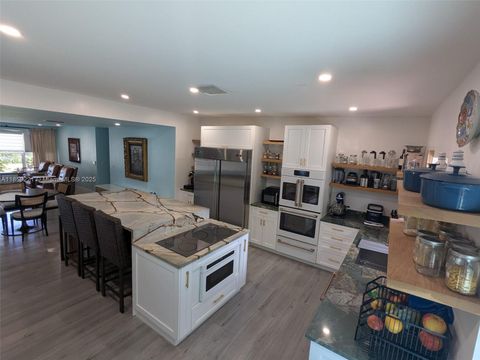
$1,000,000
3
bds
|
2
ba
|
1,792
sqft
|
built
1961
1611 NE 40th Pl, Oakland Park, FL 33334
$-3,705
Cash flow
-19.3%
Cash-on-Cash Return
1.7%
Cap rate
0.4%
Rent to Value Ratio
Active
$799,000
4
bds
|
3
ba
|
1,567
sqft
|
built
1954
524 NE 27th Dr, Wilton Manors, FL 33334
$-2,472
Cash flow
-16.1%
Cash-on-Cash Return
2.4%
Cap rate
0.5%
Rent to Value Ratio
Active
$885,000
3
bds
|
2
ba
|
1,267
sqft
|
built
1958
4410 NE 15th Ter, Oakland Park, FL 33334
$-2,523
Cash flow
-14.9%
Cash-on-Cash Return
2.7%
Cap rate
0.6%
Rent to Value Ratio
Active
$724,900
3
bds
|
2
ba
|
1,468
sqft
|
built
1959
4687 NE 18th Ave, Oakland Park, FL 33334
$-2,188
Cash flow
-15.7%
Cash-on-Cash Return
2.5%
Cap rate
0.5%
Rent to Value Ratio
Active
$1,074,000
3
bds
|
3
ba
|
2,447
sqft
|
built
1956
1708 NE 47th St, Oakland Park, FL 33334
$-2,753
Cash flow
-13.4%
Cash-on-Cash Return
3.1%
Cap rate
0.6%
Rent to Value Ratio
Active
$500,000
2
bds
|
1
ba
|
1,212
sqft
|
built
1957
846 NE 34th St, Oakland Park, FL 33334
$-897
Cash flow
-9.4%
Cash-on-Cash Return
4.0%
Cap rate
0.6%
Rent to Value Ratio
Active
$451,000
4
bds
|
2
ba
|
1,208
sqft
|
built
1959
620 NE 57th St, Oakland Park, FL 33334
$-1,059
Cash flow
-12.3%
Cash-on-Cash Return
3.3%
Cap rate
0.6%
Rent to Value Ratio
Active
$865,000
4
bds
|
2
ba
|
2,042
sqft
|
built
1959
4351 NE 15th Ter, Oakland Park, FL 33334
$-1,723
Cash flow
-10.4%
Cash-on-Cash Return
3.8%
Cap rate
0.7%
Rent to Value Ratio
Active
$1,100,000
3
bds
|
3
ba
|
1,521
sqft
|
built
1953
2716 NE 10th Ter, Wilton Manors, FL 33334
$-2,843
Cash flow
-13.5%
Cash-on-Cash Return
3.0%
Cap rate
0.5%
Rent to Value Ratio
Active
$579,900
2
bds
|
3
ba
|
1,738
sqft
|
built
2006
2601 NE 14th Ave, Wilton Manors, FL 33334
$-2,758
Cash flow
-24.8%
Cash-on-Cash Return
0.4%
Cap rate
0.6%
Rent to Value Ratio
Active
$874,900
3
bds
|
2
ba
|
1,571
sqft
|
built
1953
2732 NE 15th Ter, Wilton Manors, FL 33334
$-2,150
Cash flow
-12.8%
Cash-on-Cash Return
3.2%
Cap rate
0.6%
Rent to Value Ratio
Active
$169,999
2
bds
|
1
ba
|
850
sqft
|
built
1965
2990 NE 16th Ave, Oakland Park, FL 33334
$-296
Cash flow
-9.1%
Cash-on-Cash Return
4.1%
Cap rate
1.2%
Rent to Value Ratio
Active
$610,000
3
bds
|
2
ba
|
1,490
sqft
|
built
1960
5611 NE 16th Ave, Fort Lauderdale, FL 33334
$-606
Cash flow
-5.2%
Cash-on-Cash Return
5.0%
Cap rate
0.7%
Rent to Value Ratio
Active
$870,000
3
bds
|
2
ba
|
1,688
sqft
|
built
1961
1430 NE 57th Ct, Fort Lauderdale, FL 33334
$-1,699
Cash flow
-10.2%
Cash-on-Cash Return
3.8%
Cap rate
0.5%
Rent to Value Ratio
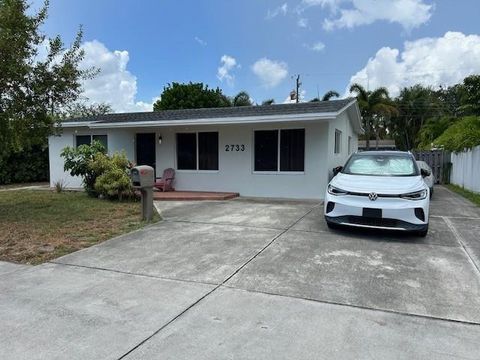
Active
$555,000
2
bds
|
1
ba
|
1,810
sqft
|
built
1959
2733 NE 6th Ave, Wilton Manors, FL 33334
$-1,297
Cash flow
-12.2%
Cash-on-Cash Return
3.3%
Cap rate
0.7%
Rent to Value Ratio
Active
$390,000
3
bds
|
2
ba
|
916
sqft
|
built
1957
100 NE 51st St, Oakland Park, FL 33334
$-446
Cash flow
-6.0%
Cash-on-Cash Return
4.8%
Cap rate
0.7%
Rent to Value Ratio
Active
$249,900
2
bds
|
1
ba
|
614
sqft
|
built
1970
2660 NE 8th Ave, Wilton Manors, FL 33334
$-838
Cash flow
-17.5%
Cash-on-Cash Return
2.1%
Cap rate
0.8%
Rent to Value Ratio
Active
$259,900
2
bds
|
1
ba
|
619
sqft
|
built
1969
2660 NE 8th Ave, Wilton Manors, FL 33334
$-852
Cash flow
-17.1%
Cash-on-Cash Return
2.2%
Cap rate
0.8%
Rent to Value Ratio
Active
$999,000
bds
|
0
ba
|
1,984
sqft
|
built
1966
1680 NE 34th Ln, Oakland Park, FL 33334
$-4,793
Cash flow
-25.0%
Cash-on-Cash Return
0.4%
Cap rate
0.3%
Rent to Value Ratio
Active
$774,999
4
bds
|
3
ba
|
1,988
sqft
|
built
1964
1745 NE 52nd St, Oakland Park, FL 33334
$-2,883
Cash flow
-19.4%
Cash-on-Cash Return
1.7%
Cap rate
0.4%
Rent to Value Ratio
Active
$169,000
2
bds
|
1
ba
|
675
sqft
|
built
1982
95 NE 41st St, Oakland Park, FL 33334
$-356
Cash flow
-11.0%
Cash-on-Cash Return
3.6%
Cap rate
1.1%
Rent to Value Ratio
Active
$649,900
3
bds
|
2
ba
|
1,471
sqft
|
built
1965
5290 NE 18th Ave, Fort Lauderdale, FL 33334
$-1,680
Cash flow
-13.5%
Cash-on-Cash Return
3.0%
Cap rate
0.6%
Rent to Value Ratio
Active
$299,999
2
bds
|
2
ba
|
912
sqft
|
built
1972
3050 NE 16th Ave, Oakland Park, FL 33334
$-1,211
Cash flow
-21.1%
Cash-on-Cash Return
1.3%
Cap rate
0.8%
Rent to Value Ratio
Active
$899,000
3
bds
|
2
ba
|
1,503
sqft
|
built
1958
4260 NE 16th Ter, Oakland Park, FL 33334
$-992
Cash flow
-5.8%
Cash-on-Cash Return
4.8%
Cap rate
0.8%
Rent to Value Ratio
Active
$723,000
3
bds
|
2
ba
|
1,255
sqft
|
built
1963
2825 NE 9th Ave, Wilton Manors, FL 33334
$-1,623
Cash flow
-11.7%
Cash-on-Cash Return
3.5%
Cap rate
0.5%
Rent to Value Ratio
Active
$220,000
2
bds
|
2
ba
|
930
sqft
|
built
1971
1400 NE 55th St, Fort Lauderdale, FL 33334
$-551
Cash flow
-13.1%
Cash-on-Cash Return
3.1%
Cap rate
0.9%
Rent to Value Ratio
Active
$549,000
3
bds
|
2
ba
|
1,371
sqft
|
built
1960
120 NE 57th Ct, Oakland Park, FL 33334
$-237
Cash flow
-2.3%
Cash-on-Cash Return
5.6%
Cap rate
0.7%
Rent to Value Ratio
Active
$975,000
4
bds
|
2
ba
|
1,949
sqft
|
built
1960
1460 NE 57th Ct, Fort Lauderdale, FL 33334
$-2,440
Cash flow
-13.1%
Cash-on-Cash Return
3.1%
Cap rate
0.5%
Rent to Value Ratio
Active
$505,000
3
bds
|
2
ba
|
1,290
sqft
|
built
1999
320 NE 33rd St, Oakland Park, FL 33334
$-709
Cash flow
-7.3%
Cash-on-Cash Return
4.5%
Cap rate
0.7%
Rent to Value Ratio