33990 Investment Properties for Sale
Browse homes for sale and investment properties in 33990. Refine your search by price, property type, or more.
Best cash flowing properties in 33990
Active
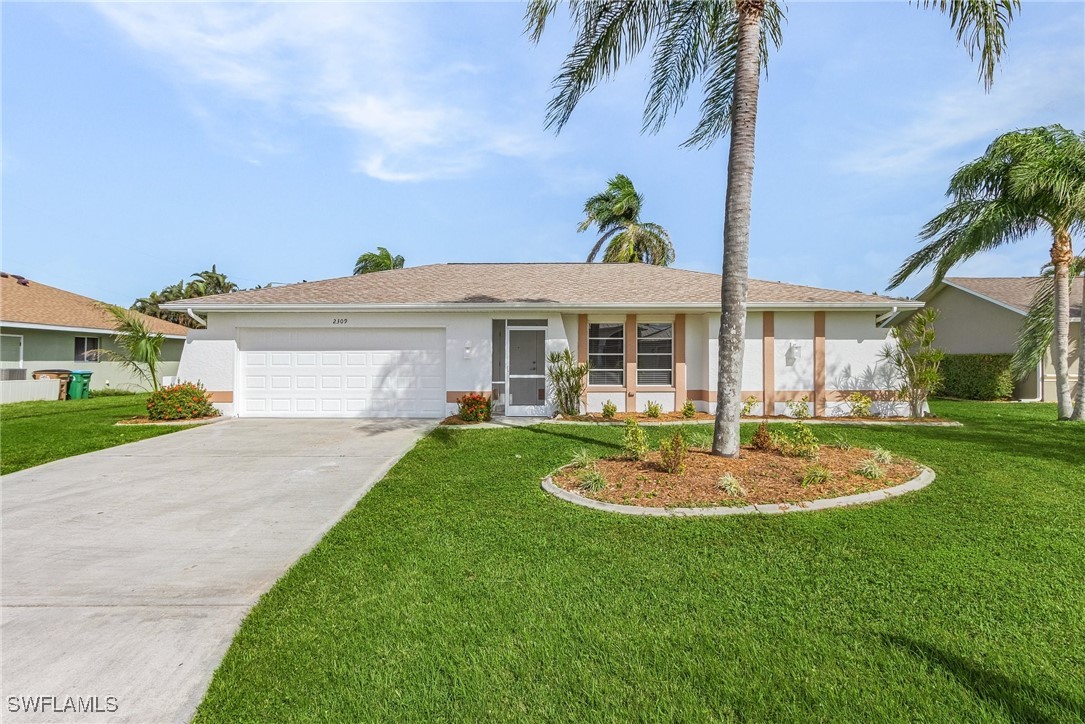
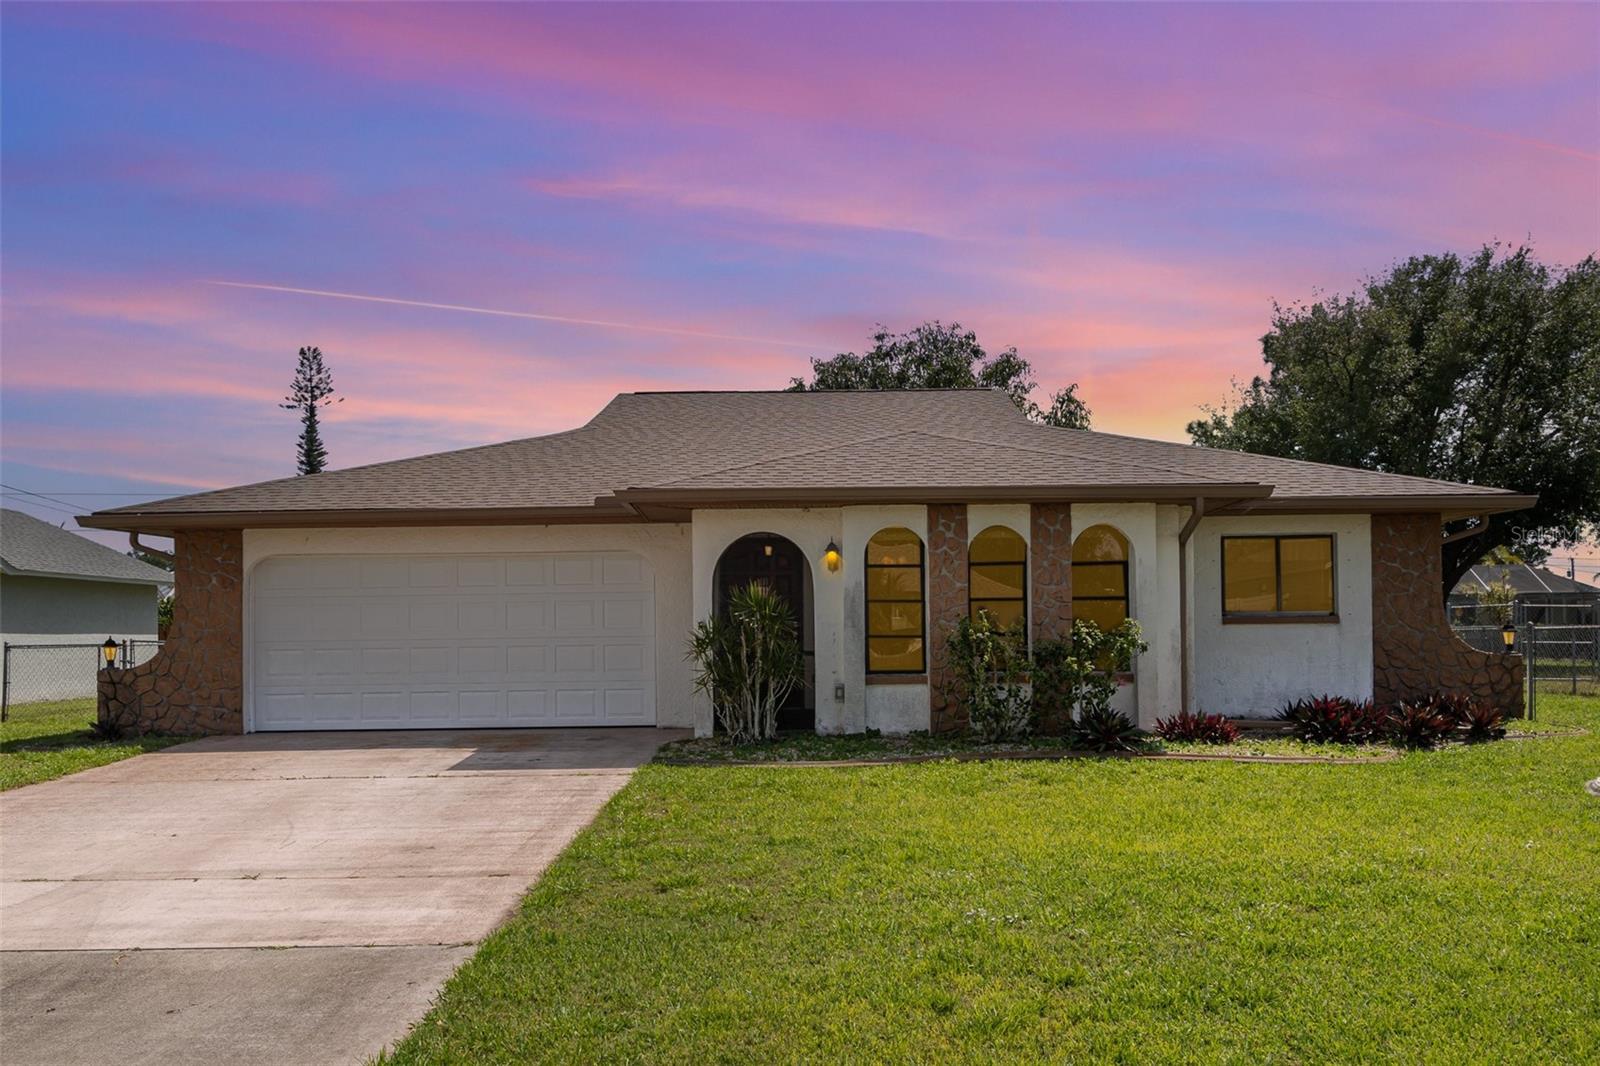
$295,000
3
bds
|
2
ba
|
1,295
sqft
|
built
1987
2309 SE 15th Ter, Cape Coral, FL 33990
$-60
Cash flow
-1.1%
Cash-on-Cash Return
6.0%
Cap rate
0.8%
Rent to Value Ratio
Active
$395,000
3
bds
|
3
ba
|
1,761
sqft
|
built
1989
1220 Hancock Bridge Pkwy, Cape Coral, FL 33990
$-157
Cash flow
-2.1%
Cash-on-Cash Return
5.8%
Cap rate
0.8%
Rent to Value Ratio
233 out of 295 properties for sale in 33990
Limited Results Shown
Create a free account, or log in to reveal all property listings and enjoy the complete experience.
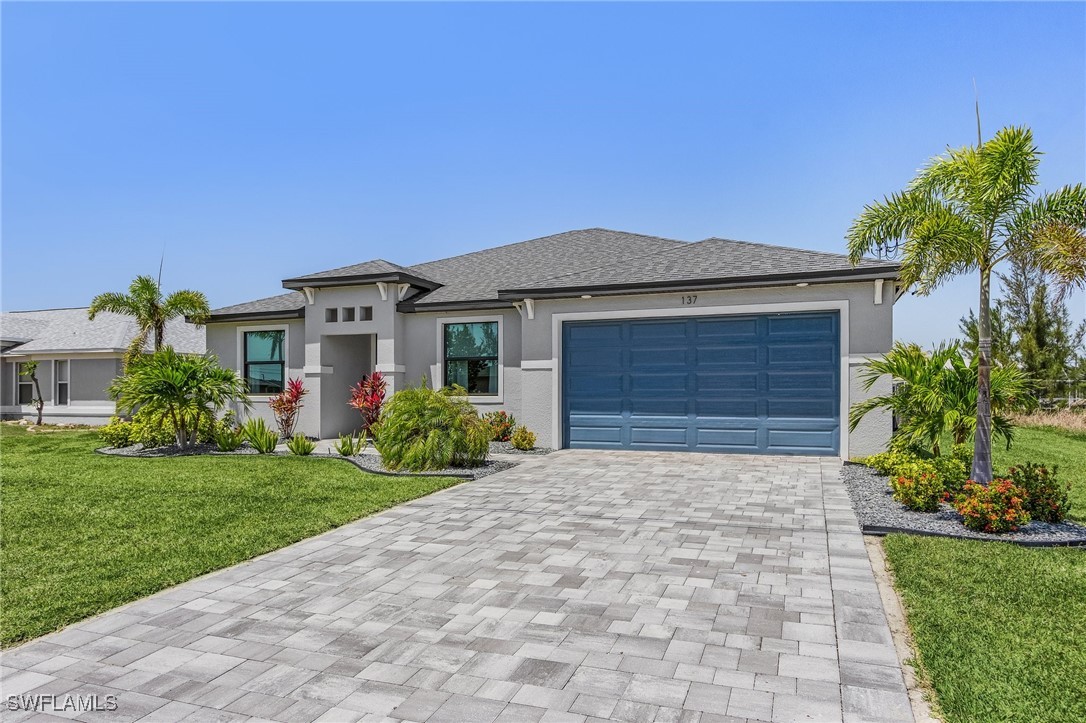
Active
$549,990
4
bds
|
2
ba
|
1,793
sqft
|
built
2023
137 SE 23rd Ter, Cape Coral, FL 33990
$-1,589
Cash flow
-15.1%
Cash-on-Cash Return
2.8%
Cap rate
0.5%
Rent to Value Ratio
Active
$395,000
3
bds
|
3
ba
|
1,761
sqft
|
built
1989
1220 Hancock Bridge Pkwy, Cape Coral, FL 33990
$-157
Cash flow
-2.1%
Cash-on-Cash Return
5.8%
Cap rate
0.8%
Rent to Value Ratio
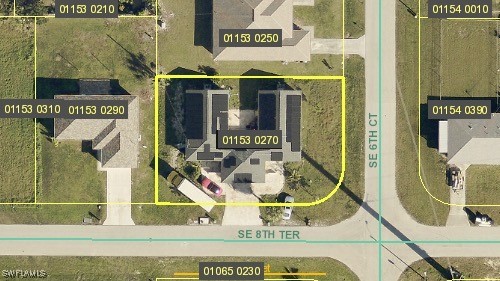
Active
$439,900
6
bds
|
4
ba
|
0
sqft
|
built
1979
541 SE 8th Ter, Cape Coral, FL 33990
$-1,602
Cash flow
-19.0%
Cash-on-Cash Return
1.9%
Cap rate
0.4%
Rent to Value Ratio
Active under contract
$745,000
8
bds
|
8
ba
|
0
sqft
|
built
1980
918 SE 24th Ave, Cape Coral, FL 33990
$-3,627
Cash flow
-25.4%
Cash-on-Cash Return
0.4%
Cap rate
0.2%
Rent to Value Ratio
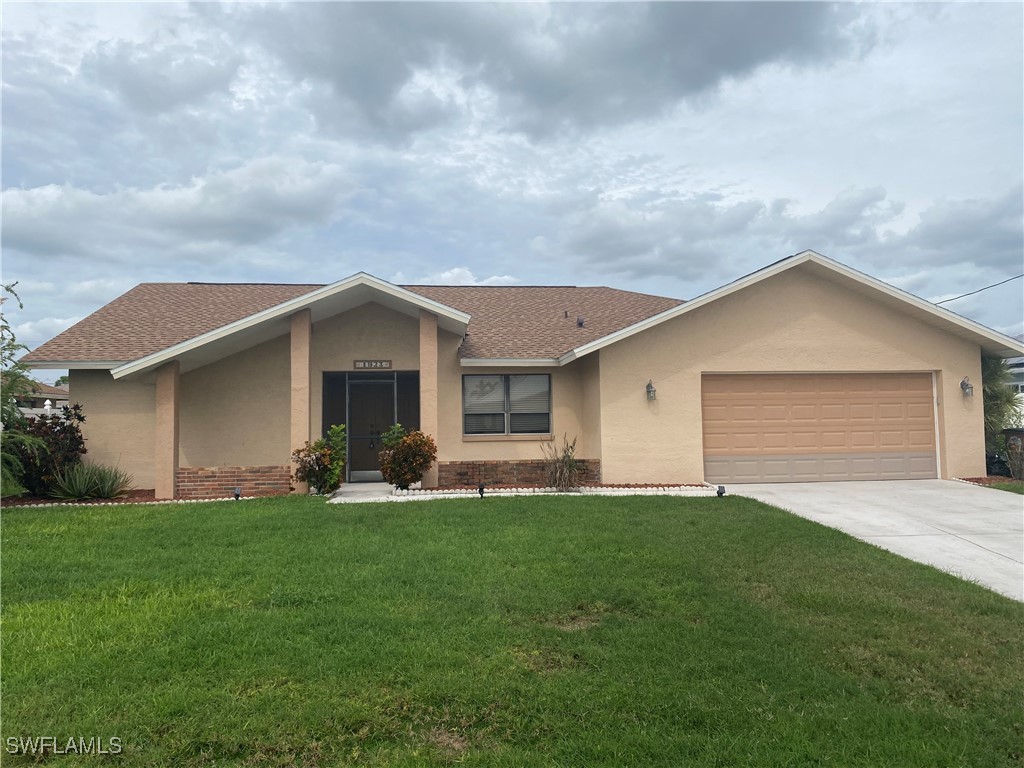
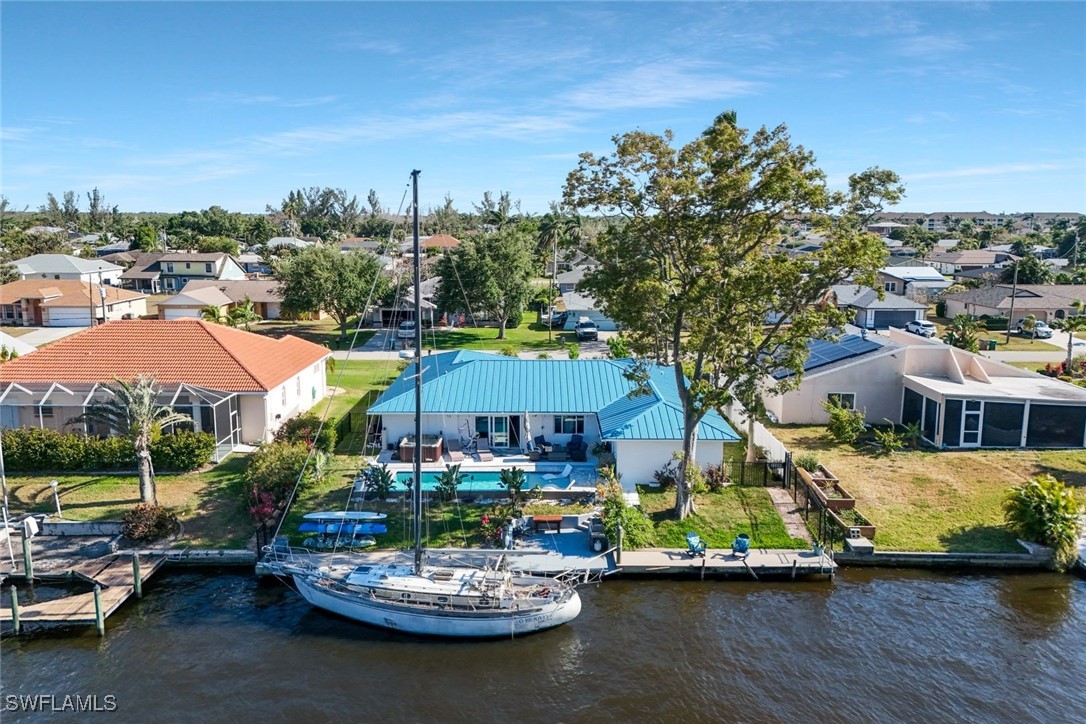
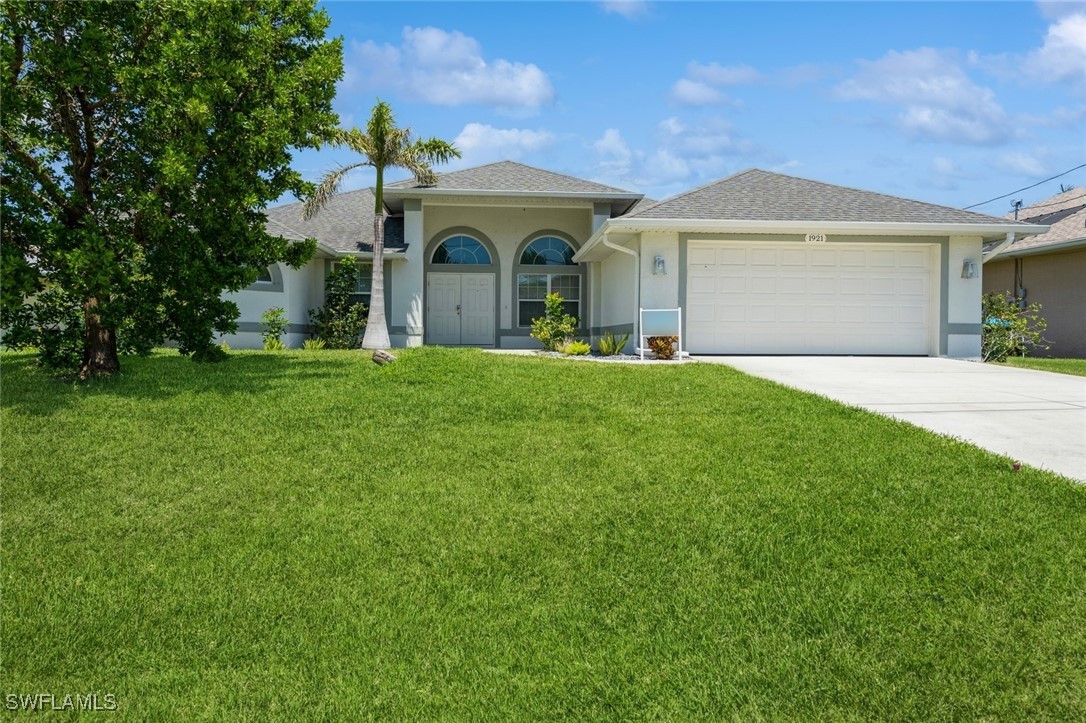
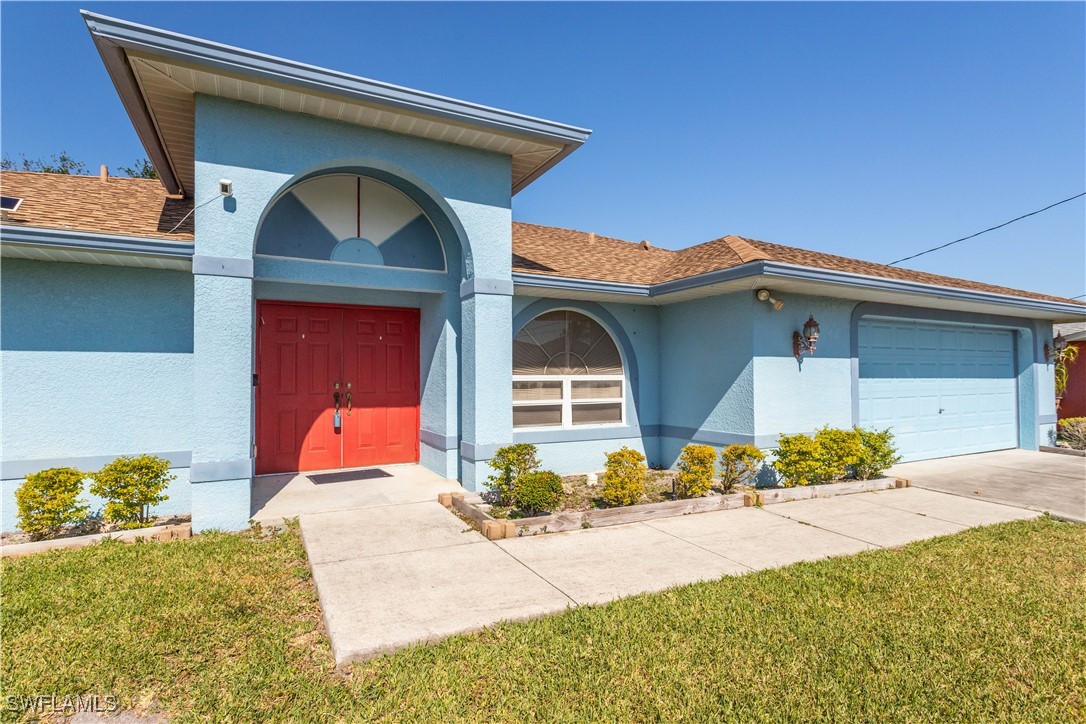
Active
$525,000
3
bds
|
2
ba
|
1,921
sqft
|
built
1991
423 SE 17th St, Cape Coral, FL 33990
$-819
Cash flow
-8.1%
Cash-on-Cash Return
4.4%
Cap rate
0.7%
Rent to Value Ratio
Active
$570,000
4
bds
|
2
ba
|
1,986
sqft
|
built
1999
2201 SE 5th Ave, Cape Coral, FL 33990
$-1,163
Cash flow
-10.6%
Cash-on-Cash Return
3.8%
Cap rate
0.6%
Rent to Value Ratio
Active
$410,000
3
bds
|
2
ba
|
1,370
sqft
|
built
1985
1512 SE 17th Ter, Cape Coral, FL 33990
$-671
Cash flow
-8.5%
Cash-on-Cash Return
4.3%
Cap rate
0.7%
Rent to Value Ratio
Active
$375,900
3
bds
|
2
ba
|
1,712
sqft
|
built
1985
1925 SE 9th Ter, Cape Coral, FL 33990
$-679
Cash flow
-9.4%
Cash-on-Cash Return
4.1%
Cap rate
0.7%
Rent to Value Ratio
Active
$729,000
3
bds
|
2
ba
|
2,350
sqft
|
built
1974
2135 SE 15th St, Cape Coral, FL 33990
$-2,229
Cash flow
-16.0%
Cash-on-Cash Return
2.6%
Cap rate
0.4%
Rent to Value Ratio
Active
$322,999
3
bds
|
2
ba
|
2,248
sqft
|
built
1988
910 SE 19th Ln, Cape Coral, FL 33990
$-399
Cash flow
-6.4%
Cash-on-Cash Return
4.8%
Cap rate
0.8%
Rent to Value Ratio
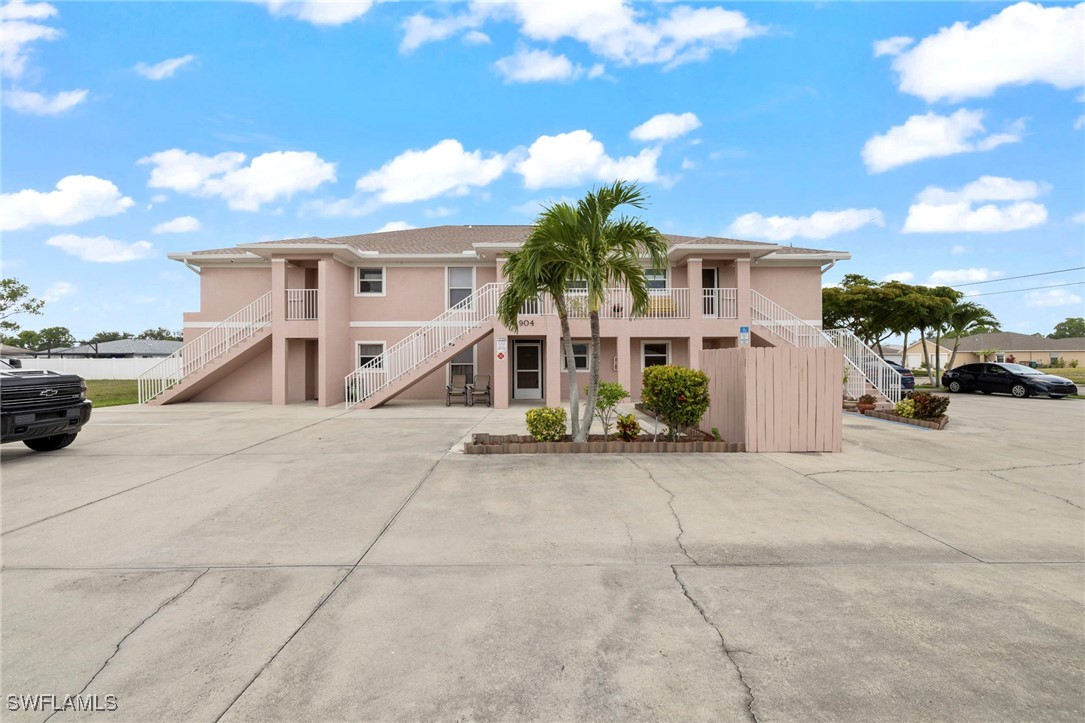
Active
$249,900
2
bds
|
2
ba
|
1,116
sqft
|
built
2006
904 SE 13th St, Cape Coral, FL 33990
$-633
Cash flow
-13.2%
Cash-on-Cash Return
3.2%
Cap rate
0.7%
Rent to Value Ratio
Active
$1,000,000
4
bds
|
3
ba
|
2,596
sqft
|
built
2017
1921 SE 12th St, Cape Coral, FL 33990
$-2,393
Cash flow
-12.5%
Cash-on-Cash Return
3.4%
Cap rate
0.6%
Rent to Value Ratio
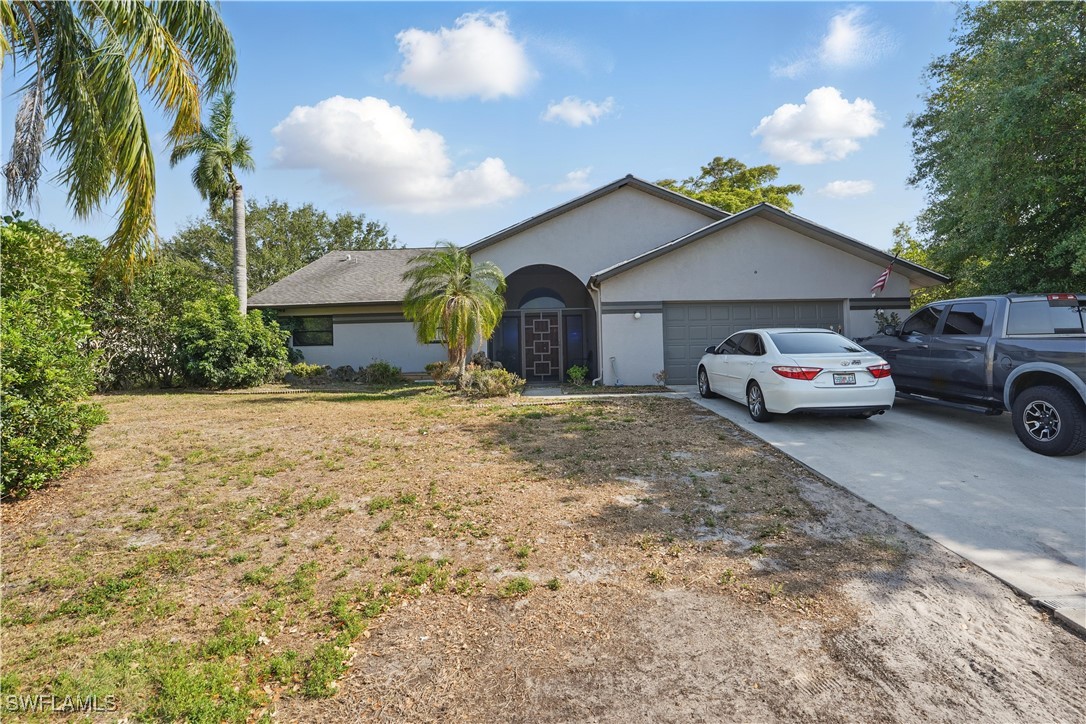
Active
$360,000
3
bds
|
2
ba
|
1,957
sqft
|
built
2004
824 SE 3rd Pl, Cape Coral, FL 33990
$-636
Cash flow
-9.2%
Cash-on-Cash Return
4.2%
Cap rate
0.6%
Rent to Value Ratio
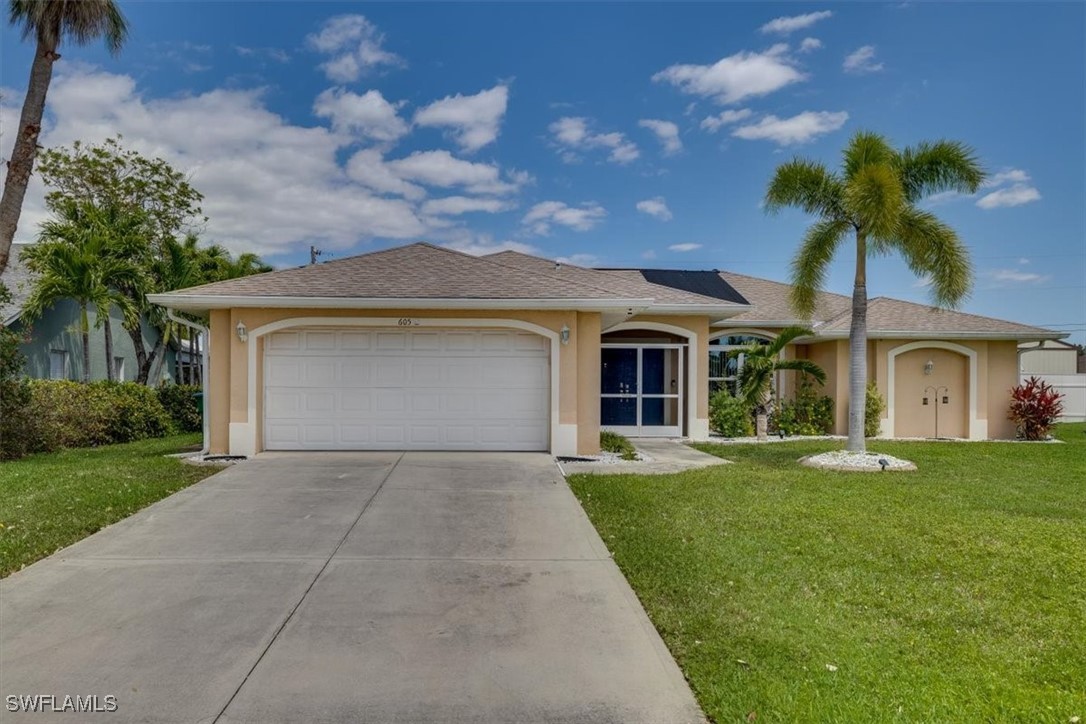
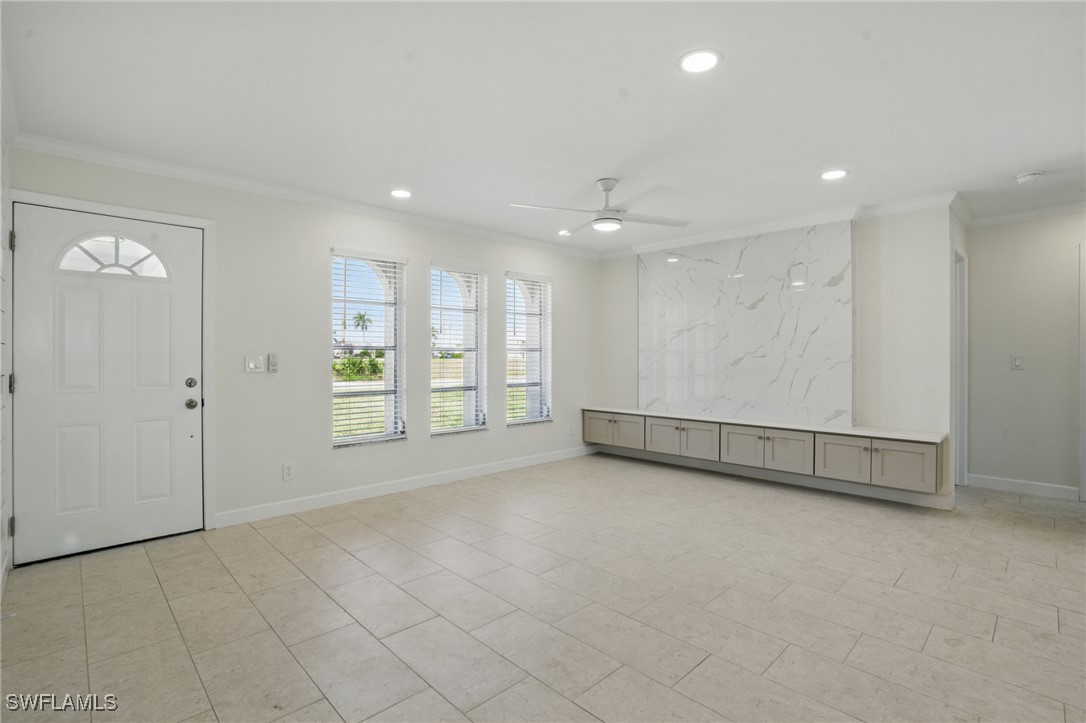
Active
$435,000
3
bds
|
2
ba
|
1,707
sqft
|
built
2011
605 SE 22nd St, Cape Coral, FL 33990
$-752
Cash flow
-9.0%
Cash-on-Cash Return
4.2%
Cap rate
0.6%
Rent to Value Ratio
Active
$344,000
3
bds
|
2
ba
|
1,226
sqft
|
built
1986
2203 SE Santa Barbara Pl, Cape Coral, FL 33990
$-536
Cash flow
-8.1%
Cash-on-Cash Return
4.4%
Cap rate
0.6%
Rent to Value Ratio
Active
$375,000
3
bds
|
2
ba
|
1,589
sqft
|
built
1987
1845 SE 5th St, Cape Coral, FL 33990
$-560
Cash flow
-7.8%
Cash-on-Cash Return
4.5%
Cap rate
0.6%
Rent to Value Ratio
Active
$379,900
4
bds
|
2
ba
|
0
sqft
|
built
1978
1013 SE 9th St, Cape Coral, FL 33990
$-1,312
Cash flow
-18.0%
Cash-on-Cash Return
2.1%
Cap rate
0.4%
Rent to Value Ratio
Active
$379,900
2
bds
|
2
ba
|
2,723
sqft
|
built
1988
850 SE 1st Ter, Cape Coral, FL 33990
$-279
Cash flow
-3.8%
Cash-on-Cash Return
5.4%
Cap rate
0.7%
Rent to Value Ratio
Active
$398,500
3
bds
|
2
ba
|
1,692
sqft
|
built
1988
2216 SE 8th Ter, Cape Coral, FL 33990
$-515
Cash flow
-6.7%
Cash-on-Cash Return
4.7%
Cap rate
0.7%
Rent to Value Ratio
Active
$320,000
3
bds
|
2
ba
|
1,526
sqft
|
built
1984
1140 SE 17th Ter, Cape Coral, FL 33990
$-627
Cash flow
-10.2%
Cash-on-Cash Return
3.9%
Cap rate
0.6%
Rent to Value Ratio
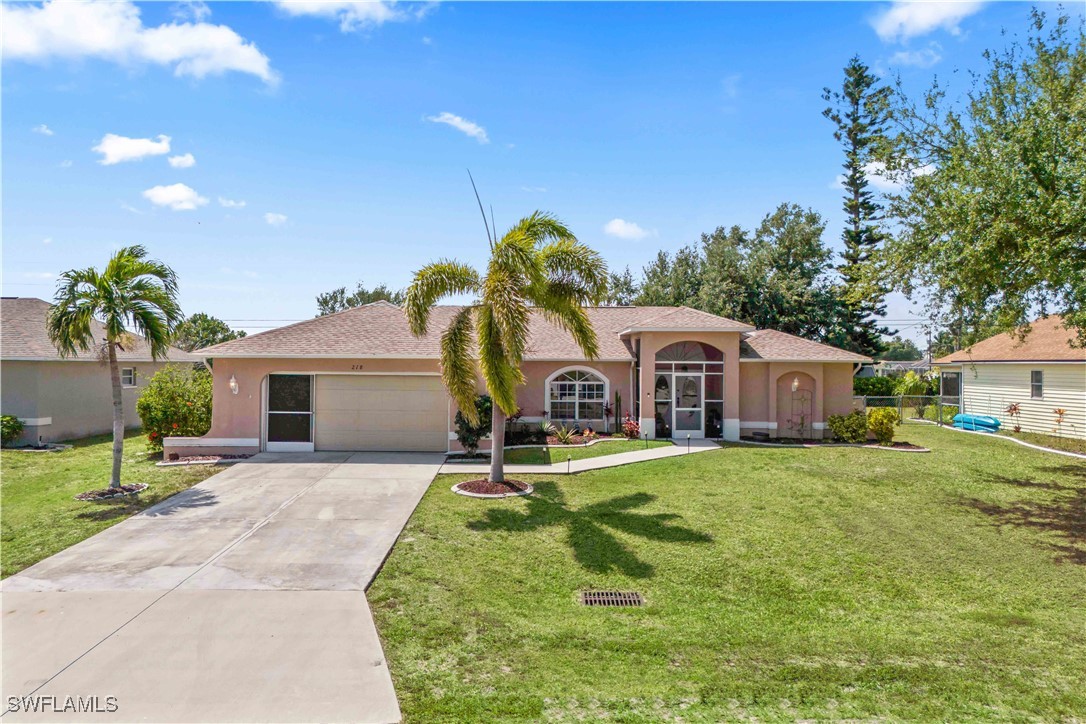
Pending
$325,000
3
bds
|
2
ba
|
1,629
sqft
|
built
2005
218 SE 15th Ave, Cape Coral, FL 33990
$-563
Cash flow
-9.0%
Cash-on-Cash Return
4.2%
Cap rate
0.7%
Rent to Value Ratio
Active
$398,500
3
bds
|
2
ba
|
1,549
sqft
|
built
1988
138 SE 18th Ter, Cape Coral, FL 33990
$-545
Cash flow
-7.1%
Cash-on-Cash Return
4.6%
Cap rate
0.7%
Rent to Value Ratio
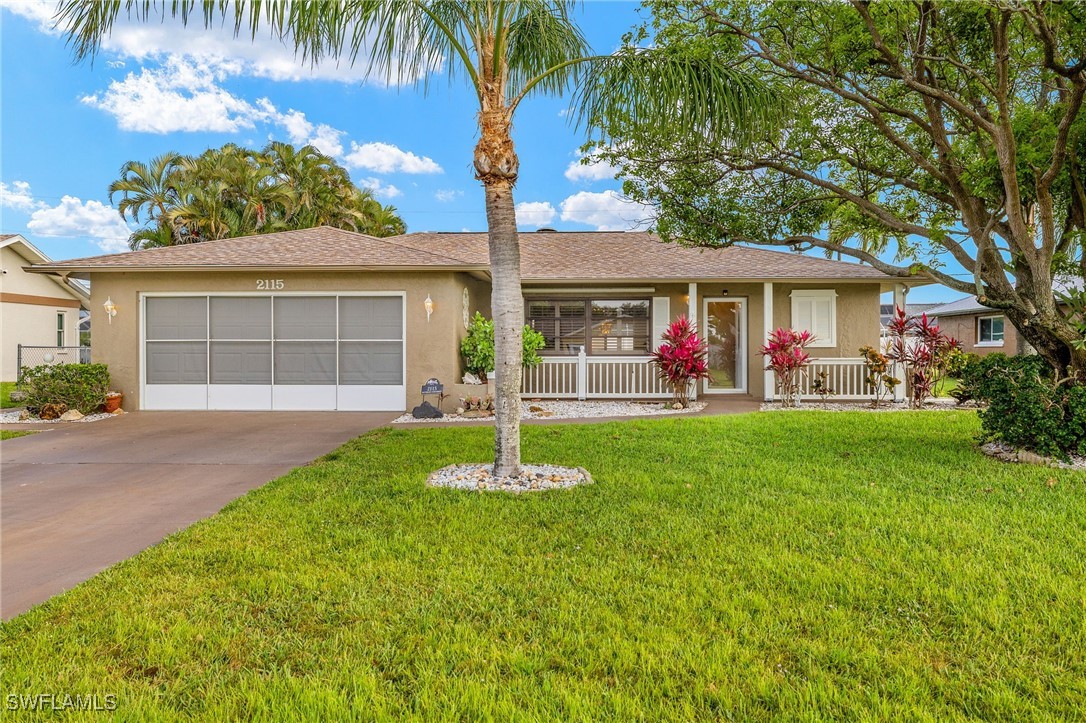
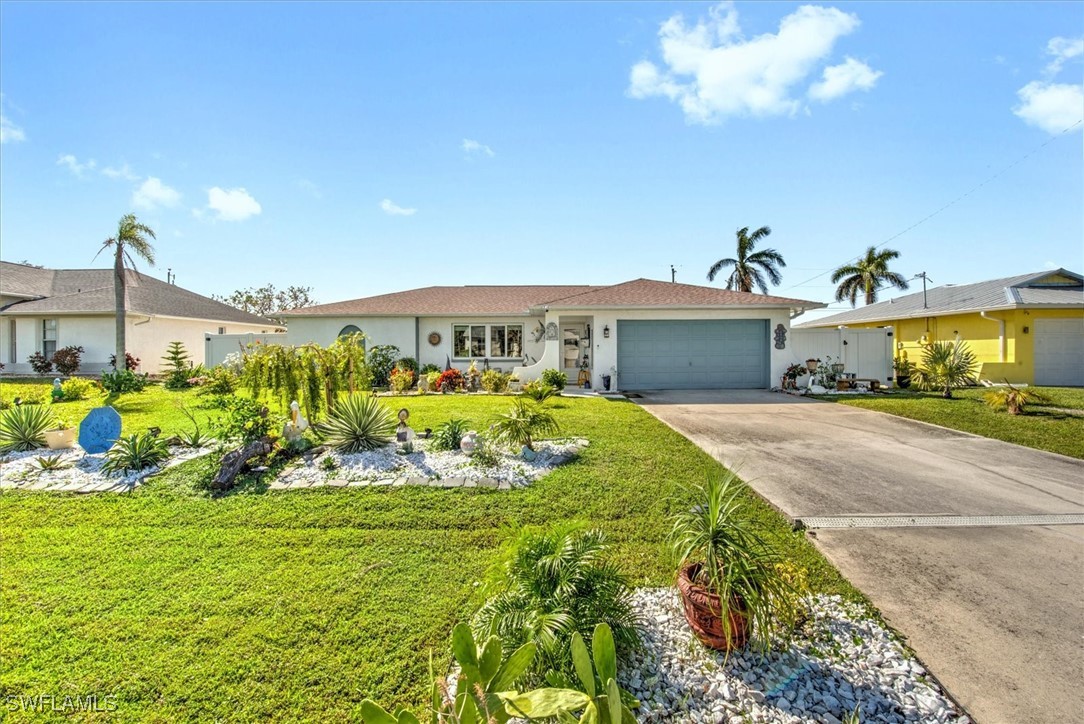
Active
$299,900
2
bds
|
2
ba
|
1,099
sqft
|
built
1986
2115 SE 11th St, Cape Coral, FL 33990
$-445
Cash flow
-7.7%
Cash-on-Cash Return
4.5%
Cap rate
0.7%
Rent to Value Ratio
Active
$579,000
3
bds
|
2
ba
|
1,658
sqft
|
built
1985
1442 SE 15th Ter, Cape Coral, FL 33990
$-980
Cash flow
-8.8%
Cash-on-Cash Return
4.3%
Cap rate
0.6%
Rent to Value Ratio
Active
$375,000
3
bds
|
3
ba
|
1,808
sqft
|
built
1986
1436 SE 17th Ter, Cape Coral, FL 33990
$-526
Cash flow
-7.3%
Cash-on-Cash Return
4.6%
Cap rate
0.7%
Rent to Value Ratio
Active
$549,900
3
bds
|
2
ba
|
1,636
sqft
|
built
1980
1917 SE 19th Ln, Cape Coral, FL 33990
$-1,103
Cash flow
-10.5%
Cash-on-Cash Return
3.9%
Cap rate
0.6%
Rent to Value Ratio
Active
$440,000
3
bds
|
3
ba
|
2,309
sqft
|
built
2001
940 SE 20th Pl, Cape Coral, FL 33990
$-265
Cash flow
-3.1%
Cash-on-Cash Return
5.6%
Cap rate
0.8%
Rent to Value Ratio
Active
$324,999
4
bds
|
2
ba
|
1,823
sqft
|
built
1999
1441 SE 19th Ter, Cape Coral, FL 33990
$-429
Cash flow
-6.9%
Cash-on-Cash Return
4.7%
Cap rate
0.8%
Rent to Value Ratio
Active
$440,000
3
bds
|
3
ba
|
2,309
sqft
|
built
2001
940 SE 20th Ct, Cape Coral, FL 33990
$-610
Cash flow
-7.2%
Cash-on-Cash Return
4.6%
Cap rate
0.7%
Rent to Value Ratio
Active
$488,000
2
bds
|
2
ba
|
1,244
sqft
|
built
1966
2032 Coral Point Dr, Cape Coral, FL 33990
$-1,230
Cash flow
-13.2%
Cash-on-Cash Return
3.3%
Cap rate
0.5%
Rent to Value Ratio
Active
$474,900
4
bds
|
3
ba
|
2,495
sqft
|
built
2002
1912 Bolado Pkwy, Cape Coral, FL 33990
$-752
Cash flow
-8.3%
Cash-on-Cash Return
4.4%
Cap rate
0.7%
Rent to Value Ratio
Active
$419,900
3
bds
|
2
ba
|
1,834
sqft
|
built
1997
408 SE 19th Ln, Cape Coral, FL 33990
$-730
Cash flow
-9.1%
Cash-on-Cash Return
4.2%
Cap rate
0.7%
Rent to Value Ratio
Active
$589,000
3
bds
|
2
ba
|
1,964
sqft
|
built
1998
1814 SE 9th Ter, Cape Coral, FL 33990
$-1,391
Cash flow
-12.3%
Cash-on-Cash Return
3.4%
Cap rate
0.5%
Rent to Value Ratio
Active under contract
$550,000
3
bds
|
2
ba
|
2,303
sqft
|
built
2002
1824 SE 20th Ln, Cape Coral, FL 33990
$-1,155
Cash flow
-11.0%
Cash-on-Cash Return
3.8%
Cap rate
0.6%
Rent to Value Ratio
Active
$525,000
5
bds
|
3
ba
|
2,618
sqft
|
built
1983
1725 SE 3rd St, Cape Coral, FL 33990
$-398
Cash flow
-4.0%
Cash-on-Cash Return
5.4%
Cap rate
0.7%
Rent to Value Ratio
Active
$295,000
3
bds
|
2
ba
|
1,295
sqft
|
built
1987
2309 SE 15th Ter, Cape Coral, FL 33990
$-60
Cash flow
-1.1%
Cash-on-Cash Return
6.0%
Cap rate
0.8%
Rent to Value Ratio
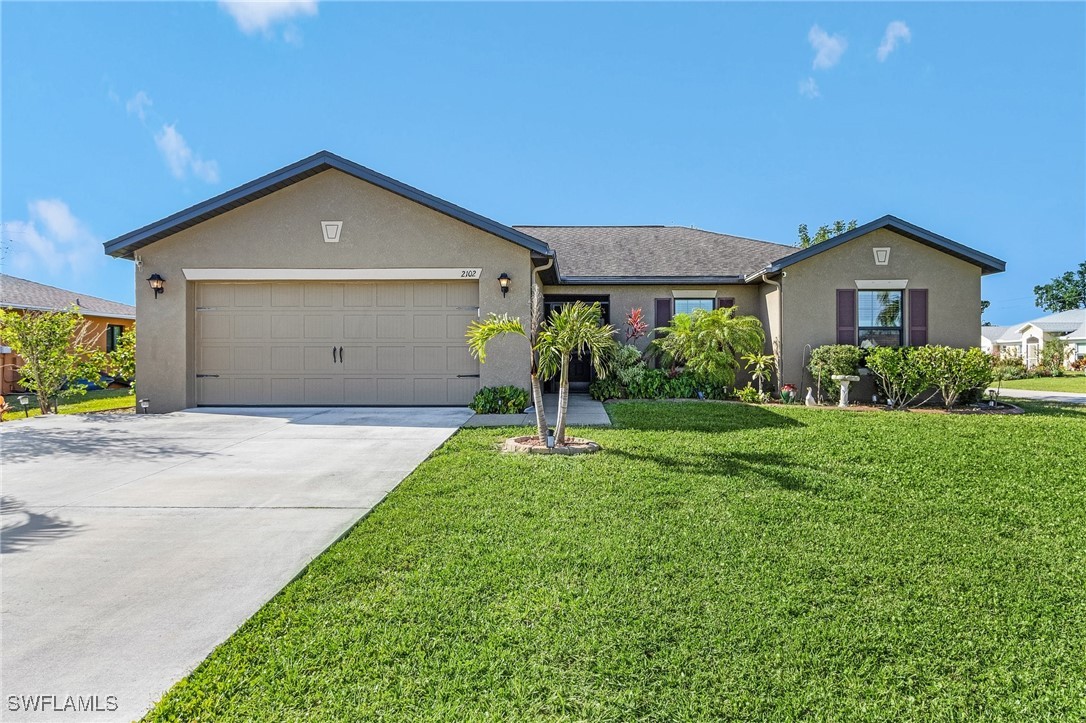
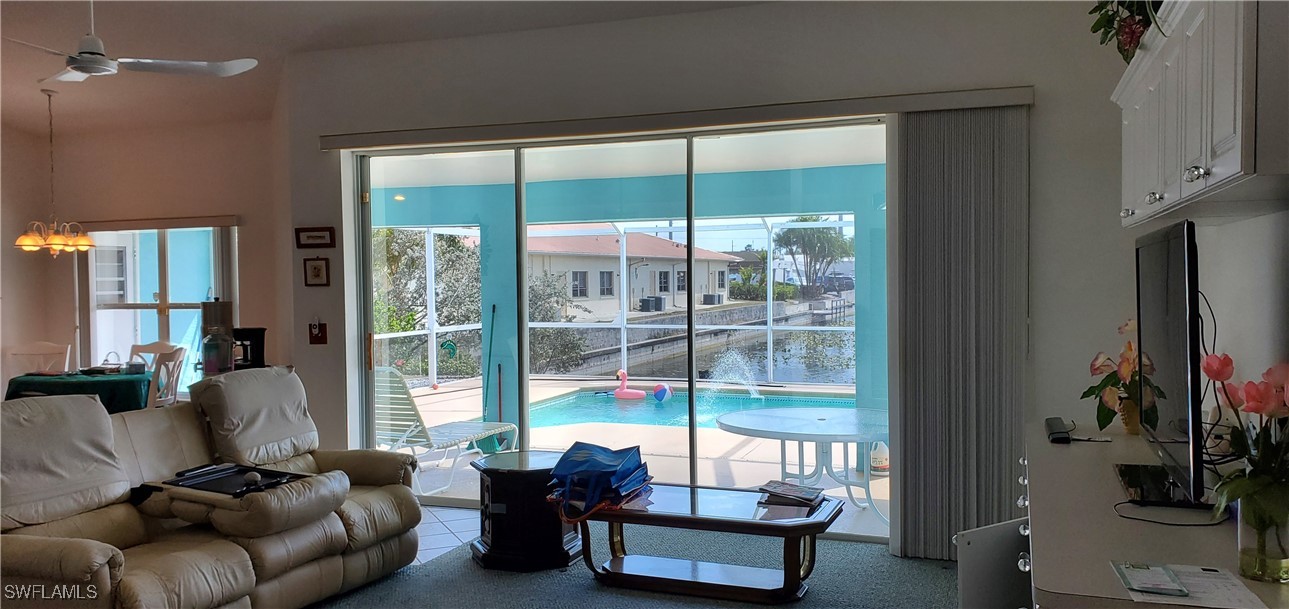
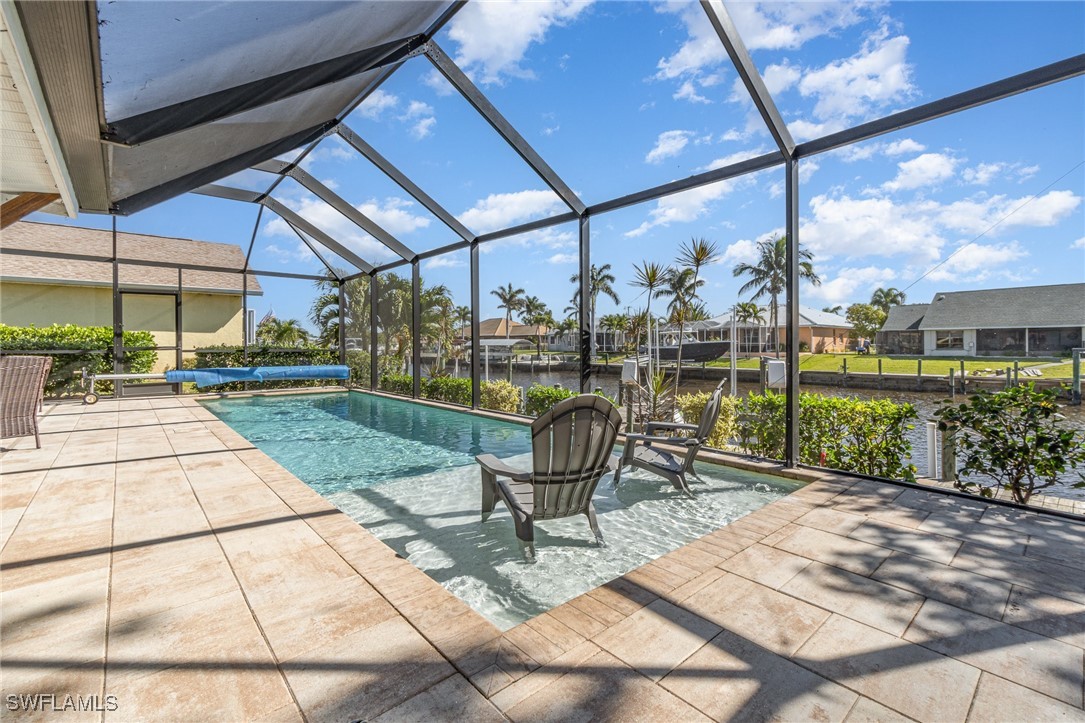
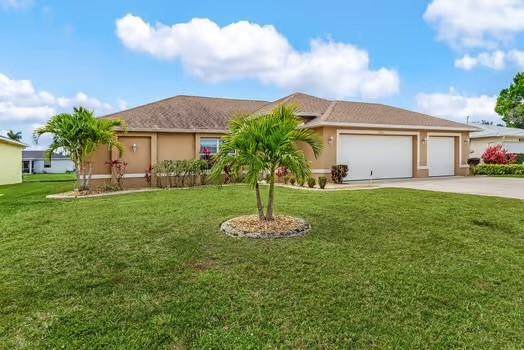
Active
$364,999
3
bds
|
2
ba
|
1,522
sqft
|
built
2017
2102 Bolado Pkwy, Cape Coral, FL 33990
$-270
Cash flow
-3.9%
Cash-on-Cash Return
5.4%
Cap rate
0.8%
Rent to Value Ratio
Active
$490,000
3
bds
|
2
ba
|
1,628
sqft
|
built
2001
9 SE 15th Ave, Cape Coral, FL 33990
$-822
Cash flow
-8.8%
Cash-on-Cash Return
4.3%
Cap rate
0.6%
Rent to Value Ratio
Active
$599,900
3
bds
|
2
ba
|
2,230
sqft
|
built
1977
1311 SE 20th Ct, Cape Coral, FL 33990
$-1,086
Cash flow
-9.4%
Cash-on-Cash Return
4.1%
Cap rate
0.7%
Rent to Value Ratio
Active
$549,500
3
bds
|
2
ba
|
1,485
sqft
|
built
2019
2202 SE 8th St, Cape Coral, FL 33990
$-1,824
Cash flow
-17.3%
Cash-on-Cash Return
2.3%
Cap rate
0.5%
Rent to Value Ratio