34479 Investment Properties for Sale
Browse homes for sale and investment properties in 34479. Refine your search by price, property type, or more.
Best cash flowing properties in 34479
Active
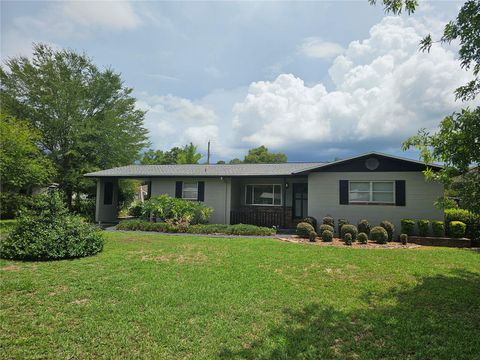
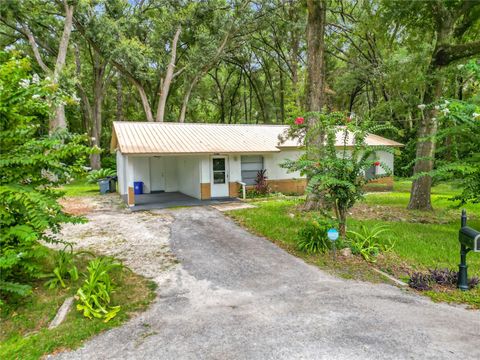
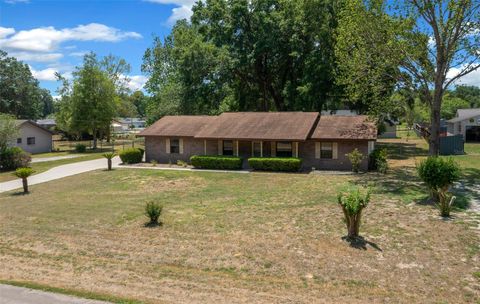
$274,900
3
bds
|
2
ba
|
1,624
sqft
|
built
1969
1000 NE 45th St, Ocala, FL 34479
$122
Cash flow
2.3%
Cash-on-Cash Return
6.7%
Cap rate
0.9%
Rent to Value Ratio
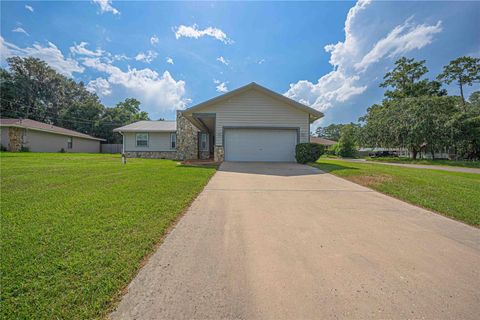
Active
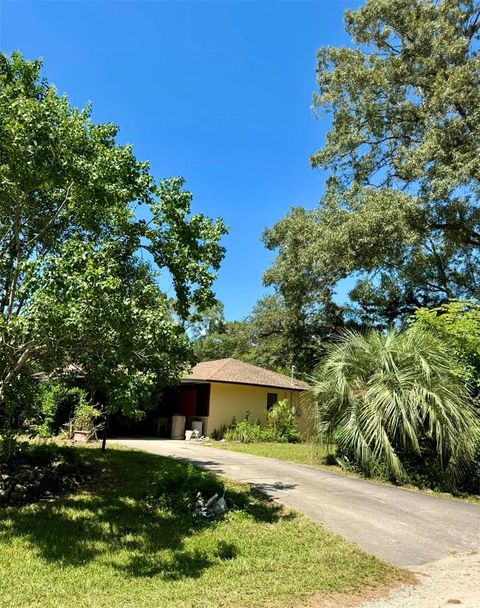
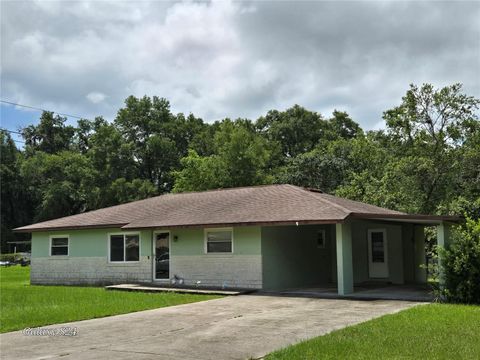
$219,000
3
bds
|
2
ba
|
1,284
sqft
|
built
1985
3725 NE 18th Ave, Ocala, FL 34479
$26
Cash flow
0.6%
Cash-on-Cash Return
6.3%
Cap rate
0.8%
Rent to Value Ratio
17 out of 22 properties for sale in 34479
Limited Results Shown
Create a free account, or log in to reveal all property listings and enjoy the complete experience.
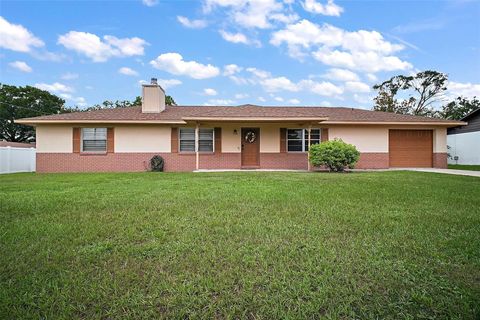
Active
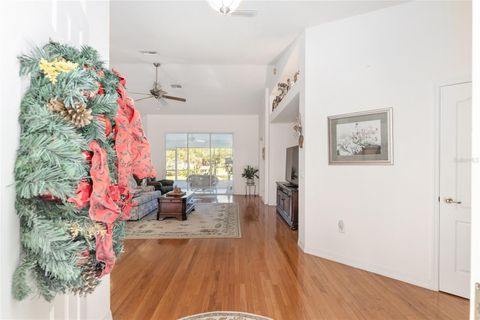
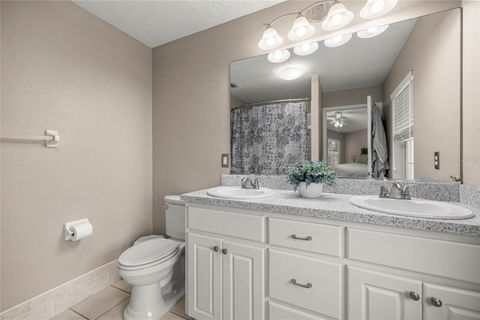
$525,000
4
bds
|
2
ba
|
2,526
sqft
|
built
2002
999 NE 120th Pl, Ocala, FL 34479
$-796
Cash flow
-7.9%
Cash-on-Cash Return
4.3%
Cap rate
0.6%
Rent to Value Ratio
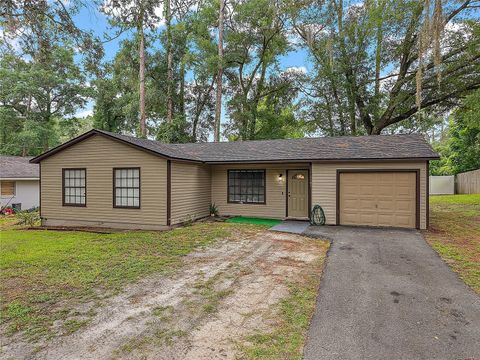
Active
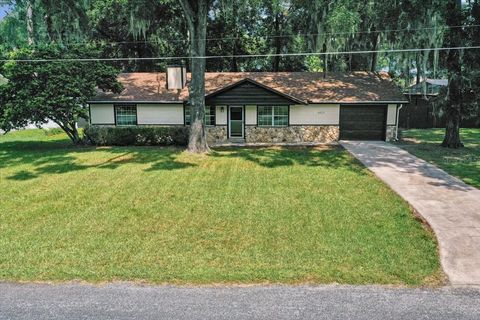
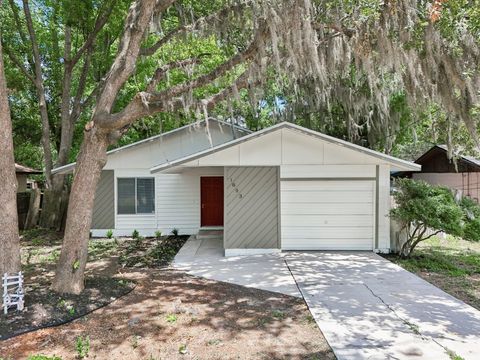
$232,999
3
bds
|
2
ba
|
1,300
sqft
|
built
1983
4025 NE 29th Ct, Ocala, FL 34479
$-352
Cash flow
-7.9%
Cash-on-Cash Return
4.3%
Cap rate
0.6%
Rent to Value Ratio
Active
$210,000
3
bds
|
2
ba
|
1,014
sqft
|
built
1982
3611 NE 15th Ave, Ocala, FL 34479
$-313
Cash flow
-7.8%
Cash-on-Cash Return
4.4%
Cap rate
0.6%
Rent to Value Ratio
Active
$249,900
3
bds
|
2
ba
|
1,502
sqft
|
built
1986
4490 NE 2nd Ct, Ocala, FL 34479
$-312
Cash flow
-6.5%
Cash-on-Cash Return
4.6%
Cap rate
0.7%
Rent to Value Ratio
Active
$259,900
3
bds
|
2
ba
|
1,475
sqft
|
built
1983
2635 NE 60th Ln, Ocala, FL 34479
$-184
Cash flow
-3.7%
Cash-on-Cash Return
5.3%
Cap rate
0.7%
Rent to Value Ratio
Active
$235,000
3
bds
|
2
ba
|
1,062
sqft
|
built
1984
2404 NE 32nd Pl, Ocala, FL 34479
$-311
Cash flow
-6.9%
Cash-on-Cash Return
4.6%
Cap rate
0.7%
Rent to Value Ratio
Active
$249,900
3
bds
|
2
ba
|
1,451
sqft
|
built
1990
164 NE 53rd St, Ocala, FL 34479
$-156
Cash flow
-3.3%
Cash-on-Cash Return
5.4%
Cap rate
0.7%
Rent to Value Ratio
Active
$229,900
3
bds
|
2
ba
|
1,289
sqft
|
built
1978
2100 NE 54th St, Ocala, FL 34479
$-99
Cash flow
-2.2%
Cash-on-Cash Return
5.6%
Cap rate
0.7%
Rent to Value Ratio
Active
$329,000
3
bds
|
2
ba
|
1,924
sqft
|
built
1999
380 NE 53rd St, Ocala, FL 34479
$-178
Cash flow
-2.8%
Cash-on-Cash Return
5.5%
Cap rate
0.7%
Rent to Value Ratio
Active
$239,000
3
bds
|
2
ba
|
1,328
sqft
|
built
1983
1803 NE 29th Pl, Ocala, FL 34479
$-382
Cash flow
-8.3%
Cash-on-Cash Return
4.2%
Cap rate
0.7%
Rent to Value Ratio
Active
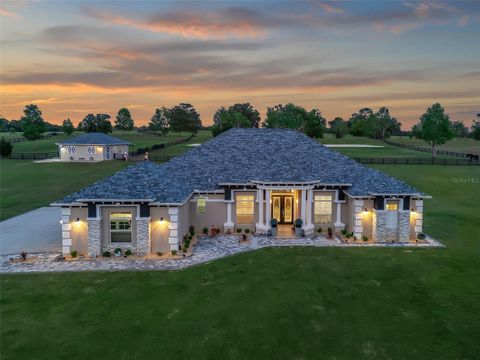
$1,999,000
4
bds
|
3
ba
|
3,641
sqft
|
built
2021
7161 NE 22nd Court Rd, Ocala, FL 34479
$-7,374
Cash flow
-19.2%
Cash-on-Cash Return
1.7%
Cap rate
0.3%
Rent to Value Ratio

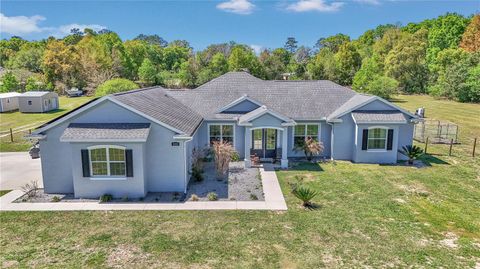
Active
$229,000
3
bds
|
2
ba
|
1,092
sqft
|
built
1985
2690 NE 42nd Pl, Ocala, FL 34479
$-337
Cash flow
-7.7%
Cash-on-Cash Return
4.4%
Cap rate
0.7%
Rent to Value Ratio
Active
$1,700,000
3
bds
|
3
ba
|
2,488
sqft
|
built
2018
4420 NE 7th Ave, Ocala, FL 34479
$-6,985
Cash flow
-21.4%
Cash-on-Cash Return
1.2%
Cap rate
0.2%
Rent to Value Ratio
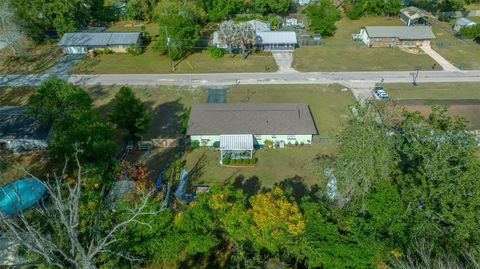
Active
$257,000
3
bds
|
2
ba
|
1,211
sqft
|
built
1973
2004 NE 52nd St, Ocala, FL 34479
$-309
Cash flow
-6.3%
Cash-on-Cash Return
4.7%
Cap rate
0.7%
Rent to Value Ratio
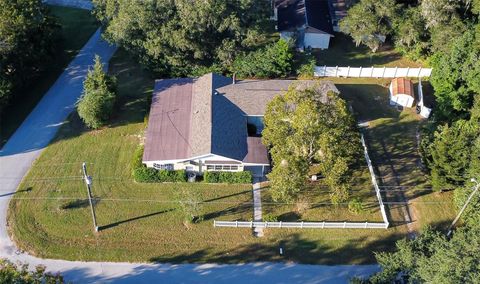
Active
$459,990
4
bds
|
4
ba
|
2,982
sqft
|
built
1958
1501 NE 57th St, Ocala, FL 34479
$-2,143
Cash flow
-24.3%
Cash-on-Cash Return
0.6%
Cap rate
0.2%
Rent to Value Ratio