34653 Investment Properties for Sale
Browse homes for sale and investment properties in 34653. Refine your search by price, property type, or more.
Best cash flowing properties in 34653
Active
$195,000
2
bds
|
2
ba
|
1,008
sqft
|
built
1981
4042 Boulder Dr, New Port Richey, FL 34653
$-132
Cash flow
-3.5%
Cash-on-Cash Return
5.3%
Cap rate
0.8%
Rent to Value Ratio
Active
$210,000
3
bds
|
1
ba
|
992
sqft
|
built
1977
4202 Las Vegas Dr, New Port Richey, FL 34653
$-155
Cash flow
-3.9%
Cash-on-Cash Return
5.3%
Cap rate
0.8%
Rent to Value Ratio
87 out of 95 properties for sale in 34653
Limited Results Shown
Create a free account, or log in to reveal all property listings and enjoy the complete experience.

Active
$334,900
3
bds
|
2
ba
|
1,583
sqft
|
built
2003
6446 Louisiana Ave, New Port Richey, FL 34653
$-803
Cash flow
-12.5%
Cash-on-Cash Return
3.3%
Cap rate
0.6%
Rent to Value Ratio

Pending
$325,000
2
bds
|
2
ba
|
1,074
sqft
|
built
1978
7325 Calder Dr, New Port Richey, FL 34653
$-568
Cash flow
-9.1%
Cash-on-Cash Return
4.1%
Cap rate
0.6%
Rent to Value Ratio

Active
$440,000
3
bds
|
2
ba
|
2,243
sqft
|
built
1972
7026 Lenape Cir, New Port Richey, FL 34653
$-952
Cash flow
-11.3%
Cash-on-Cash Return
3.6%
Cap rate
0.6%
Rent to Value Ratio
Active
$262,900
3
bds
|
2
ba
|
1,165
sqft
|
built
1985
5147 Larch Ln, New Port Richey, FL 34653
$-452
Cash flow
-9.0%
Cash-on-Cash Return
4.1%
Cap rate
0.7%
Rent to Value Ratio

Active
$639,000
4
bds
|
3
ba
|
2,627
sqft
|
built
1978
6370 Conniewood Sq, New Port Richey, FL 34653
$-2,430
Cash flow
-19.8%
Cash-on-Cash Return
1.6%
Cap rate
0.3%
Rent to Value Ratio
Active
$344,900
3
bds
|
2
ba
|
1,592
sqft
|
built
1997
7235 Sharpsburg Blvd, New Port Richey, FL 34653
$-426
Cash flow
-6.4%
Cash-on-Cash Return
4.7%
Cap rate
0.6%
Rent to Value Ratio

Active
$139,900
2
bds
|
1
ba
|
950
sqft
|
built
1988
7828 Hardwick Dr, New Port Richey, FL 34653
$-169
Cash flow
-6.3%
Cash-on-Cash Return
4.7%
Cap rate
1.1%
Rent to Value Ratio

Active
$240,000
3
bds
|
2
ba
|
1,119
sqft
|
built
1979
7708 Belah Dr, New Port Richey, FL 34653
$-445
Cash flow
-9.7%
Cash-on-Cash Return
3.9%
Cap rate
0.7%
Rent to Value Ratio
Active
$275,000
2
bds
|
1
ba
|
834
sqft
|
built
1964
6627 Main St, New Port Richey, FL 34653
$-300
Cash flow
-5.7%
Cash-on-Cash Return
4.8%
Cap rate
0.7%
Rent to Value Ratio

Active
$299,900
2
bds
|
2
ba
|
1,338
sqft
|
built
1987
4505 Alligator Dr, New Port Richey, FL 34653
$-502
Cash flow
-8.7%
Cash-on-Cash Return
4.1%
Cap rate
0.7%
Rent to Value Ratio
Active
$349,111
2
bds
|
2
ba
|
1,542
sqft
|
built
1973
5736 Colonial Dr, New Port Richey, FL 34653
$-725
Cash flow
-10.8%
Cash-on-Cash Return
3.7%
Cap rate
0.6%
Rent to Value Ratio

Active
$265,000
3
bds
|
2
ba
|
1,182
sqft
|
built
1970
7435 Hollyridge Dr, New Port Richey, FL 34653
$-316
Cash flow
-6.2%
Cash-on-Cash Return
4.7%
Cap rate
0.7%
Rent to Value Ratio

Pending
$384,000
3
bds
|
2
ba
|
2,065
sqft
|
built
1994
4320 Northampton Dr, New Port Richey, FL 34653
$-603
Cash flow
-8.2%
Cash-on-Cash Return
4.3%
Cap rate
0.6%
Rent to Value Ratio

Active
$575,000
6
bds
|
6
ba
|
3,392
sqft
|
built
1972
6621 Congress St, New Port Richey, FL 34653
$-2,540
Cash flow
-23.0%
Cash-on-Cash Return
0.8%
Cap rate
0.2%
Rent to Value Ratio

Active
$350,000
3
bds
|
2
ba
|
1,595
sqft
|
built
1989
4420 Devon Dr, New Port Richey, FL 34653
$-542
Cash flow
-8.1%
Cash-on-Cash Return
4.3%
Cap rate
0.6%
Rent to Value Ratio
Active
$325,000
3
bds
|
2
ba
|
1,286
sqft
|
built
1980
7553 Sequoia Dr, New Port Richey, FL 34653
$-771
Cash flow
-12.4%
Cash-on-Cash Return
3.3%
Cap rate
0.6%
Rent to Value Ratio

Active
$221,800
2
bds
|
1
ba
|
816
sqft
|
built
1959
7139 Adare Dr, New Port Richey, FL 34653
$-229
Cash flow
-5.4%
Cash-on-Cash Return
4.9%
Cap rate
0.6%
Rent to Value Ratio

Active
$254,900
2
bds
|
2
ba
|
1,264
sqft
|
built
1974
6422 Tralee Ave, New Port Richey, FL 34653
$-309
Cash flow
-6.3%
Cash-on-Cash Return
4.7%
Cap rate
0.7%
Rent to Value Ratio

Active
$240,000
2
bds
|
2
ba
|
907
sqft
|
built
1988
7827 Crosier Ct, New Port Richey, FL 34653
$-212
Cash flow
-4.6%
Cash-on-Cash Return
5.1%
Cap rate
0.8%
Rent to Value Ratio

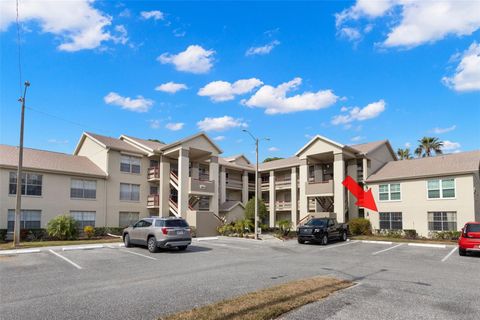
Active
$245,900
3
bds
|
3
ba
|
1,662
sqft
|
built
2011
8405 Blue Rock Dr, New Port Richey, FL 34653
$-305
Cash flow
-6.5%
Cash-on-Cash Return
4.7%
Cap rate
0.8%
Rent to Value Ratio

Active
$325,000
2
bds
|
2
ba
|
1,456
sqft
|
built
1996
4429 Whitton Way, New Port Richey, FL 34653
$-331
Cash flow
-5.3%
Cash-on-Cash Return
4.9%
Cap rate
0.7%
Rent to Value Ratio

Active
$445,000
3
bds
|
2
ba
|
1,222
sqft
|
built
1989
6701 Medlar Dr, New Port Richey, FL 34653
$-1,167
Cash flow
-13.7%
Cash-on-Cash Return
3.0%
Cap rate
0.4%
Rent to Value Ratio

Active
$500,000
2
bds
|
2
ba
|
1,429
sqft
|
built
1960
5560 Frances Ave, New Port Richey, FL 34653
$-946
Cash flow
-9.9%
Cash-on-Cash Return
3.9%
Cap rate
0.6%
Rent to Value Ratio

Active
$219,900
2
bds
|
2
ba
|
1,174
sqft
|
built
1987
4208 Boston Cir, New Port Richey, FL 34653
$-465
Cash flow
-11.0%
Cash-on-Cash Return
3.6%
Cap rate
0.8%
Rent to Value Ratio

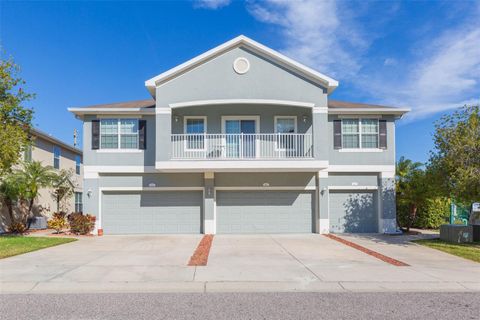
Active
$498,500
6
bds
|
3
ba
|
3,092
sqft
|
built
2021
6241 Spider Lily Way, New Port Richey, FL 34653
$-1,239
Cash flow
-13.0%
Cash-on-Cash Return
3.2%
Cap rate
0.6%
Rent to Value Ratio

Pending
$410,000
3
bds
|
2
ba
|
2,044
sqft
|
built
1992
4932 Wellbrook Dr, New Port Richey, FL 34653
$-670
Cash flow
-8.5%
Cash-on-Cash Return
4.2%
Cap rate
0.7%
Rent to Value Ratio

Active
$260,000
2
bds
|
2
ba
|
1,068
sqft
|
built
1969
6926 Echo Lake Dr, New Port Richey, FL 34653
$-399
Cash flow
-8.0%
Cash-on-Cash Return
4.3%
Cap rate
0.7%
Rent to Value Ratio

Active
$289,900
3
bds
|
2
ba
|
1,586
sqft
|
built
1978
6718 Ranchwood Loop, New Port Richey, FL 34653
$-414
Cash flow
-7.5%
Cash-on-Cash Return
4.4%
Cap rate
0.6%
Rent to Value Ratio

Active
$329,000
6
bds
|
4
ba
|
1,668
sqft
|
built
1960
6825 Main St, New Port Richey, FL 34653
$-597
Cash flow
-9.5%
Cash-on-Cash Return
4.0%
Cap rate
0.5%
Rent to Value Ratio

Active
$294,500
3
bds
|
2
ba
|
1,454
sqft
|
built
1974
5117 School Rd, New Port Richey, FL 34653
$-730
Cash flow
-12.9%
Cash-on-Cash Return
3.2%
Cap rate
0.6%
Rent to Value Ratio
Active
$230,000
3
bds
|
2
ba
|
1,233
sqft
|
built
1990
4529 Whitton Way, New Port Richey, FL 34653
$-211
Cash flow
-4.8%
Cash-on-Cash Return
5.0%
Cap rate
0.7%
Rent to Value Ratio

Active
$244,800
2
bds
|
1
ba
|
1,283
sqft
|
built
1973
7427 Congress St, New Port Richey, FL 34653
$-338
Cash flow
-7.2%
Cash-on-Cash Return
4.5%
Cap rate
0.7%
Rent to Value Ratio

Active
$280,000
3
bds
|
1
ba
|
1,207
sqft
|
built
1970
6303 Central Ave, New Port Richey, FL 34653
$-350
Cash flow
-6.5%
Cash-on-Cash Return
4.6%
Cap rate
0.8%
Rent to Value Ratio

Active
$745,000
4
bds
|
3
ba
|
2,755
sqft
|
built
2004
6131 Central Ave, New Port Richey, FL 34653
$-2,276
Cash flow
-15.9%
Cash-on-Cash Return
2.5%
Cap rate
0.4%
Rent to Value Ratio
Active
$179,900
2
bds
|
2
ba
|
1,025
sqft
|
built
1990
4529 Whitton Way, New Port Richey, FL 34653
$-460
Cash flow
-13.3%
Cash-on-Cash Return
3.1%
Cap rate
0.9%
Rent to Value Ratio

Pending
$219,900
2
bds
|
2
ba
|
1,076
sqft
|
built
1970
6920 Medlar Dr, New Port Richey, FL 34653
$-157
Cash flow
-3.7%
Cash-on-Cash Return
5.3%
Cap rate
0.8%
Rent to Value Ratio
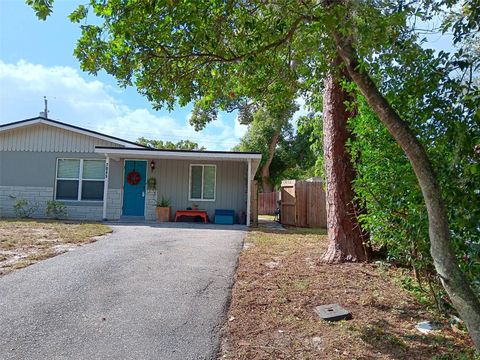
Active
$235,000
3
bds
|
1
ba
|
700
sqft
|
built
1962
7045 Lenox Dr, New Port Richey, FL 34653
$-354
Cash flow
-7.9%
Cash-on-Cash Return
4.3%
Cap rate
0.7%
Rent to Value Ratio
Active
$210,000
3
bds
|
1
ba
|
992
sqft
|
built
1977
4202 Las Vegas Dr, New Port Richey, FL 34653
$-155
Cash flow
-3.9%
Cash-on-Cash Return
5.3%
Cap rate
0.8%
Rent to Value Ratio
Active
$195,000
2
bds
|
2
ba
|
1,008
sqft
|
built
1981
4042 Boulder Dr, New Port Richey, FL 34653
$-132
Cash flow
-3.5%
Cash-on-Cash Return
5.3%
Cap rate
0.8%
Rent to Value Ratio
Active
$280,000
3
bds
|
3
ba
|
1,662
sqft
|
built
2011
8423 Blue Rock Dr, New Port Richey, FL 34653
$-495
Cash flow
-9.2%
Cash-on-Cash Return
4.0%
Cap rate
0.7%
Rent to Value Ratio