$2,700,000
Investment Summary
- Monthly Cash Flow
- -$9,050
- Cap Rate
- 1.7%
- Cash-on-Cash Return
- -17.5%
- Debt Coverage Ratio
- 0.29
- Internal Rate of Return (5 years)
- -12.9%
Cash Flow
Net Operating Income (NOI) minus mortgage payments.
Calculation:
NOI - Mortgage Payments
Cap Rate (Market Value)
Capitalization Rate is a rate of return that compares the yearly Net Operating Income (NOI) to the market value.
Calculation:
NOI / Market Value
Cash-on-Cash Return (CoC)
Annual Cash Flow / Cash Invested
Calculation:
Annual cash flow divided by initial cash invested.
Debt Coverage Ratio (DCR)
Net Operating Income (NOI) divided by total debt payments.
Calculation:
NOI / Total Debt Payments
Internal Rate of Return (IRR)
A metric for assessing profitability over time. IRR is the discount rate at which the net present value (NPV) of all future cash flows (positive and negative) from an investment equals zero — including both periodic cash flow (such as rent) and a projected sale at the end of the holding period. It represents the expected annualized return, accounting for income, expenses, and the recovery of capital through a future sale.
Property Description
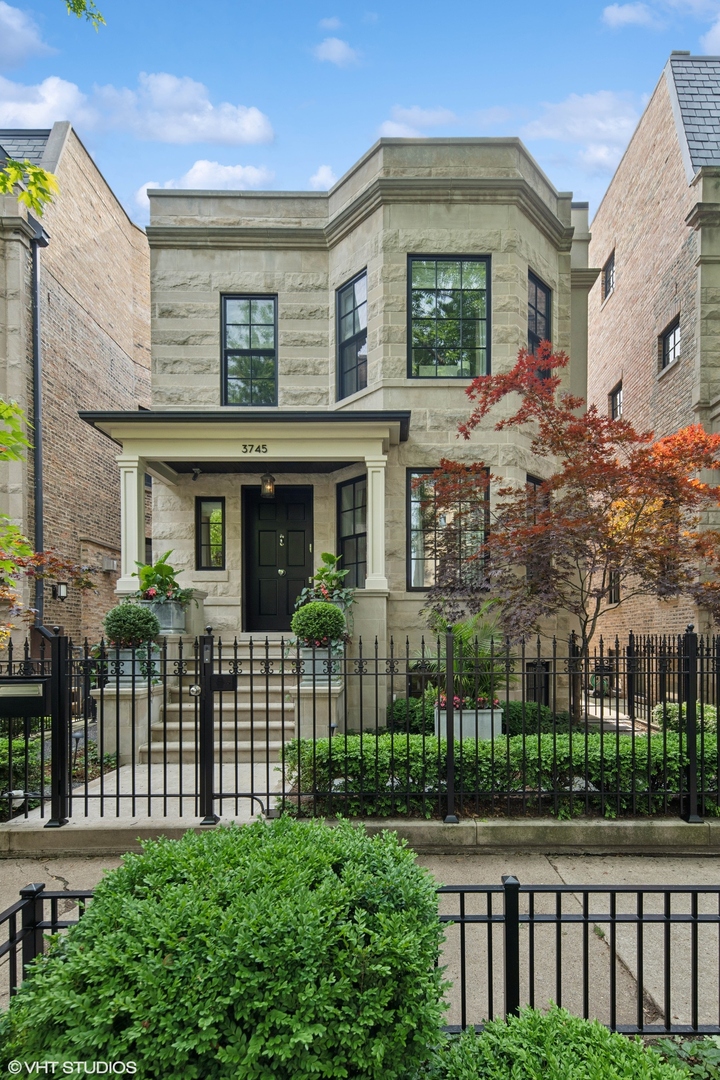
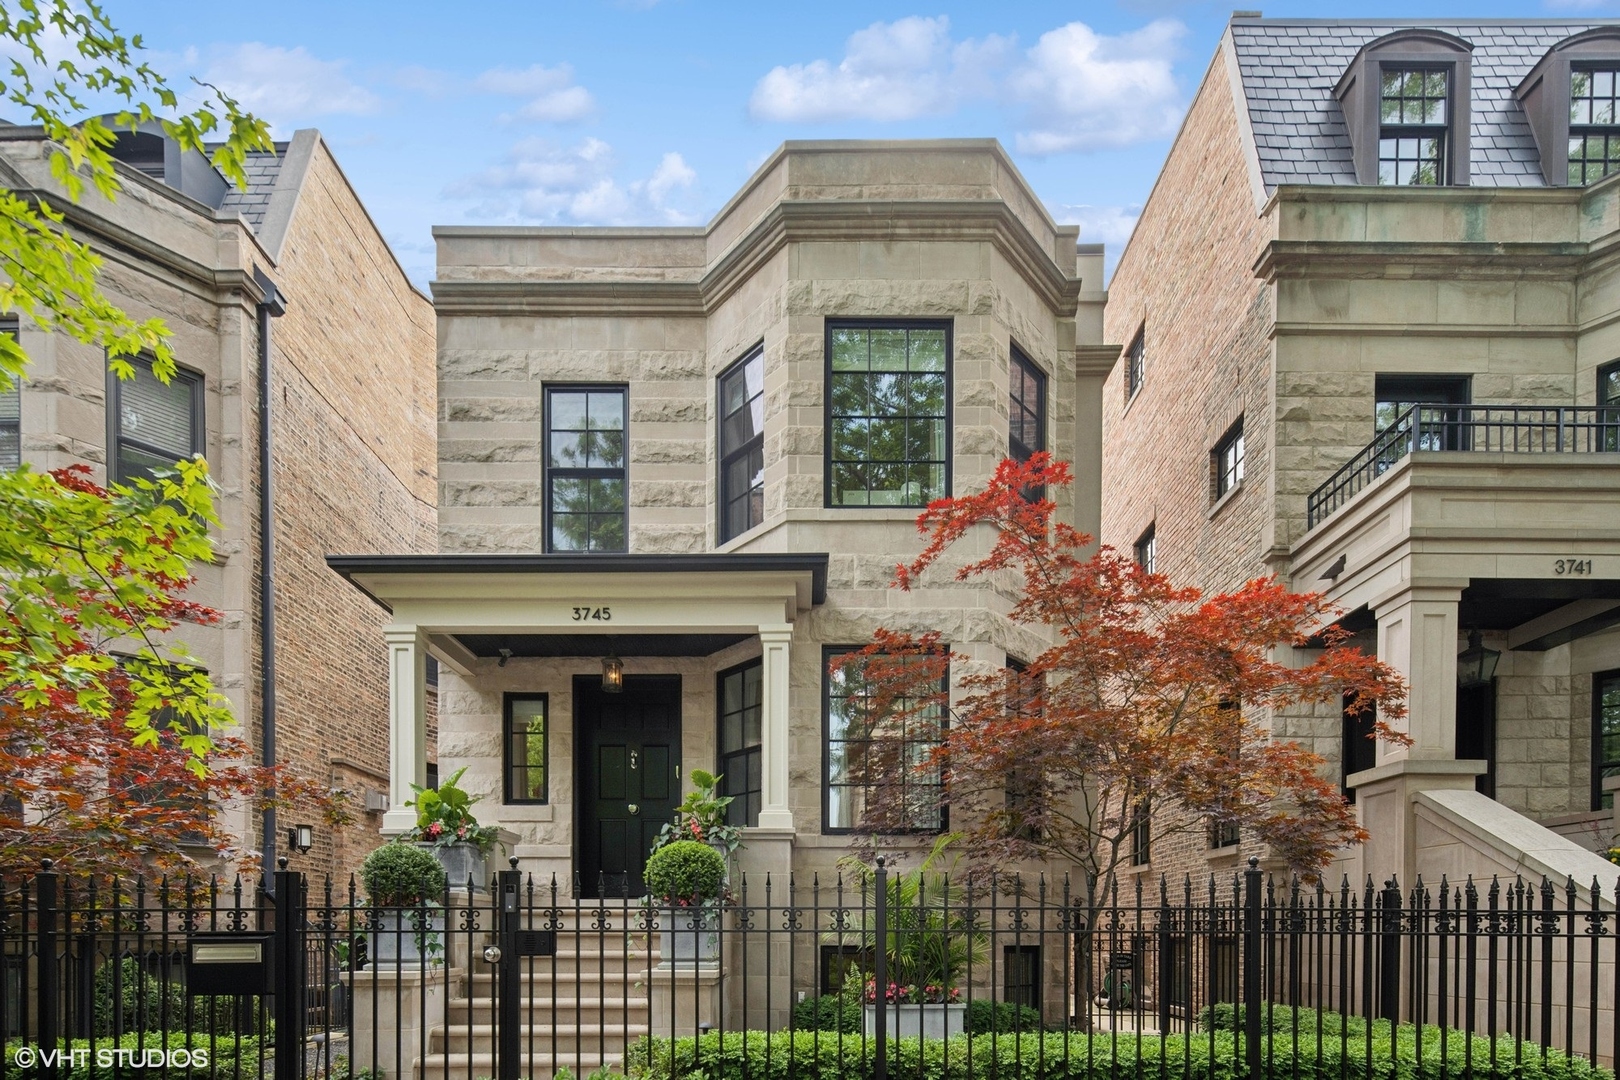
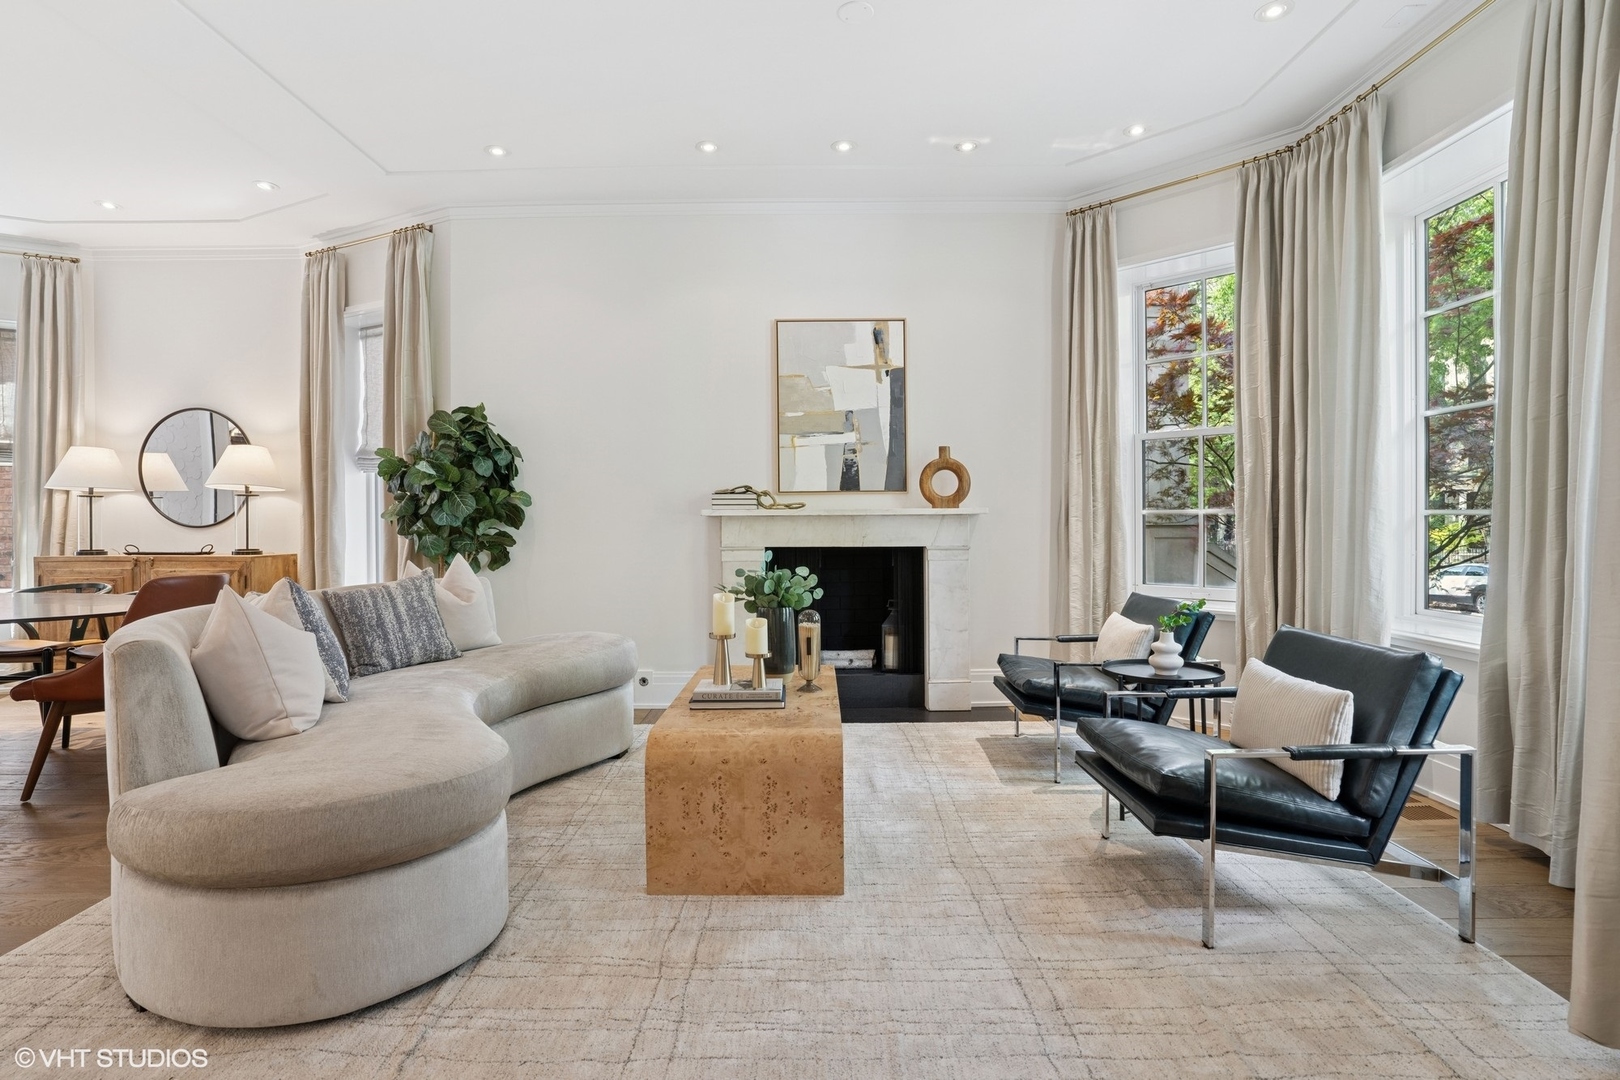
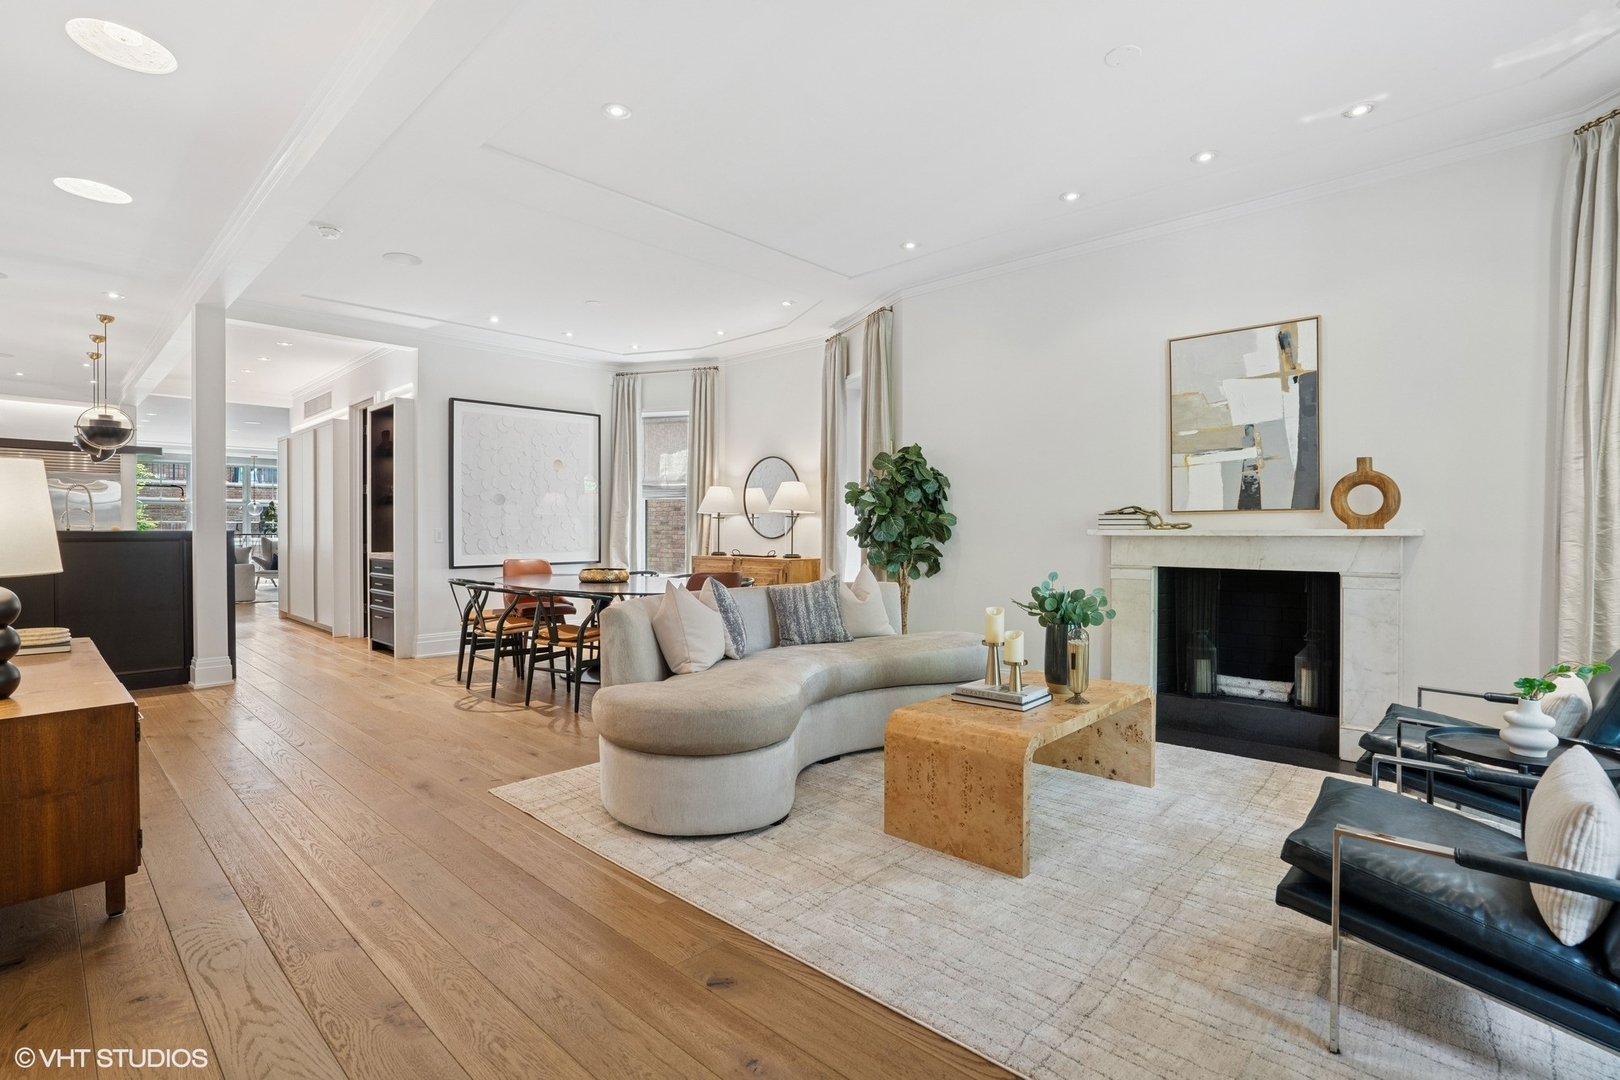
Architecturally stunning, completely custom 5 Bedroom | 3.1 Bathroom greystone on an extra-wide 30' lot, situated on one of the Southport Corridor's most idyllic, one-way streets within 2 blocks from coveted Blaine School District. This extraordinary residence features over 5100 sqf and was completely overhauled with superior attention to detail that includes wide-plank white oak flooring, detailed millwork and built-ins, one-of-a-kind lighting and draperies throughout. An imported, oversized front door leads to an open floor plan with large living room with vintage marble fireplace, separate dining area that is perfectly situated near the completely upgraded De Guilio Kitchen that offers a massive island, 60" Wolf double range, oversized SubZero fridge and wine refrigerator, Miele dishwasher, warming drawer and microwave and inlay cabinetry with built-in Siematic organization throughout. The kitchen overlooks a large family room that is flanked with a custom floor to ceiling window wall allowing for incredible natural light, cerused oak built-ins, gas fireplace with limestone surround and a separate built-in desk/homework station. A full, separate mudroom with organized closets plus bench and powder room with lacquered walls complete this level. The top floor features a primary suite oasis complete with an oversized bedroom, spa-like bathroom with Ann Sachs marble tile, oversized shower and separate soaking tub and a huge walk-in closet with separate spaces and built-in washer/dryer. A gorgeous office is attached to the primary suite and features 2 walls of windows, custom lacquered built-ins and library lighting and opens to a lovely 2nd floor rear terrace. 2 additional large bedrooms and a full bathroom with Ann Sachs tile and tub complete this level. The lower level offers a massive recreation room with soaring ceiling height, tons of natural light, radiant heat and is perfect for entertaining and features a separate nook ideal for workout equipment or play space. 2 additional large bedrooms including a front bedroom with a custom window seat, full bathroom with floor-to-ceiling porcelain tile and large shower, separate laundry room and an abundance of storage. The front and back yards were designed and landscaped by Chalet Landscaping feature boxwood gardens, blue stone pavers and a turfed backyard with room for an oversized trampoline. The garage rooftop deck was customized with a steel pergola, outdoor television, firepit and separate dining, lounging and sports/recreation spaces. All perfectly located within a few blocks from the Southport Corridor's retail, award-winning restaurants, coffee shops, grocery stores and transportation and a short stroll to numerous parks including Gallagher Way, Juniper Park and Blaine field. Impeccably updated and maintained, this home is ideal for the most discerning buyer who appreciates incomparable design elements with a functional floor plan set in an ideal location!
Build Your Team
Quickly find investor-friendly professionals who can help you succeed in real estate investing at any stage of the investing journey.


Agents
Match with investor-friendly agents who can help you find, analyze, and close your next deal


Lenders
Get the best funding…find investor-friendly lenders who specialize in your deal strategy


Property Managers
Transition to passive investing. Find a trusted property management partnership that lasts.


Tax Pros & Accountants
Taxes and financial reporting made easy—find experts to create tax savings strategies, file taxes, and more
Location
Property Details
Parking
- Description: Garage
- Details: Garage Door Opener, On Site, Detached, Garage
- Garage Spaces: 2
- Spaces Total: 2
Bedroom Information
- # of Bedrooms: 5
Bathroom Information
- # of Baths (Full): 3
- # of Baths (Partial): 1
- # of Baths (Total): 4.0
Interior Features
- # of Rooms: 11
- # of Stories: 2
- Basement: Yes
- Basement Description: Finished, Exterior Entry, Full, Daylight
- Fireplace: Yes
Exterior Features
- Exterior Walls Materials: Masonry
Land Information
- Land Use: Residential
- Land Use Subtype: Single Family Residential
Lot Information
- Parcel ID: 1420117007
- Lot Size: 0 sqft
Property Information
- Property Type: Single Family Residence
- Style: Greystone
- Year Built: 1903
Tax Information
- Annual Tax: $37,241
Utilities
- Heating: Natural Gas, Forced Air, Zoned
- Cooling: Central Air, Zoned
Location
- County: Cook
Listing Details
Investment Summary
- Monthly Cash Flow
- -$9,050
- Cap Rate
- 1.7%
- Cash-on-Cash Return
- -17.5%
- Debt Coverage Ratio
- 0.29
- Internal Rate of Return (5 years)
- -12.9%
Cash Flow
Net Operating Income (NOI) minus mortgage payments.
Calculation:
NOI - Mortgage Payments
Cap Rate (Market Value)
Capitalization Rate is a rate of return that compares the yearly Net Operating Income (NOI) to the market value.
Calculation:
NOI / Market Value
Cash-on-Cash Return (CoC)
Annual Cash Flow / Cash Invested
Calculation:
Annual cash flow divided by initial cash invested.
Debt Coverage Ratio (DCR)
Net Operating Income (NOI) divided by total debt payments.
Calculation:
NOI / Total Debt Payments
Internal Rate of Return (IRR)
A metric for assessing profitability over time. IRR is the discount rate at which the net present value (NPV) of all future cash flows (positive and negative) from an investment equals zero — including both periodic cash flow (such as rent) and a projected sale at the end of the holding period. It represents the expected annualized return, accounting for income, expenses, and the recovery of capital through a future sale.
Purchase Details
Purchase PriceThe price paid for the property. Purchase price:
| $2,700,000 |
|---|---|
Amount FinancedThe amount of the purchase financed through a loan. Amount financed:
| -$2,160,000 |
Down paymentThe initial payment made towards the purchase. Down payment:
| $540,000 |
Closing CostsFees and expenses associated with purchasing a property, typically ranging from 2% to 5% of the home’s purchase price, paid at the end of a home purchase to cover services like lending, title transfer, and taxes. Closing costs:
| $81,000 |
Rehab CostsCosts incurred to repair or improve the property, including: roof, flooring, exterior siding, kitchen, exterior paint, bathrooms, etc. Rehab costs:
| $0 |
Initial Cash InvestedThe total initial cash invested in the property. Calculation:Down payment + Buying costs + Rehab costs Initial cash invested:
| $621,000 |
Square Feet (SQFT)The total square footage of the property. Square feet:
| 5,100 |
Cost Per Square FootCost per square foot of the property. Calculation:Purchase Price / Square Feet Cost per square foot:
| $529 |
Monthly Rent Per Square FootMonthly rent divided by the number of square feet. This ratio helps investors compare rental income efficiency across properties, markets, and unit sizes Calculation:Monthly Rent / Square Feet Monthly rent per square foot:
| $1.94 |
Financing Details
Loan AmountThe total sum of money borrowed from a lender to finance a property purchase. Calculation:Purchase Price - Down Payment
Loan amount:
| $2,160,000 |
|---|---|
Loan to Value Ratio (LTV)Loan amount divided by the market value of the property. Calculation:Loan Amount / Market Value
Loan to value ratio:
| 80.0% |
Loan TypeThe type of loan (e.g., fixed, adjustable).
Loan type:
| Amortizing |
TermThe loan repayment period in years.
Term:
| 30 years |
Interest RateThe percentage a lender charges on the borrowed amount of a loan, determining the cost of borrowing money.
Interest rate:
| 5.875% |
Principal & Interest (PI)The principal is the portion of the loan payment that reduces the loan balance. The interest is the lender's charge for borrowing money. Calculation:(P * r * (1 + r) ** n) / ((1 + r) ** n - 1) Where:
P = Loan amount (principal)
Principal & interest:
| $12,777 |
Property TaxesAnnual taxes levied by local governments on real estate properties. These taxes fund public services like schools, roads, and emergency services.
Property tax:
| $3,104 |
InsuranceThe costs for insurance coverage to protect against financial losses due to risks like fire, natural disasters, theft, liability, or tenant-related damages. Calculation:Assumes 7% of gross rental income, unless insurance rates are specified.
Insurance:
| $693 |
Private Mortgage Insurance (PMI)A fee that borrowers pay when they take out a conventional loan with a loan-to-value (LTV) ratio above 80%.
Private mortgage insurance (PMI):
| $0 |
Monthly PaymentThe fixed amount a borrower pays each month to repay a loan. It typically includes principal and interest (P&I) and may also cover property taxes, insurance, HOA fees, and PMI if escrowed. Monthly payment:
| $16,574 |
Operating Income
| % Rent | Monthly | Yearly | |
|---|---|---|---|
Gross RentThe total rental income received from tenants before deducting any expenses. Includes base rent, late fees, pet fees, parking fees, and other recurring charges.
Gross rent:
| $9,900 | $118,800 | |
Vacancy LossExpected loss of rent due to vacancies.
Vacancy loss:
(6%)
| 6% | -$594 | -$7,128 |
Operating IncomeGross rental income minus vacancy loss. Calculation:Gross rent - Vacancy loss
Operating income:
| $9,306 | $111,672 |
Operating Expenses
| % Rent | Monthly | Yearly | |
|---|---|---|---|
Property TaxesAnnual taxes levied by local governments on real estate properties. These taxes fund public services like schools, roads, and emergency services. | 31% | -$3,104 | -$37,242 |
InsuranceThe costs for insurance coverage to protect against financial losses due to risks like fire, natural disasters, theft, liability, or tenant-related damages. Calculation:Assumes 7% of gross rental income, unless insurance rates are specified. | 7% | -$693 | -$8,316 |
Property ManagementThe costs associated with hiring a property manager to handle the day-to-day operations of a rental property. Includes management fees, leasing fes, eviction fees, etc. Calculation:Assumes 8% of gross rental income. | 8% | -$792 | -$9,504 |
Repairs & MaintenanceOngoing costs for routine upkeep and minor fixes needed to keep a property in good working condition. Calculation:Assumes 5% of gross rental income. Varies by property age and condition. | 5% | -$495 | -$5,940 |
Capital ExpensesLarge, infrequent costs for major improvements or replacements, like a new roof, HVAC system, or appliances. Calculation:Assumes 5% of gross rental income. Varies by property age. | 5% | -$495 | -$5,940 |
HOA FeesRegular dues paid to a Homeowners Association for community maintenance, amenities, and management. Similar fees include: Condo Association Fees, Co-op Maintenance Fees, etc. | n/a | n/a | n/a |
Operating ExpensesRecurring costs required to maintain and manage a rental property, including property taxes, insurance, maintenance, repairs, utilities (if paid by the owner), property management fees, and other day-to-day expenses. Calculation:Insurance + Property Taxes + Property Management + Repairs & Maintenance + Capital Expenditures + HOA Fees | 56% | -$5,579 | -$66,942 |
Cash Flow
| Monthly | Yearly | |
|---|---|---|
Net Operating Income (NOI)The income generated from a property after deducting all operating expenses but before deducting mortgage payments, taxes, and capital expenditures. Calculation:Gross Operating Income - Operating Expenses
Net operating income:
| $3,727 | $44,724 |
Mortgage PaymentThe fixed amount a borrower pays each month to repay a loan. It typically includes principal and interest (P&I) and may also cover property taxes, insurance, HOA fees, and PMI if escrowed. | -$12,777 | -$153,324 |
Cash FlowNet Operating Income (NOI) minus mortgage payments. Calculation:NOI - Mortgage Payments | $9,050 | $108,600 |