60613 Investment Properties for Sale
Browse homes for sale and investment properties in 60613. Refine your search by price, property type, or more.
Best cash flowing properties in 60613
Active
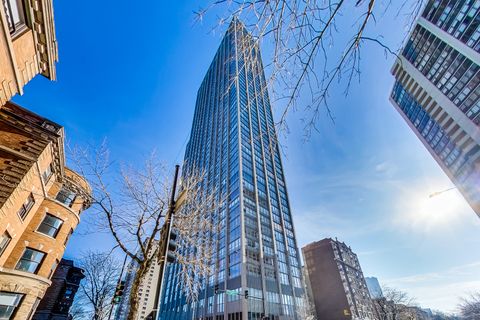
$157,500
1
bds
|
1
ba
|
0
sqft
|
built
1958
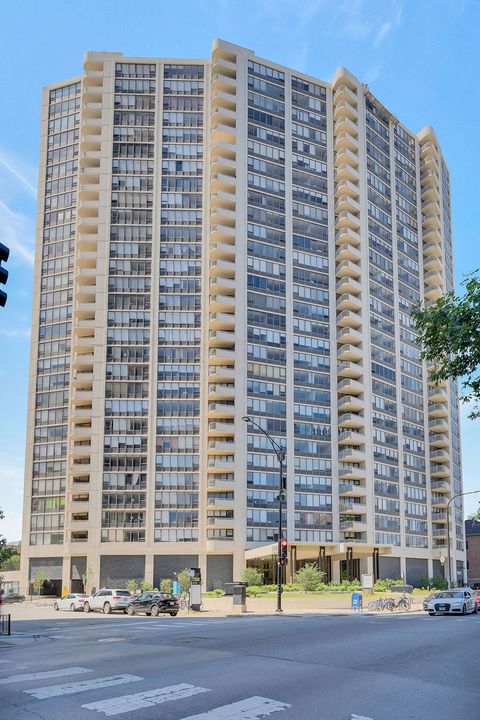
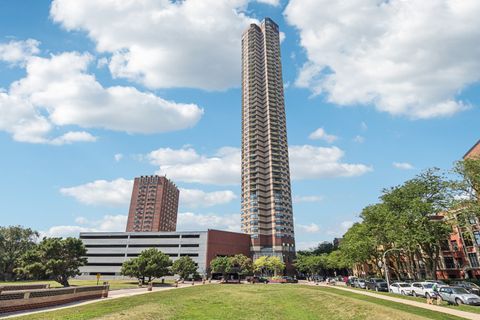
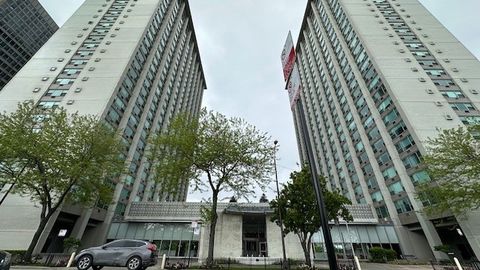
3900 N Lake Shore Dr, Chicago, IL 60613
$-3
Cash flow
-0.1%
Cash-on-Cash Return
5.7%
Cap rate
1.7%
Rent to Value Ratio
Active
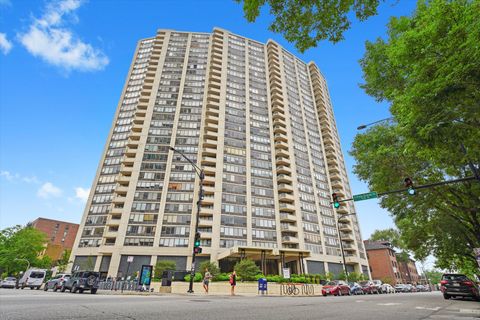
$179,900
2
bds
|
1
ba
|
850
sqft
|
built
1955
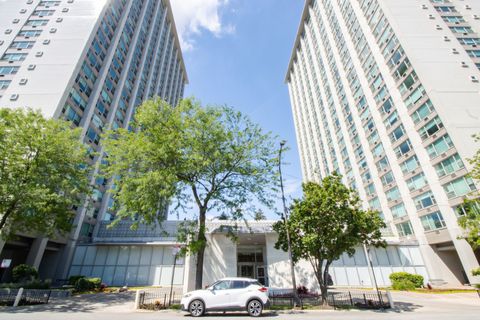
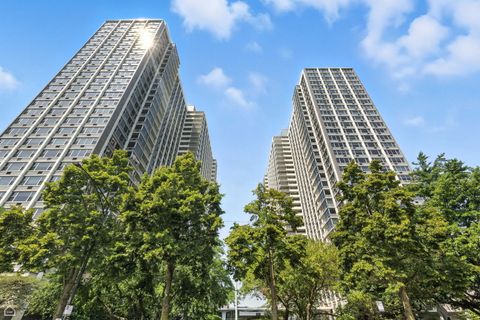
3950 N Lake Shore Dr, Chicago, IL 60613
$-63
Cash flow
-1.8%
Cash-on-Cash Return
5.3%
Cap rate
1.4%
Rent to Value Ratio
44 out of 52 properties for sale in 60613
Limited Results Shown
Create a free account, or log in to reveal all property listings and enjoy the complete experience.

Active
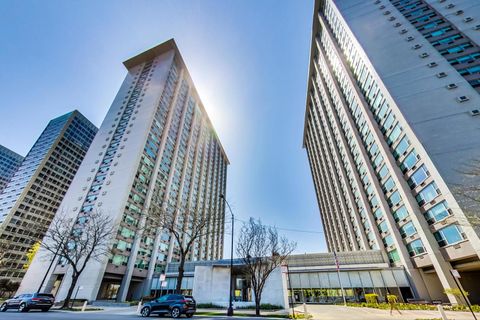
$165,000
1
bds
|
2
ba
|
920
sqft
|
built
1960
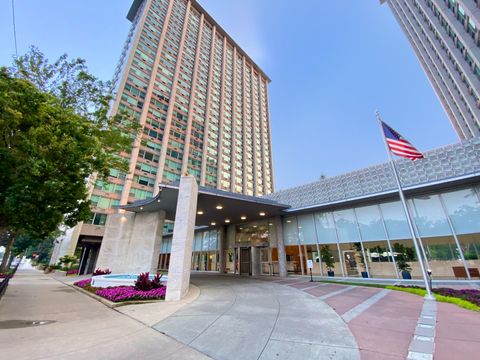
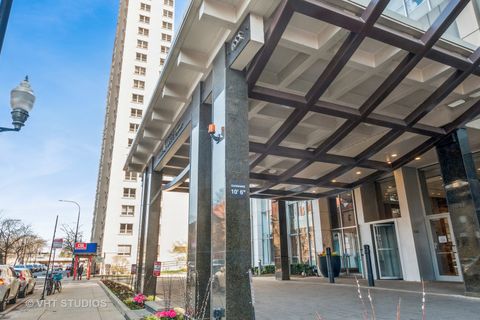
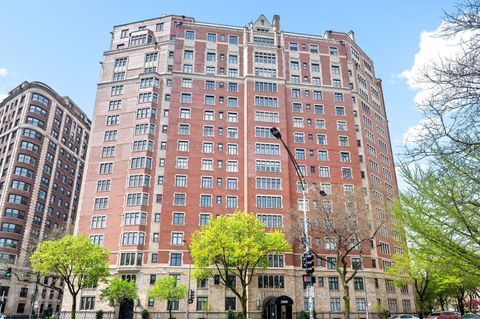
3600 N Lake Shore Dr, Chicago, IL 60613
$-122
Cash flow
-3.9%
Cash-on-Cash Return
4.8%
Cap rate
1.5%
Rent to Value Ratio
Active
$1,150,000
4
bds
|
3
ba
|
0
sqft
|
built
2001
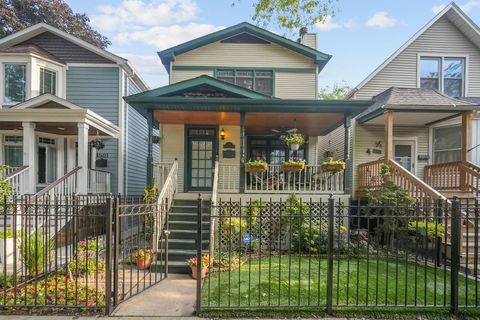
3814 N Greenview Ave, Chicago, IL 60613
$-2,326
Cash flow
-10.6%
Cash-on-Cash Return
3.3%
Cap rate
0.6%
Rent to Value Ratio
Active
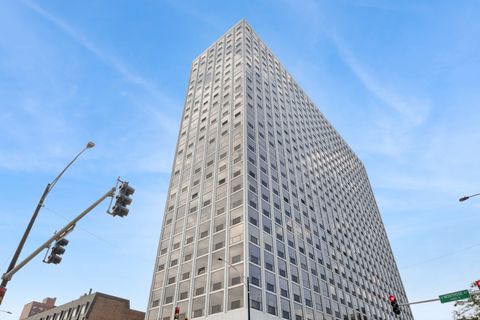
$215,000
1
bds
|
1
ba
|
750
sqft
|
built
1968
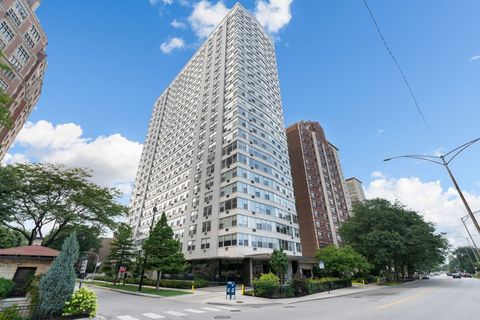
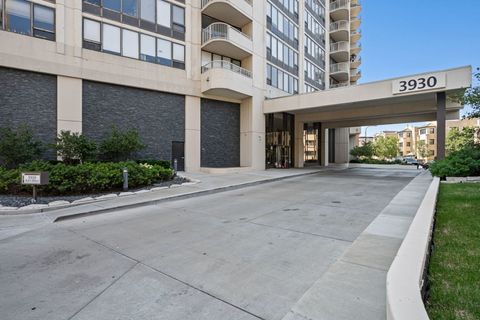
3930 N Pine Grove Ave, Chicago, IL 60613
$-664
Cash flow
-16.1%
Cash-on-Cash Return
2.0%
Cap rate
0.9%
Rent to Value Ratio
Active
$449,000
3
bds
|
2
ba
|
1,500
sqft
|
built
1901
817 W Cuyler Ave, Chicago, IL 60613
$-852
Cash flow
-9.9%
Cash-on-Cash Return
3.4%
Cap rate
0.8%
Rent to Value Ratio
Active
$1,100,000
4
bds
|
3
ba
|
2,416
sqft
|
built
2014
3743 N Kenmore Ave, Chicago, IL 60613
$-2,728
Cash flow
-12.9%
Cash-on-Cash Return
2.7%
Cap rate
0.5%
Rent to Value Ratio
Active
$449,000
3
bds
|
2
ba
|
0
sqft
|
built
2008
4150 N Kenmore Ave, Chicago, IL 60613
$-750
Cash flow
-8.7%
Cash-on-Cash Return
3.7%
Cap rate
0.8%
Rent to Value Ratio

Active
$259,000
1
bds
|
1
ba
|
0
sqft
|
built
1987
3660 N Lake Shore Dr, Chicago, IL 60613
$-600
Cash flow
-12.1%
Cash-on-Cash Return
2.9%
Cap rate
0.8%
Rent to Value Ratio
Active
$299,900
1
bds
|
1
ba
|
750
sqft
|
built
1987
3660 N Lake Shore Dr, Chicago, IL 60613
$-827
Cash flow
-14.4%
Cash-on-Cash Return
2.4%
Cap rate
0.7%
Rent to Value Ratio
Active
$2,990,000
6
bds
|
7
ba
|
6,350
sqft
|
built
2007
3628 N Lakewood Ave, Chicago, IL 60613
$-10,922
Cash flow
-19.1%
Cash-on-Cash Return
1.3%
Cap rate
0.3%
Rent to Value Ratio
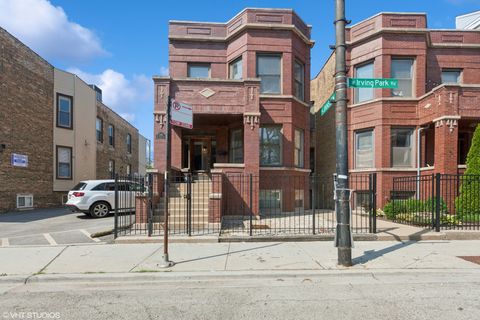
Active
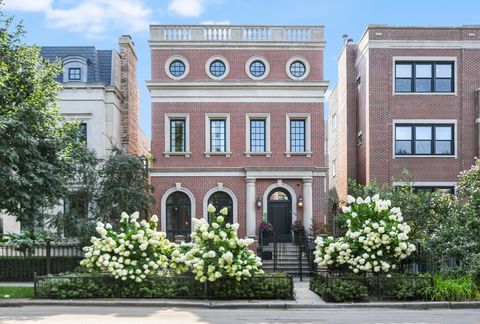
$1,500,000
9
bds
|
4
ba
|
0
sqft
|
built
1910
1442 W Irving Park Rd, Chicago, IL 60613
$-5,444
Cash flow
-18.9%
Cash-on-Cash Return
1.3%
Cap rate
0.3%
Rent to Value Ratio
Active
$1,350,000
7
bds
|
4
ba
|
0
sqft
|
built
1901
1510 W Montrose Ave, Chicago, IL 60613
$-5,494
Cash flow
-21.2%
Cash-on-Cash Return
0.8%
Cap rate
0.2%
Rent to Value Ratio
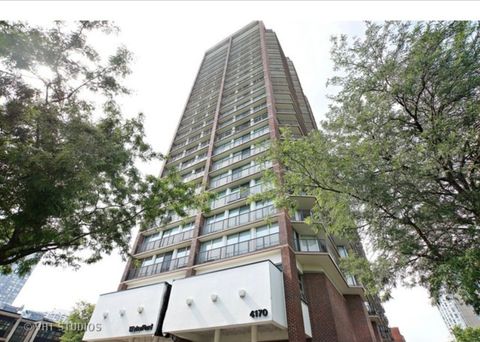
Active
$259,000
1
bds
|
1
ba
|
957
sqft
|
built
1974
4170 N Marine Dr, Chicago, IL 60613
$-698
Cash flow
-14.1%
Cash-on-Cash Return
2.4%
Cap rate
0.9%
Rent to Value Ratio
Active
$225,000
1
bds
|
1
ba
|
750
sqft
|
built
1971
3930 N Pine Grove Ave, Chicago, IL 60613
$-562
Cash flow
-13.0%
Cash-on-Cash Return
2.7%
Cap rate
0.9%
Rent to Value Ratio
Active
$224,900
1
bds
|
1
ba
|
800
sqft
|
built
1960
3600 N Lake Shore Dr, Chicago, IL 60613
$-481
Cash flow
-11.2%
Cash-on-Cash Return
3.1%
Cap rate
1.0%
Rent to Value Ratio
Active
$189,900
1
bds
|
1
ba
|
800
sqft
|
built
1957
3600 N Lake Shore Dr, Chicago, IL 60613
$-306
Cash flow
-8.4%
Cash-on-Cash Return
3.7%
Cap rate
1.2%
Rent to Value Ratio
Active
$215,000
1
bds
|
1
ba
|
800
sqft
|
built
1973
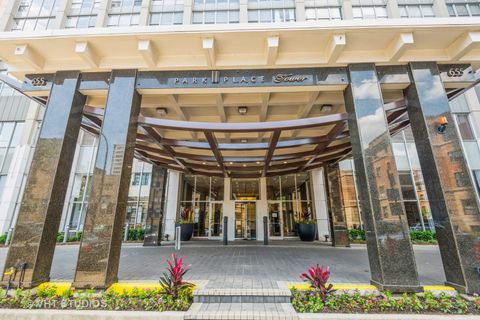
655 W Irving Park Rd, Chicago, IL 60613
$-621
Cash flow
-15.1%
Cash-on-Cash Return
2.2%
Cap rate
1.2%
Rent to Value Ratio
Active
$350,000
1
bds
|
1
ba
|
850
sqft
|
built
1987
3660 N Lake Shore Dr, Chicago, IL 60613
$-590
Cash flow
-8.8%
Cash-on-Cash Return
3.7%
Cap rate
0.9%
Rent to Value Ratio
Active
$174,900
1
bds
|
1
ba
|
645
sqft
|
built
1961
4250 N Marine Dr, Chicago, IL 60613
$-349
Cash flow
-10.4%
Cash-on-Cash Return
3.3%
Cap rate
0.9%
Rent to Value Ratio
Active
$510,000
3
bds
|
2
ba
|
2,150
sqft
|
built
1927
3800 N Lake Shore Dr, Chicago, IL 60613
$-1,957
Cash flow
-20.0%
Cash-on-Cash Return
1.1%
Cap rate
0.9%
Rent to Value Ratio
Active
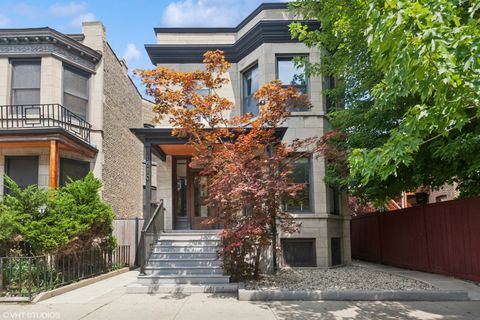
$1,550,000
4
bds
|
4
ba
|
3,600
sqft
|
built
2000
1746 W Byron St, Chicago, IL 60613
$-4,676
Cash flow
-15.7%
Cash-on-Cash Return
2.1%
Cap rate
0.4%
Rent to Value Ratio
Active
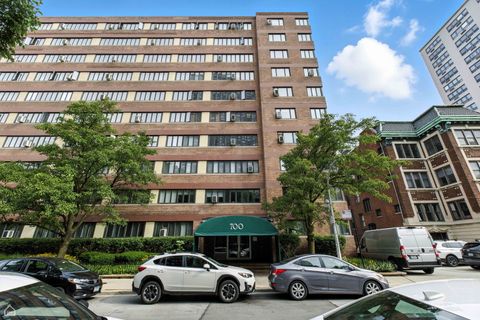
$160,000
1
bds
|
1
ba
|
0
sqft
|
built
1951
700 W Bittersweet Pl, Chicago, IL 60613
$-307
Cash flow
-10.0%
Cash-on-Cash Return
3.4%
Cap rate
1.0%
Rent to Value Ratio
Active
$1,179,000
3
bds
|
3
ba
|
2,017
sqft
|
built
1901
3838 N Alta Vista Ter, Chicago, IL 60613
$-3,325
Cash flow
-14.7%
Cash-on-Cash Return
2.3%
Cap rate
0.4%
Rent to Value Ratio
Active
$149,000
1
bds
|
1
ba
|
525
sqft
|
built
1974
4343 N Clarendon Ave, Chicago, IL 60613
$-679
Cash flow
-23.8%
Cash-on-Cash Return
0.2%
Cap rate
1.2%
Rent to Value Ratio
Active
$300,000
2
bds
|
2
ba
|
1,000
sqft
|
built
1973
4343 N Clarendon Ave, Chicago, IL 60613
$-1,028
Cash flow
-17.9%
Cash-on-Cash Return
1.6%
Cap rate
0.9%
Rent to Value Ratio

Active
$255,000
3
bds
|
2
ba
|
1,350
sqft
|
built
1953
3950 N Lake Shore Dr, Chicago, IL 60613
$-487
Cash flow
-10.0%
Cash-on-Cash Return
3.4%
Cap rate
1.2%
Rent to Value Ratio
Active
$235,000
1
bds
|
1
ba
|
832
sqft
|
built
1973
655 W Irving Park Rd, Chicago, IL 60613
$-1,047
Cash flow
-23.2%
Cash-on-Cash Return
0.3%
Cap rate
1.0%
Rent to Value Ratio
Active
$214,900
1
bds
|
1
ba
|
750
sqft
|
built
1968
3930 N Pine Grove Ave, Chicago, IL 60613
$-413
Cash flow
-10.0%
Cash-on-Cash Return
3.4%
Cap rate
1.1%
Rent to Value Ratio
Active
$173,000
0
bds
|
1
ba
|
0
sqft
|
built
1960
3600 N Lake Shore Dr, Chicago, IL 60613
$-357
Cash flow
-10.8%
Cash-on-Cash Return
3.2%
Cap rate
0.9%
Rent to Value Ratio

Active
$149,000
0
bds
|
1
ba
|
525
sqft
|
built
1970
4343 N Clarendon Ave, Chicago, IL 60613
$-298
Cash flow
-10.4%
Cash-on-Cash Return
3.3%
Cap rate
1.1%
Rent to Value Ratio

Active
$167,000
bds
|
1
ba
|
600
sqft
|
built
1960
3600 N Lake Shore Dr, Chicago, IL 60613
$-187
Cash flow
-5.8%
Cash-on-Cash Return
4.3%
Cap rate
1.1%
Rent to Value Ratio
Active
$169,900
1
bds
|
1
ba
|
800
sqft
|
built
1974
4343 N Clarendon Ave, Chicago, IL 60613
$-489
Cash flow
-15.0%
Cash-on-Cash Return
2.2%
Cap rate
1.2%
Rent to Value Ratio
Active
$430,000
4
bds
|
3
ba
|
2,400
sqft
|
built
1904
668 W Irving Park Rd, Chicago, IL 60613
$-2,231
Cash flow
-27.1%
Cash-on-Cash Return
-0.5%
Cap rate
0.7%
Rent to Value Ratio
Active
$179,000
bds
|
1
ba
|
550
sqft
|
built
1960
3600 N Lake Shore Dr, Chicago, IL 60613
$-282
Cash flow
-8.2%
Cash-on-Cash Return
3.8%
Cap rate
1.0%
Rent to Value Ratio
Active
$215,500
1
bds
|
1
ba
|
900
sqft
|
built
1962
4250 N Marine Dr, Chicago, IL 60613
$-630
Cash flow
-15.3%
Cash-on-Cash Return
2.2%
Cap rate
0.9%
Rent to Value Ratio
Active
$205,000
1
bds
|
1
ba
|
757
sqft
|
built
1973
655 W Irving Park Rd, Chicago, IL 60613
$-557
Cash flow
-14.2%
Cash-on-Cash Return
2.4%
Cap rate
1.1%
Rent to Value Ratio
Active
$205,000
1
bds
|
1
ba
|
750
sqft
|
built
1973
655 W Irving Park Rd, Chicago, IL 60613
$-695
Cash flow
-17.7%
Cash-on-Cash Return
1.6%
Cap rate
1.0%
Rent to Value Ratio
Active
$220,000
1
bds
|
1
ba
|
790
sqft
|
built
1960
3600 N Lake Shore Dr, Chicago, IL 60613
$-630
Cash flow
-14.9%
Cash-on-Cash Return
2.2%
Cap rate
0.9%
Rent to Value Ratio

Active
$1,475,000
7
bds
|
4
ba
|
0
sqft
|
built
1893
3809 N Kenmore Ave, Chicago, IL 60613
$-5,713
Cash flow
-20.2%
Cash-on-Cash Return
1.0%
Cap rate
0.3%
Rent to Value Ratio