38108 Investment Properties for Sale
Browse homes for sale and investment properties in 38108. Refine your search by price, property type, or more.
Best cash flowing properties in 38108
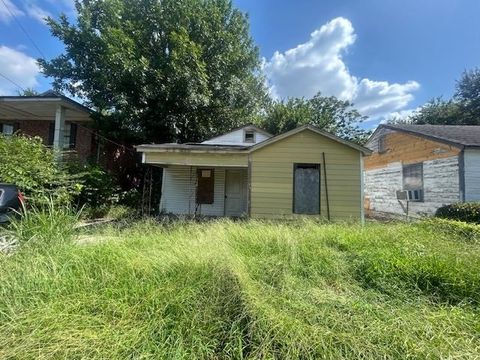
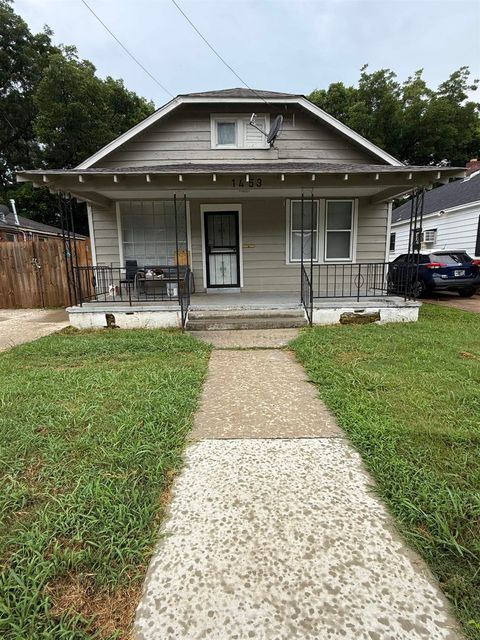
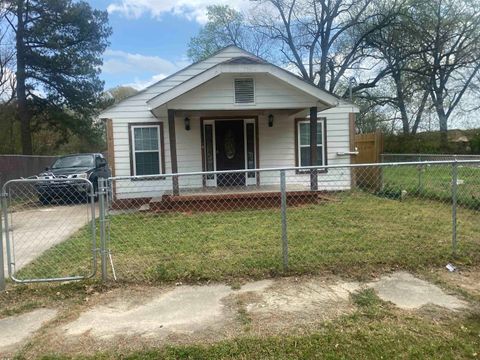
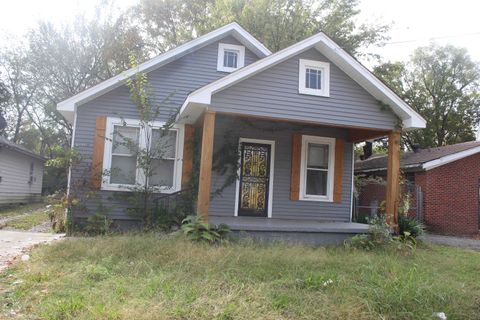
Active
$42,000
2
bds
|
1
ba
|
0
sqft
|
built
1950
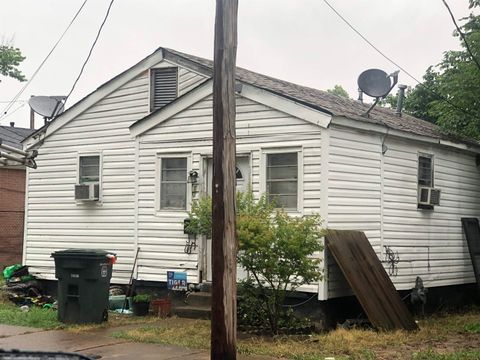
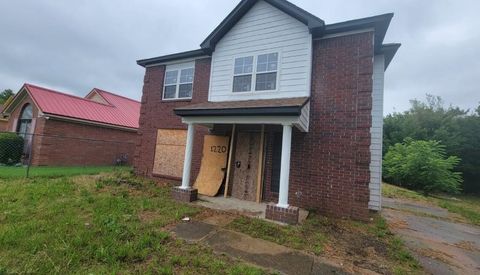
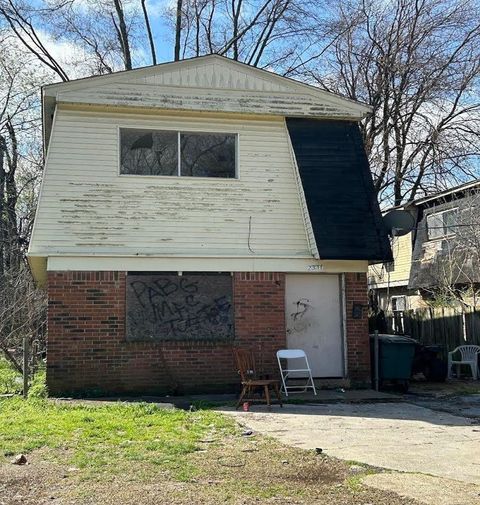
1050 Dawes Ave, Memphis, TN 38108
$733
Cash flow
20.3%
Cash-on-Cash Return
20.9%
Cap rate
2.6%
Rent to Value Ratio
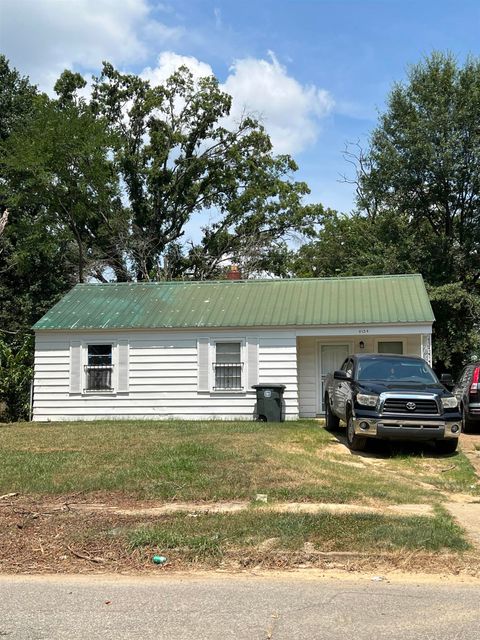
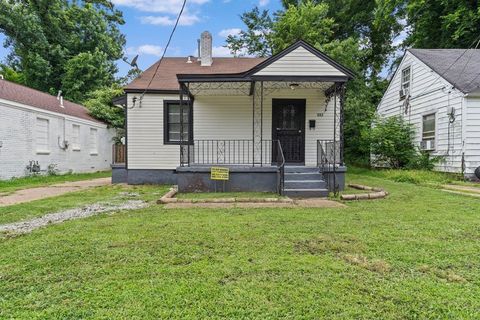
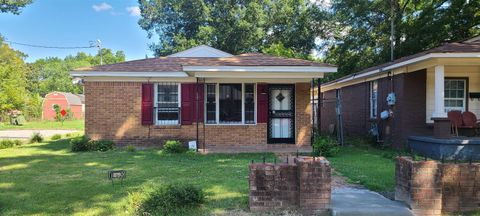
Active
$74,500
3
bds
|
2
ba
|
0
sqft
|
built
1951
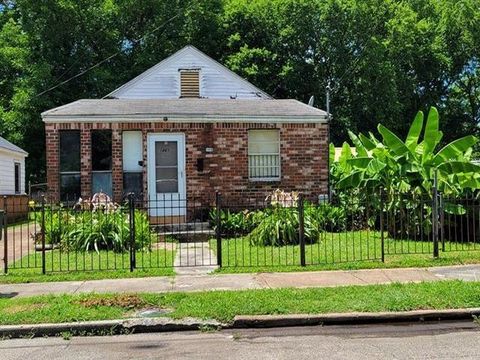
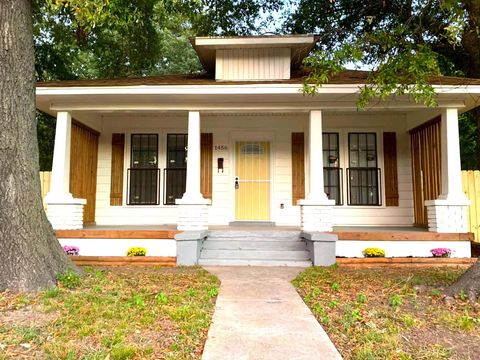
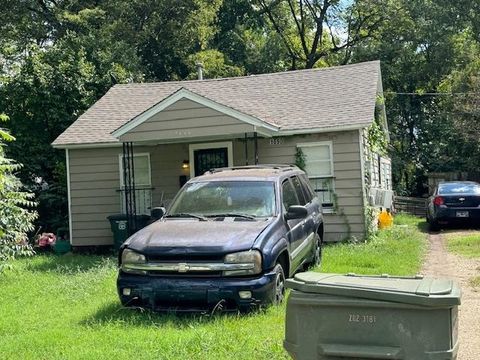
1461 N Merton St, Memphis, TN 38108
$718
Cash flow
11.2%
Cash-on-Cash Return
11.6%
Cap rate
1.5%
Rent to Value Ratio
33 out of 34 properties for sale in 38108
Limited Results Shown
Create a free account, or log in to reveal all property listings and enjoy the complete experience.
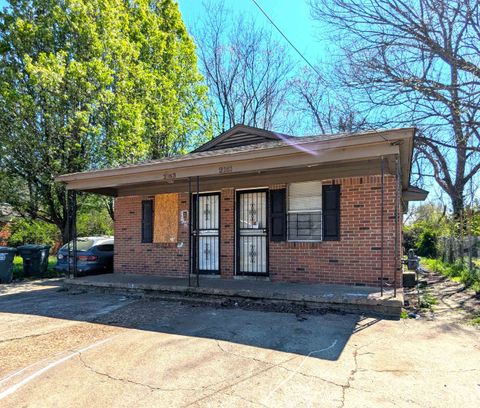
Active
$127,900
3
bds
|
1
ba
|
0
sqft
|
built
1954
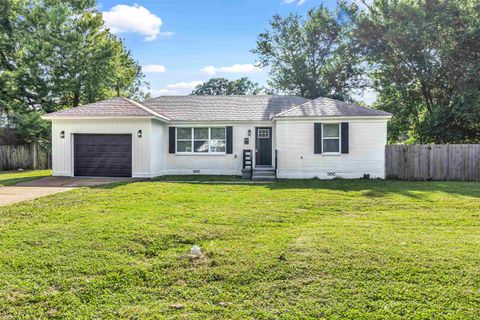
1773 Greenview Cir, Memphis, TN 38108
$358
Cash flow
14.6%
Cash-on-Cash Return
9.0%
Cap rate
1.2%
Rent to Value Ratio
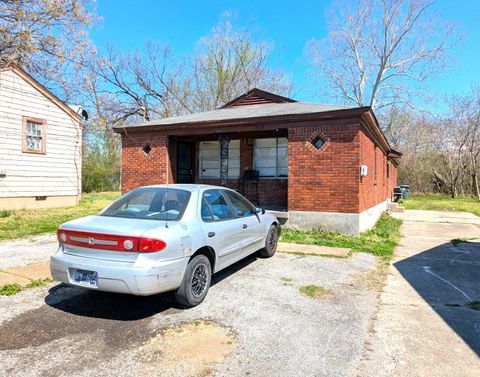
Active
$175,000
3
bds
|
1
ba
|
0
sqft
|
built
1972
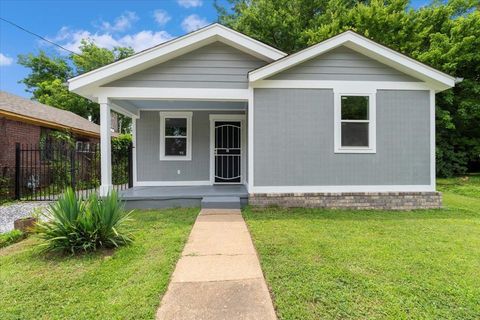
4285 Fairmont Ave, Memphis, TN 38108
$48
Cash flow
1.4%
Cash-on-Cash Return
6.0%
Cap rate
0.8%
Rent to Value Ratio
Active
$44,900
2
bds
|
1.5
ba
|
0
sqft
|
built
1941
2151 Lyon Ave, Memphis, TN 38108
$529
Cash flow
13.7%
Cash-on-Cash Return
14.1%
Cap rate
1.8%
Rent to Value Ratio
Active
$130,000
3
bds
|
1
ba
|
0
sqft
|
built
1951
4134 Leroy Ave, Memphis, TN 38108
$81
Cash flow
3.3%
Cash-on-Cash Return
6.4%
Cap rate
0.8%
Rent to Value Ratio
Active
$145,000
2
bds
|
2
ba
|
0
sqft
|
built
1958
2982 Shannon Ave, Memphis, TN 38108
$-306
Cash flow
-11.0%
Cash-on-Cash Return
3.1%
Cap rate
0.4%
Rent to Value Ratio
Active
$44,900
2
bds
|
1
ba
|
0
sqft
|
built
1910
2189 Brown Ave, Memphis, TN 38108
$585
Cash flow
15.2%
Cash-on-Cash Return
15.6%
Cap rate
2.0%
Rent to Value Ratio
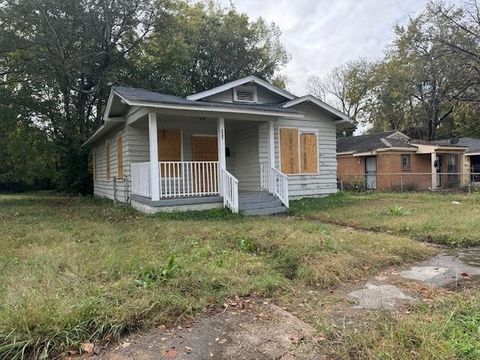
Active
$7,900
2
bds
|
1
ba
|
0
sqft
|
built
1959
2337 Staten Ave, Memphis, TN 38108
$666
Cash flow
98.2%
Cash-on-Cash Return
101.2%
Cap rate
12.7%
Rent to Value Ratio
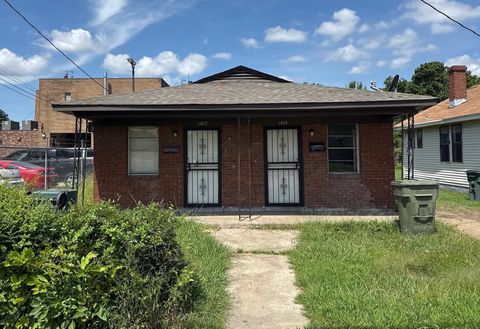
Active
$80,000
4
bds
|
2
ba
|
0
sqft
|
built
1953
1423 Boxwood St, Memphis, TN 38108
$190
Cash flow
12.4%
Cash-on-Cash Return
8.5%
Cap rate
1.1%
Rent to Value Ratio
Active
$155,000
3
bds
|
2
ba
|
0
sqft
|
built
1953
4113 Wilmette Ave, Memphis, TN 38108
$171
Cash flow
5.8%
Cash-on-Cash Return
7.0%
Cap rate
0.9%
Rent to Value Ratio
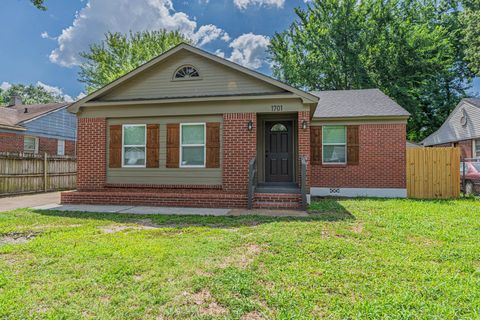
Active
$230,000
3
bds
|
2
ba
|
0
sqft
|
built
1954
1701 Ronda St, Memphis, TN 38108
$-91
Cash flow
-2.1%
Cash-on-Cash Return
5.2%
Cap rate
0.7%
Rent to Value Ratio
Active
$110,000
3
bds
|
1
ba
|
0
sqft
|
built
1924
1453 N Merton St, Memphis, TN 38108
$132
Cash flow
6.3%
Cash-on-Cash Return
7.1%
Cap rate
0.9%
Rent to Value Ratio
Active
$33,900
2
bds
|
1
ba
|
0
sqft
|
built
1936
2139 Lyon Ave, Memphis, TN 38108
$594
Cash flow
20.4%
Cash-on-Cash Return
21.0%
Cap rate
2.7%
Rent to Value Ratio
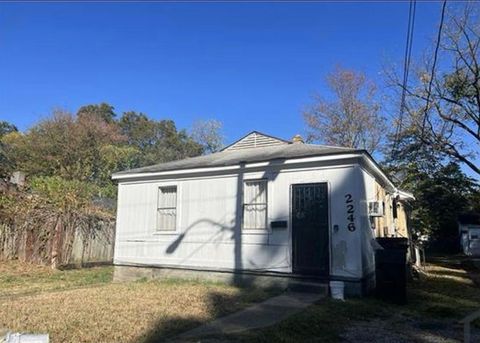
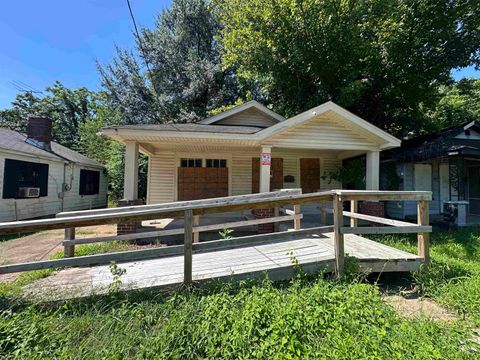
Active
$97,000
4
bds
|
2
ba
|
0
sqft
|
built
1956
2246 Griggs Ave, Memphis, TN 38108
$195
Cash flow
10.5%
Cash-on-Cash Return
8.1%
Cap rate
1.0%
Rent to Value Ratio
Active
$85,000
2
bds
|
1
ba
|
0
sqft
|
built
1950
882 N Bingham St, Memphis, TN 38108
$329
Cash flow
20.2%
Cash-on-Cash Return
10.3%
Cap rate
1.3%
Rent to Value Ratio
Active
$75,000
3
bds
|
2
ba
|
0
sqft
|
built
1997
1220 Park Castle Cv, Memphis, TN 38108
$666
Cash flow
46.3%
Cash-on-Cash Return
16.3%
Cap rate
2.1%
Rent to Value Ratio
Active
$125,000
2
bds
|
1
ba
|
0
sqft
|
built
1927
1456 N Hollywood St, Memphis, TN 38108
$348
Cash flow
14.5%
Cash-on-Cash Return
9.0%
Cap rate
1.1%
Rent to Value Ratio
Active
$208,000
3
bds
|
2
ba
|
0
sqft
|
built
1956
1735 Ronda St, Memphis, TN 38108
$-373
Cash flow
-9.4%
Cash-on-Cash Return
3.5%
Cap rate
0.5%
Rent to Value Ratio
Active
$129,000
3
bds
|
1
ba
|
0
sqft
|
built
1940
2427 Vandale Ave, Memphis, TN 38108
$54
Cash flow
2.2%
Cash-on-Cash Return
6.2%
Cap rate
0.8%
Rent to Value Ratio
Active
$42,000
4
bds
|
1
ba
|
0
sqft
|
built
1970
2331 Staten Ave, Memphis, TN 38108
$570
Cash flow
15.8%
Cash-on-Cash Return
16.3%
Cap rate
2.1%
Rent to Value Ratio
Active
$114,900
3
bds
|
1
ba
|
0
sqft
|
built
1947
1690 Berkshire Ave, Memphis, TN 38108
$183
Cash flow
8.3%
Cash-on-Cash Return
7.6%
Cap rate
1.0%
Rent to Value Ratio
Active
$155,000
3
bds
|
2
ba
|
0
sqft
|
built
1953
4227 Bayliss Ave, Memphis, TN 38108
$112
Cash flow
3.8%
Cash-on-Cash Return
6.5%
Cap rate
0.8%
Rent to Value Ratio
Active
$65,000
1
bds
|
1
ba
|
0
sqft
|
built
1948
2227 Clayton Ave, Memphis, TN 38108
$595
Cash flow
10.7%
Cash-on-Cash Return
11.0%
Cap rate
1.4%
Rent to Value Ratio
Active
$105,000
3
bds
|
2
ba
|
0
sqft
|
built
1930
1322 Standridge St, Memphis, TN 38108
$214
Cash flow
10.6%
Cash-on-Cash Return
8.1%
Cap rate
1.0%
Rent to Value Ratio
Active
$99,700
3
bds
|
1
ba
|
0
sqft
|
built
1961
1450 Lambert St, Memphis, TN 38108
$251
Cash flow
13.1%
Cash-on-Cash Return
8.7%
Cap rate
1.1%
Rent to Value Ratio
Active
$67,500
2
bds
|
2
ba
|
0
sqft
|
built
1946
2161 Howell Ave, Memphis, TN 38108
$501
Cash flow
8.6%
Cash-on-Cash Return
8.9%
Cap rate
1.2%
Rent to Value Ratio
Active
$89,900
4
bds
|
2
ba
|
0
sqft
|
built
1964
1510 N Merton St, Memphis, TN 38108
$141
Cash flow
8.2%
Cash-on-Cash Return
7.6%
Cap rate
1.0%
Rent to Value Ratio
Active
$50,000
2
bds
|
1
ba
|
0
sqft
|
built
1930
2387 Norman Ave, Memphis, TN 38108
$583
Cash flow
13.6%
Cash-on-Cash Return
14.0%
Cap rate
1.8%
Rent to Value Ratio

Active
$114,000
3
bds
|
2
ba
|
0
sqft
|
built
1913
1545 Oakwood St, Memphis, TN 38108
$45
Cash flow
2.1%
Cash-on-Cash Return
6.1%
Cap rate
0.8%
Rent to Value Ratio

Active
$50,000
3
bds
|
0
ba
|
0
sqft
|
built
1964
1489 Boxwood St, Memphis, TN 38108
$716
Cash flow
16.7%
Cash-on-Cash Return
17.2%
Cap rate
2.2%
Rent to Value Ratio
Active
$65,000
3
bds
|
1
ba
|
0
sqft
|
built
1920
2347 Norman Ave, Memphis, TN 38108
$656
Cash flow
11.8%
Cash-on-Cash Return
12.1%
Cap rate
1.5%
Rent to Value Ratio
Active
$90,000
2
bds
|
1
ba
|
0
sqft
|
built
1929
1584 Carpenter St, Memphis, TN 38108
$233
Cash flow
13.5%
Cash-on-Cash Return
8.8%
Cap rate
1.1%
Rent to Value Ratio