39042 Investment Properties for Sale
Browse homes for sale and investment properties in 39042. Refine your search by price, property type, or more.
Best cash flowing properties in 39042
Active
$189,000
3
bds
|
3
ba
|
0
sqft
|
built
1976
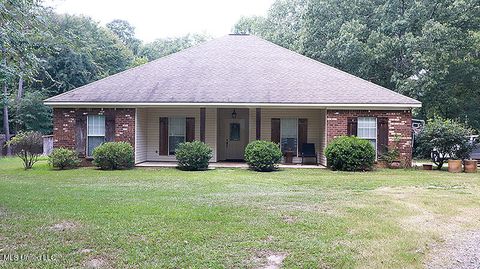
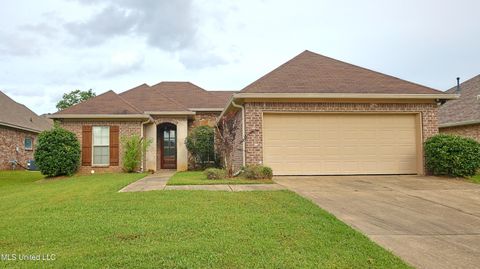
108 Fairdale Pl, Brandon, MS 39042
$456
Cash flow
12.6%
Cash-on-Cash Return
8.6%
Cap rate
1.1%
Rent to Value Ratio
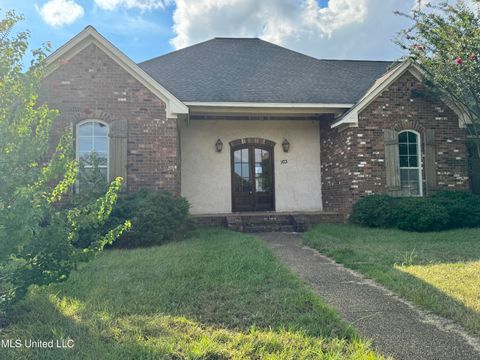
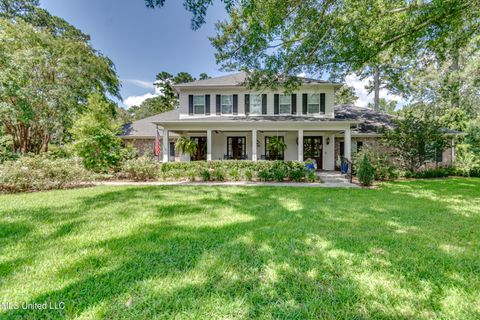
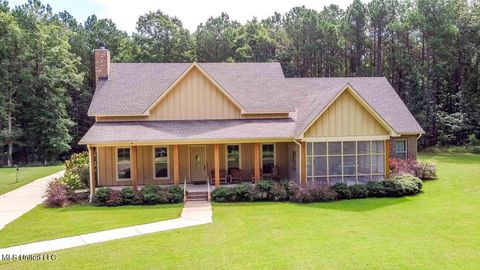
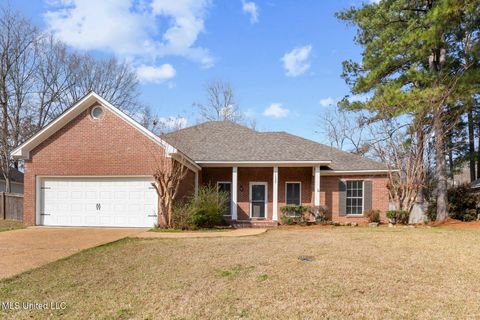
Active
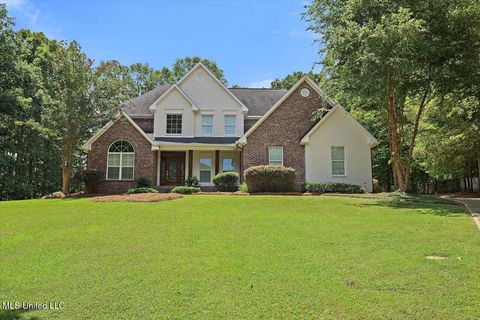
$379,000
5
bds
|
5
ba
|
0
sqft
|
built
2005
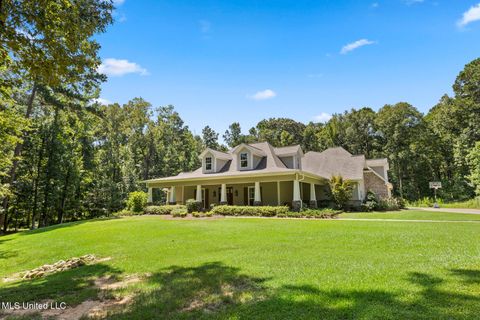
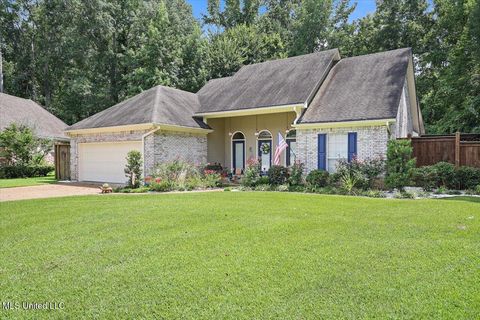
103 Rosemont Dr, Brandon, MS 39042
$354
Cash flow
4.9%
Cash-on-Cash Return
6.8%
Cap rate
0.9%
Rent to Value Ratio
62 out of 63 properties for sale in 39042
Limited Results Shown
Create a free account, or log in to reveal all property listings and enjoy the complete experience.
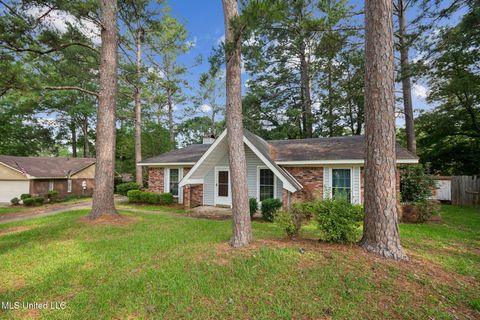
Active
$225,000
3
bds
|
2
ba
|
0
sqft
|
built
1972
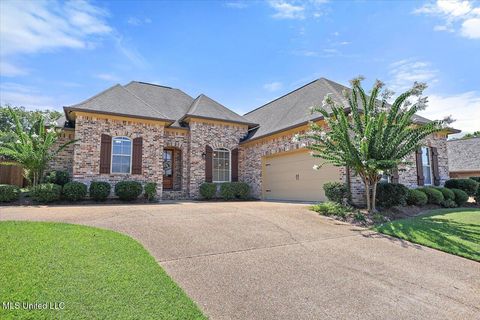
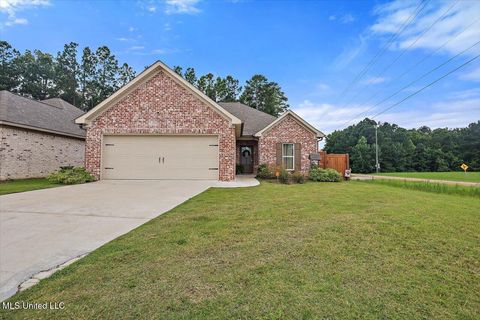
426 Lakebend Pl, Brandon, MS 39042
$81
Cash flow
1.9%
Cash-on-Cash Return
6.1%
Cap rate
0.8%
Rent to Value Ratio
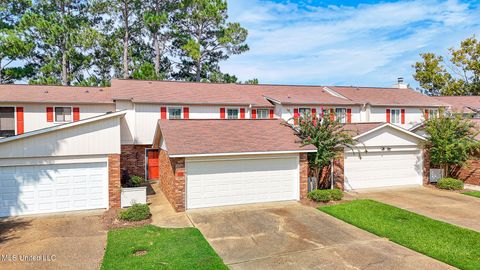
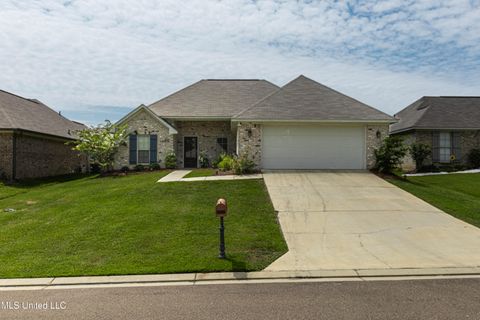
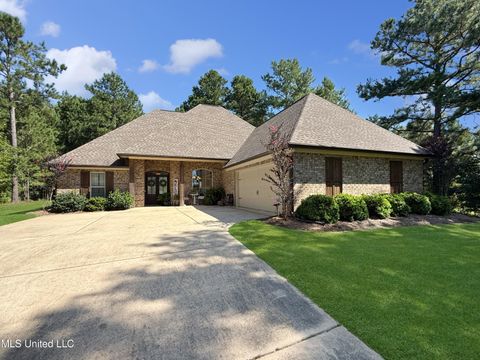
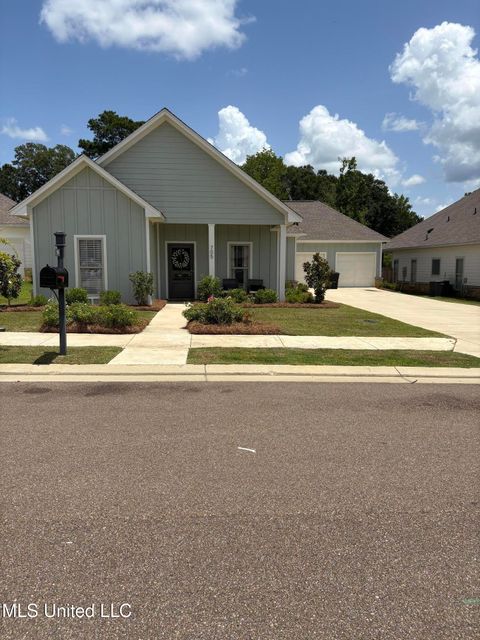
Active
$385,400
4
bds
|
3
ba
|
0
sqft
|
built
2014
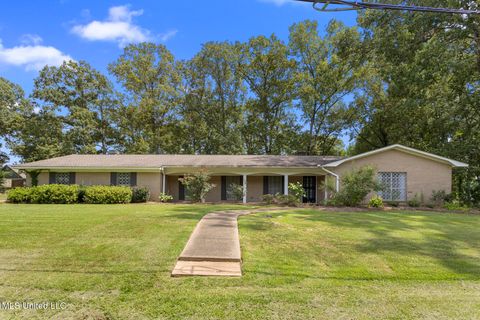
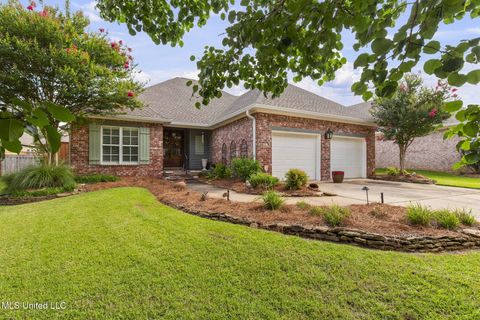
252 Penny Ln, Brandon, MS 39042
$-165
Cash flow
-2.2%
Cash-on-Cash Return
5.2%
Cap rate
0.7%
Rent to Value Ratio

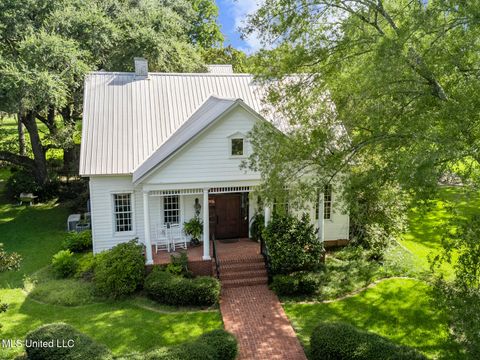
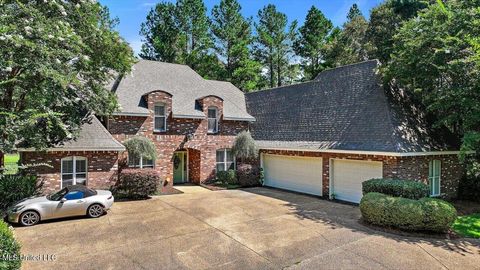
Active
$550,000
5
bds
|
5
ba
|
0
sqft
|
built
2002
716 Highway 468, Brandon, MS 39042
$-993
Cash flow
-9.4%
Cash-on-Cash Return
3.5%
Cap rate
0.5%
Rent to Value Ratio
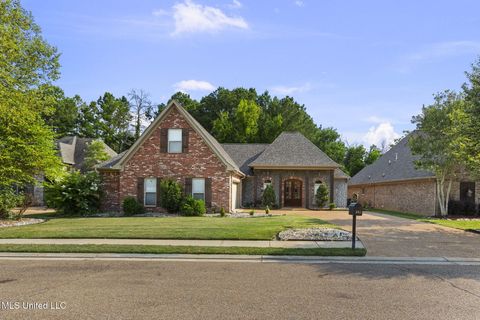
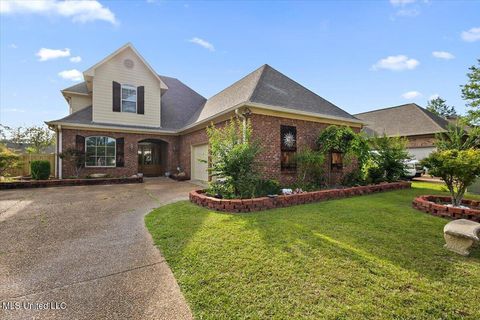
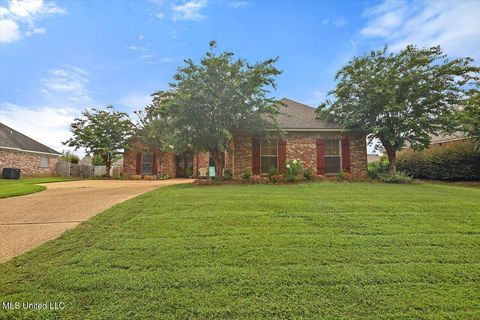
Active
$325,000
3
bds
|
2
ba
|
0
sqft
|
built
2006
138 Cody Ln, Brandon, MS 39042
$-51
Cash flow
-0.8%
Cash-on-Cash Return
5.5%
Cap rate
0.7%
Rent to Value Ratio
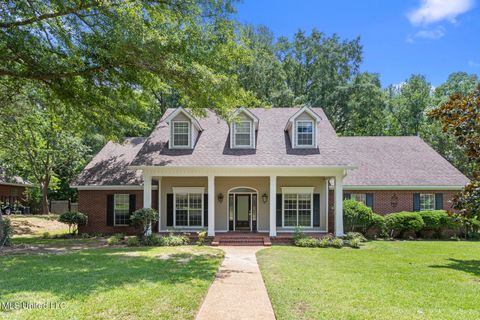
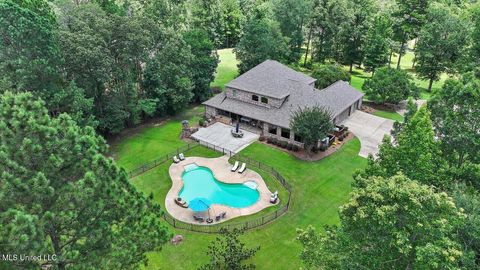
Active
$829,900
5
bds
|
5
ba
|
0
sqft
|
built
2018
5095 Warner Dr, Brandon, MS 39042
$-1,770
Cash flow
-11.1%
Cash-on-Cash Return
3.1%
Cap rate
0.5%
Rent to Value Ratio
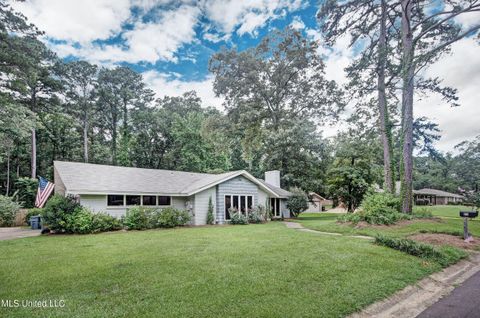
Active
$389,900
4
bds
|
3
ba
|
0
sqft
|
built
2014
146 Grandeur Dr, Brandon, MS 39042
$-223
Cash flow
-3.0%
Cash-on-Cash Return
5.0%
Cap rate
0.7%
Rent to Value Ratio
Active
$278,000
3
bds
|
3
ba
|
0
sqft
|
built
1972
11 Terrapin Hill Rd S, Brandon, MS 39042
$331
Cash flow
6.2%
Cash-on-Cash Return
7.1%
Cap rate
0.9%
Rent to Value Ratio
Active
$774,900
5
bds
|
4
ba
|
0
sqft
|
built
2005
1106 Pointe Cv, Brandon, MS 39042
$-1,237
Cash flow
-8.3%
Cash-on-Cash Return
3.8%
Cap rate
0.5%
Rent to Value Ratio
Active
$449,900
5
bds
|
4
ba
|
0
sqft
|
built
2017
202 Evelyn Ln, Brandon, MS 39042
$-295
Cash flow
-3.4%
Cash-on-Cash Return
4.9%
Cap rate
0.7%
Rent to Value Ratio
Active
$265,000
4
bds
|
2
ba
|
0
sqft
|
built
2005
555 Lincolns Dr, Brandon, MS 39042
$188
Cash flow
3.7%
Cash-on-Cash Return
6.5%
Cap rate
0.9%
Rent to Value Ratio
Active
$272,500
3
bds
|
2
ba
|
0
sqft
|
built
2012
624 Westhill Rd, Brandon, MS 39042
$-44
Cash flow
-0.8%
Cash-on-Cash Return
5.5%
Cap rate
0.8%
Rent to Value Ratio
Active
$785,000
5
bds
|
5
ba
|
0
sqft
|
built
1958
100 City Limits Rd, Brandon, MS 39042
$-1,955
Cash flow
-13.0%
Cash-on-Cash Return
2.7%
Cap rate
0.4%
Rent to Value Ratio
Active
$379,900
4
bds
|
3
ba
|
0
sqft
|
built
1994
3087 Louis Wilson Dr, Brandon, MS 39042
$173
Cash flow
2.4%
Cash-on-Cash Return
6.2%
Cap rate
0.8%
Rent to Value Ratio
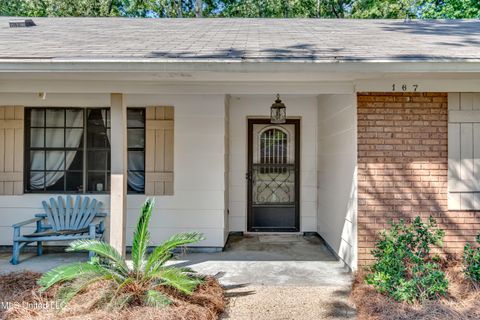
Active
$249,877
4
bds
|
2
ba
|
0
sqft
|
built
1977
167 Woodgate Dr, Brandon, MS 39042
$307
Cash flow
6.4%
Cash-on-Cash Return
7.2%
Cap rate
0.9%
Rent to Value Ratio
Active
$280,000
3
bds
|
2
ba
|
0
sqft
|
built
2014
504 Westpark Ct, Brandon, MS 39042
$83
Cash flow
1.5%
Cash-on-Cash Return
6.0%
Cap rate
0.8%
Rent to Value Ratio
Active
$849,500
5
bds
|
4
ba
|
0
sqft
|
built
2019
4167 Highway 18, Brandon, MS 39042
$-1,778
Cash flow
-10.9%
Cash-on-Cash Return
3.2%
Cap rate
0.4%
Rent to Value Ratio
Active
$269,900
3
bds
|
2
ba
|
0
sqft
|
built
2021
938 Filmore Dr, Brandon, MS 39042
$241
Cash flow
4.7%
Cash-on-Cash Return
6.7%
Cap rate
0.8%
Rent to Value Ratio

Active
$750,000
5
bds
|
4
ba
|
0
sqft
|
built
2015
230 Eastwood Dr, Brandon, MS 39042
$-938
Cash flow
-6.5%
Cash-on-Cash Return
4.2%
Cap rate
0.6%
Rent to Value Ratio
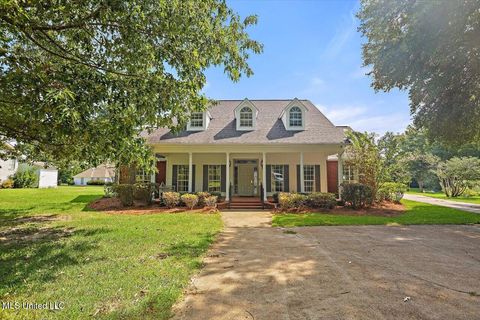
Active
$395,000
3
bds
|
3
ba
|
0
sqft
|
built
2007
115 Provonce Park, Brandon, MS 39042
$-211
Cash flow
-2.8%
Cash-on-Cash Return
5.0%
Cap rate
0.7%
Rent to Value Ratio
Active
$365,000
4
bds
|
3
ba
|
0
sqft
|
built
1997
52 Eastgate Dr, Brandon, MS 39042
$-111
Cash flow
-1.6%
Cash-on-Cash Return
5.3%
Cap rate
0.7%
Rent to Value Ratio
Active
$257,000
3
bds
|
2
ba
|
0
sqft
|
built
1999
1120 Ellington Ct, Brandon, MS 39042
$81
Cash flow
1.6%
Cash-on-Cash Return
6.1%
Cap rate
0.9%
Rent to Value Ratio
Active
$379,900
4
bds
|
2
ba
|
0
sqft
|
built
2016
1178 Sanctuary Dr, Brandon, MS 39042
$-38
Cash flow
-0.5%
Cash-on-Cash Return
5.6%
Cap rate
0.7%
Rent to Value Ratio
Active
$2,300,000
4
bds
|
5
ba
|
0
sqft
|
built
1900
3826 Highway 18, Brandon, MS 39042
$-8,262
Cash flow
-18.7%
Cash-on-Cash Return
1.4%
Cap rate
0.2%
Rent to Value Ratio
Active
$288,400
3
bds
|
2
ba
|
0
sqft
|
built
2007
318 Towne St, Brandon, MS 39042
$166
Cash flow
3.0%
Cash-on-Cash Return
6.4%
Cap rate
0.9%
Rent to Value Ratio
Active
$330,000
4
bds
|
3
ba
|
0
sqft
|
built
2005
303 Beacon Hl, Brandon, MS 39042
$105
Cash flow
1.7%
Cash-on-Cash Return
6.1%
Cap rate
0.8%
Rent to Value Ratio
Active
$290,000
3
bds
|
2
ba
|
0
sqft
|
built
1972
36 Pebble Hill Dr, Brandon, MS 39042
$89
Cash flow
1.6%
Cash-on-Cash Return
6.0%
Cap rate
0.8%
Rent to Value Ratio
Active
$805,000
4
bds
|
3
ba
|
0
sqft
|
built
2004
840 Westerly Dr, Brandon, MS 39042
$-1,385
Cash flow
-9.0%
Cash-on-Cash Return
3.6%
Cap rate
0.5%
Rent to Value Ratio
Active
$369,000
4
bds
|
3
ba
|
0
sqft
|
built
2007
111 Meadow Pointe Cv, Brandon, MS 39042
$-260
Cash flow
-3.7%
Cash-on-Cash Return
4.8%
Cap rate
0.8%
Rent to Value Ratio
Active
$259,900
3
bds
|
2
ba
|
0
sqft
|
built
2012
249 Greenfield Ridge Dr, Brandon, MS 39042
$40
Cash flow
0.8%
Cash-on-Cash Return
5.9%
Cap rate
0.8%
Rent to Value Ratio
Active
$315,000
3
bds
|
2
ba
|
0
sqft
|
built
1998
1137 Ellington Ct, Brandon, MS 39042
$-7
Cash flow
-0.1%
Cash-on-Cash Return
5.7%
Cap rate
0.7%
Rent to Value Ratio
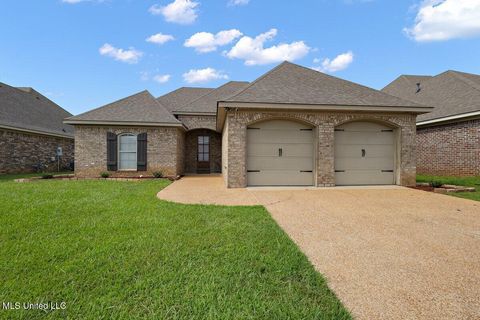
Active
$328,500
3
bds
|
2
ba
|
0
sqft
|
built
2023
104 Shelby Mae Cir, Brandon, MS 39042
$-10
Cash flow
-0.2%
Cash-on-Cash Return
5.6%
Cap rate
0.8%
Rent to Value Ratio
Active
$339,000
3
bds
|
2
ba
|
0
sqft
|
built
2003
225 E Towne Dr, Brandon, MS 39042
$-143
Cash flow
-2.2%
Cash-on-Cash Return
5.2%
Cap rate
0.7%
Rent to Value Ratio
Active
$350,000
3
bds
|
3
ba
|
0
sqft
|
built
2022
705 Hartwood Cv, Brandon, MS 39042
$-344
Cash flow
-5.1%
Cash-on-Cash Return
4.5%
Cap rate
0.7%
Rent to Value Ratio
Active
$645,000
5
bds
|
4
ba
|
0
sqft
|
built
2006
739 Westerly Dr, Brandon, MS 39042
$-726
Cash flow
-5.9%
Cash-on-Cash Return
4.3%
Cap rate
0.6%
Rent to Value Ratio
Active
$939,000
5
bds
|
4
ba
|
0
sqft
|
built
2008
715 Westerly Dr, Brandon, MS 39042
$-1,543
Cash flow
-8.6%
Cash-on-Cash Return
3.7%
Cap rate
0.5%
Rent to Value Ratio
Active
$319,000
4
bds
|
2
ba
|
0
sqft
|
built
1976
79 Terrapin Dr, Brandon, MS 39042
$98
Cash flow
1.6%
Cash-on-Cash Return
6.0%
Cap rate
0.8%
Rent to Value Ratio
Active
$722,000
5
bds
|
3
ba
|
0
sqft
|
built
2006
191 N Brandon Blvd, Brandon, MS 39042
$-1,071
Cash flow
-7.7%
Cash-on-Cash Return
3.9%
Cap rate
0.5%
Rent to Value Ratio
Active
$244,500
3
bds
|
2
ba
|
0
sqft
|
built
2004
404 Briars Bnd, Brandon, MS 39042
$110
Cash flow
2.3%
Cash-on-Cash Return
6.2%
Cap rate
0.9%
Rent to Value Ratio