46052 Investment Properties for Sale
Browse homes for sale and investment properties in 46052. Refine your search by price, property type, or more.
Best cash flowing properties in 46052
Active
$210,000
2
bds
|
1
ba
|
975
sqft
|
built
1977
817 Hamilton St, Lebanon, IN 46052
$77
Cash flow
1.9%
Cash-on-Cash Return
6.7%
Cap rate
0.8%
Rent to Value Ratio
Active
$149,900
1
bds
|
1
ba
|
495
sqft
|
built
1940
201 W Essex St, Lebanon, IN 46052
$-24
Cash flow
-0.8%
Cash-on-Cash Return
6.1%
Cap rate
0.7%
Rent to Value Ratio
29 out of 35 properties for sale in 46052
Limited Results Shown
Create a free account, or log in to reveal all property listings and enjoy the complete experience.

Active
$800,000
3
bds
|
3
ba
|
2,891
sqft
|
built
1978
4545 W 200 S, Lebanon, IN 46052
$-2,245
Cash flow
-14.6%
Cash-on-Cash Return
2.9%
Cap rate
0.4%
Rent to Value Ratio
Active
$340,000
4
bds
|
1
ba
|
2,471
sqft
|
built
1907
1170 E 400 S, Lebanon, IN 46052
$-395
Cash flow
-6.1%
Cash-on-Cash Return
4.9%
Cap rate
0.6%
Rent to Value Ratio
Active
$1,100,000
4
bds
|
6
ba
|
5,668
sqft
|
built
1999
2009 W 250 N, Lebanon, IN 46052
$-2,983
Cash flow
-14.1%
Cash-on-Cash Return
3.0%
Cap rate
0.4%
Rent to Value Ratio
Active
$369,900
3
bds
|
3
ba
|
2,268
sqft
|
built
1930
223 E Fordice St, Lebanon, IN 46052
$-827
Cash flow
-11.7%
Cash-on-Cash Return
3.6%
Cap rate
0.4%
Rent to Value Ratio
Active
$315,000
3
bds
|
2
ba
|
1,700
sqft
|
built
2016
524 S Meridian St, Lebanon, IN 46052
$-265
Cash flow
-4.4%
Cash-on-Cash Return
5.3%
Cap rate
0.6%
Rent to Value Ratio
Active
$1,200,000
5
bds
|
5
ba
|
4,224
sqft
|
built
1860
695 N 650 W, Lebanon, IN 46052
$-4,678
Cash flow
-20.3%
Cash-on-Cash Return
1.6%
Cap rate
0.2%
Rent to Value Ratio
Active
$345,900
4
bds
|
3
ba
|
2,200
sqft
|
built
2022
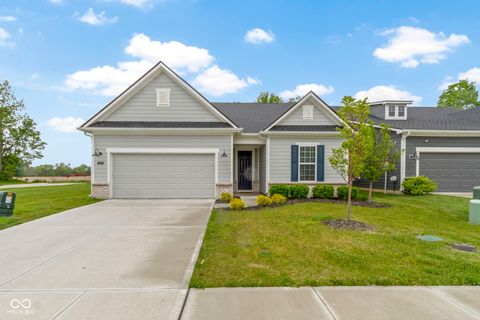
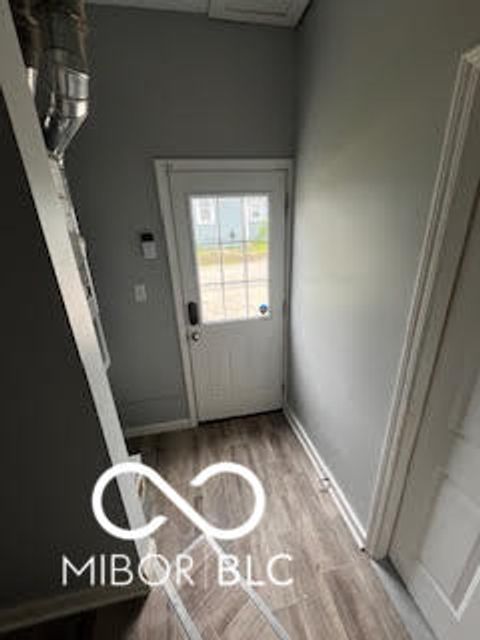
975 Red Hills Ct, Lebanon, IN 46052
$-317
Cash flow
-4.8%
Cash-on-Cash Return
5.2%
Cap rate
0.6%
Rent to Value Ratio
Active
$364,900
3
bds
|
2
ba
|
1,728
sqft
|
built
2022
7248 Covington St, Lebanon, IN 46052
$-76
Cash flow
-1.1%
Cash-on-Cash Return
6.0%
Cap rate
0.8%
Rent to Value Ratio
Active
$229,900
2
bds
|
1
ba
|
1,080
sqft
|
built
1945
517 Dicks St, Lebanon, IN 46052
$-27
Cash flow
-0.6%
Cash-on-Cash Return
6.1%
Cap rate
0.7%
Rent to Value Ratio
Active
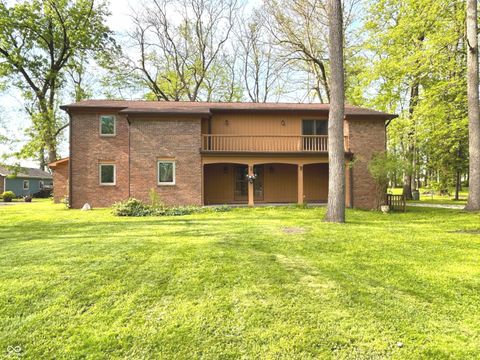
$450,000
4
bds
|
3
ba
|
3,447
sqft
|
built
1973
830 Millerwood Dr, Lebanon, IN 46052
$-442
Cash flow
-5.1%
Cash-on-Cash Return
5.1%
Cap rate
0.6%
Rent to Value Ratio
Active
$1,292,500
7
bds
|
6
ba
|
6,351
sqft
|
built
1991
690 N 600 W, Lebanon, IN 46052
$-3,298
Cash flow
-13.3%
Cash-on-Cash Return
3.2%
Cap rate
0.4%
Rent to Value Ratio
Active
$380,000
3
bds
|
2
ba
|
1,843
sqft
|
built
2016
2913 Lily Dr, Lebanon, IN 46052
$-345
Cash flow
-4.7%
Cash-on-Cash Return
5.2%
Cap rate
0.6%
Rent to Value Ratio
Active
$649,900
3
bds
|
2
ba
|
4,066
sqft
|
built
2017
1502 W 525 N, Lebanon, IN 46052
$-1,392
Cash flow
-11.2%
Cash-on-Cash Return
3.7%
Cap rate
0.4%
Rent to Value Ratio

Active
$495,000
4
bds
|
3
ba
|
3,986
sqft
|
built
1900
2365 E 850 N, Lebanon, IN 46052
$-100
Cash flow
-1.1%
Cash-on-Cash Return
6.0%
Cap rate
0.7%
Rent to Value Ratio

Active
$349,900
4
bds
|
3
ba
|
2,644
sqft
|
built
2007
1711 Jaques Dr, Lebanon, IN 46052
$-257
Cash flow
-3.8%
Cash-on-Cash Return
5.4%
Cap rate
0.7%
Rent to Value Ratio
Active
$341,000
3
bds
|
2
ba
|
1,714
sqft
|
built
1979
2625 S 200 E, Lebanon, IN 46052
$-262
Cash flow
-4.0%
Cash-on-Cash Return
5.3%
Cap rate
0.6%
Rent to Value Ratio
Active
$595,000
3
bds
|
4
ba
|
3,215
sqft
|
built
2015
900 W Busby St, Lebanon, IN 46052
$-1,323
Cash flow
-11.6%
Cash-on-Cash Return
3.5%
Cap rate
0.4%
Rent to Value Ratio
Active
$320,000
3
bds
|
2
ba
|
1,850
sqft
|
built
1940
511 N Clark St, Lebanon, IN 46052
$-84
Cash flow
-1.4%
Cash-on-Cash Return
6.0%
Cap rate
0.7%
Rent to Value Ratio
Active
$432,500
4
bds
|
3
ba
|
2,609
sqft
|
built
2017
750 Trillium St, Lebanon, IN 46052
$-551
Cash flow
-6.6%
Cash-on-Cash Return
4.7%
Cap rate
0.6%
Rent to Value Ratio

Active
$325,000
4
bds
|
3
ba
|
1,630
sqft
|
built
1948
2575 S Indianapolis Rd, Lebanon, IN 46052
$-455
Cash flow
-7.3%
Cash-on-Cash Return
4.6%
Cap rate
0.6%
Rent to Value Ratio
Active
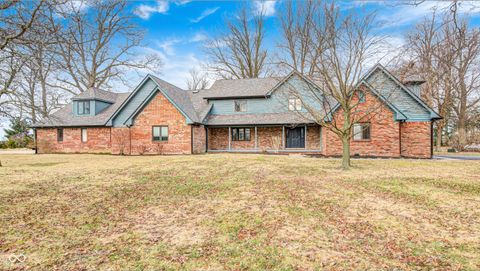
$559,000
4
bds
|
3
ba
|
3,260
sqft
|
built
2001
2215 Golfside Dr, Lebanon, IN 46052
$-1,003
Cash flow
-9.4%
Cash-on-Cash Return
4.1%
Cap rate
0.5%
Rent to Value Ratio
Active
$205,000
3
bds
|
1
ba
|
960
sqft
|
built
1954
903 Sunset Dr, Lebanon, IN 46052
$-104
Cash flow
-2.6%
Cash-on-Cash Return
5.7%
Cap rate
0.7%
Rent to Value Ratio
Active
$179,900
2
bds
|
1
ba
|
1,280
sqft
|
built
1976
1711 Lafayette Ave, Lebanon, IN 46052
$-106
Cash flow
-3.1%
Cash-on-Cash Return
5.6%
Cap rate
0.9%
Rent to Value Ratio
Active
$272,500
3
bds
|
2
ba
|
1,600
sqft
|
built
1930
128 W Walnut St, Lebanon, IN 46052
$-181
Cash flow
-3.5%
Cash-on-Cash Return
5.5%
Cap rate
0.7%
Rent to Value Ratio
Active
$244,500
3
bds
|
1
ba
|
912
sqft
|
built
1957
1021 Harney Dr, Lebanon, IN 46052
$-379
Cash flow
-8.1%
Cash-on-Cash Return
4.4%
Cap rate
0.5%
Rent to Value Ratio
Active
$317,000
3
bds
|
3
ba
|
1,520
sqft
|
built
2022
853 Woodbridge Way, Lebanon, IN 46052
$-144
Cash flow
-2.4%
Cash-on-Cash Return
5.6%
Cap rate
0.7%
Rent to Value Ratio
Active
$549,000
3
bds
|
2
ba
|
2,273
sqft
|
built
1979
1624 Riley Rd, Lebanon, IN 46052
$-1,279
Cash flow
-12.2%
Cash-on-Cash Return
3.5%
Cap rate
0.4%
Rent to Value Ratio