46203 Investment Properties for Sale
Browse homes for sale and investment properties in 46203. Refine your search by price, property type, or more.
Best cash flowing properties in 46203
Active
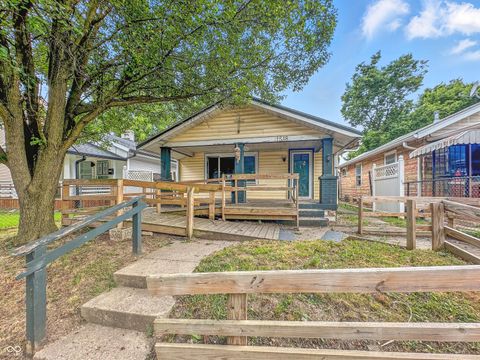
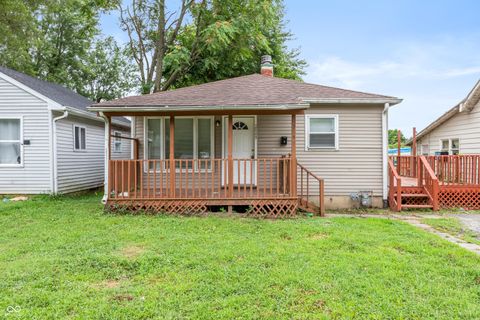
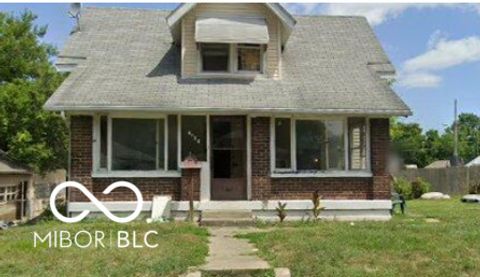
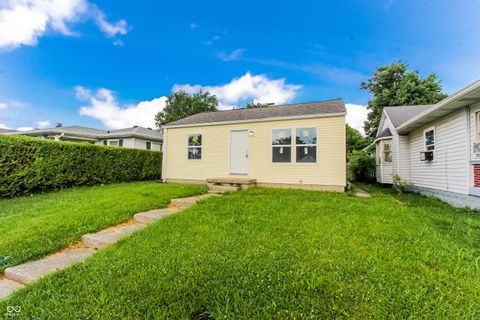
$109,000
2
bds
|
1
ba
|
1,200
sqft
|
built
1926
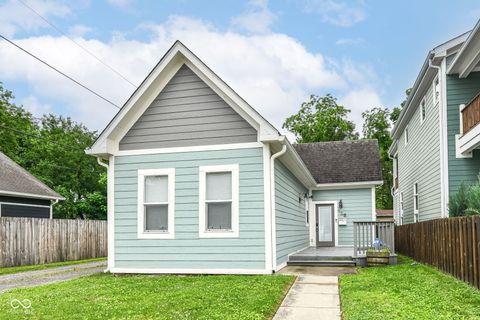
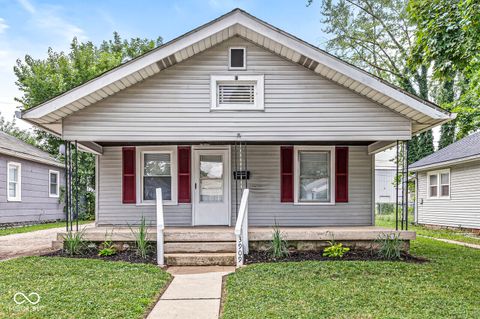
1518 Asbury St, Indianapolis, IN 46203
$408
Cash flow
19.5%
Cash-on-Cash Return
10.6%
Cap rate
1.3%
Rent to Value Ratio
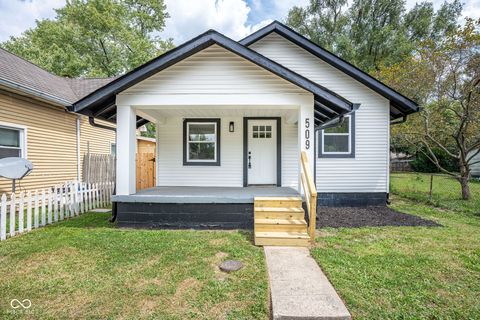
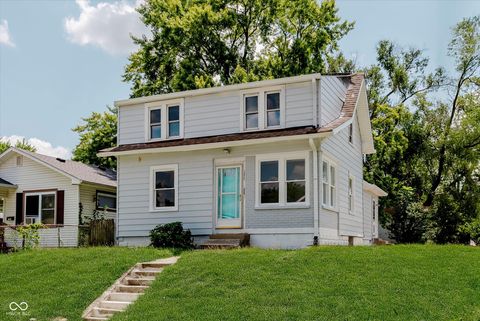
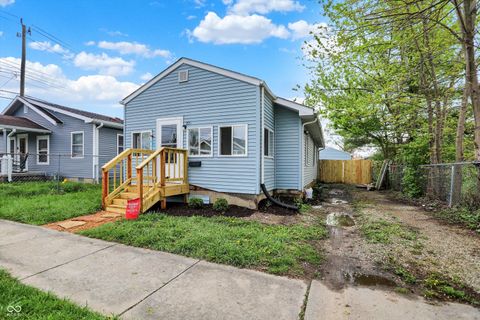
Active
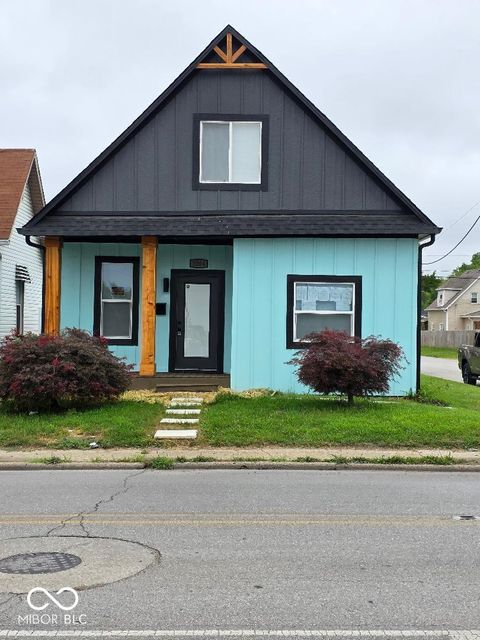
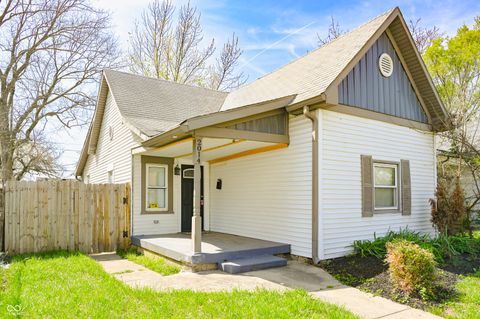
$190,000
2
bds
|
2
ba
|
900
sqft
|
built
1955
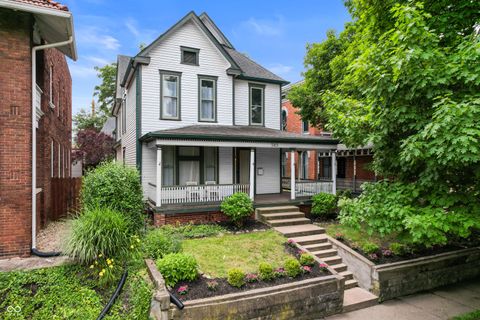
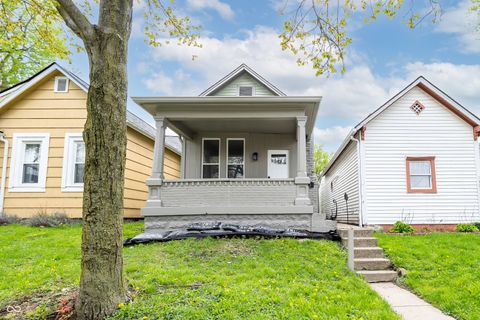
509 Saint Paul St, Indianapolis, IN 46203
$407
Cash flow
11.2%
Cash-on-Cash Return
8.7%
Cap rate
1.1%
Rent to Value Ratio
147 out of 153 properties for sale in 46203
Limited Results Shown
Create a free account, or log in to reveal all property listings and enjoy the complete experience.
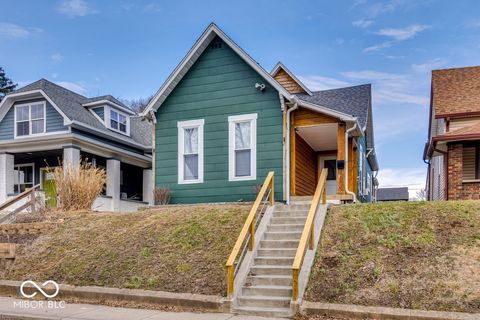
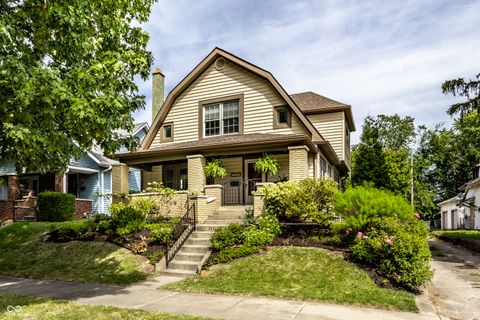
Active
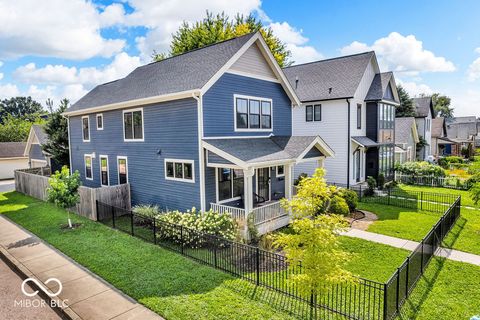
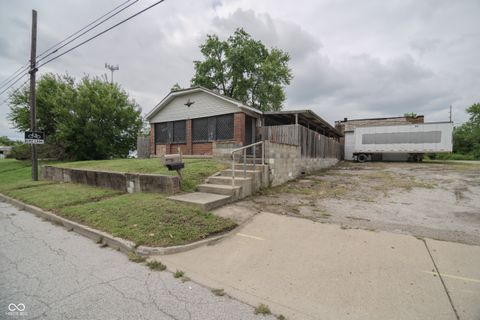
$350,000
3
bds
|
3
ba
|
2,485
sqft
|
built
2012
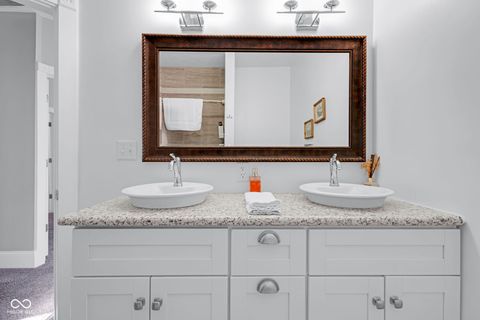
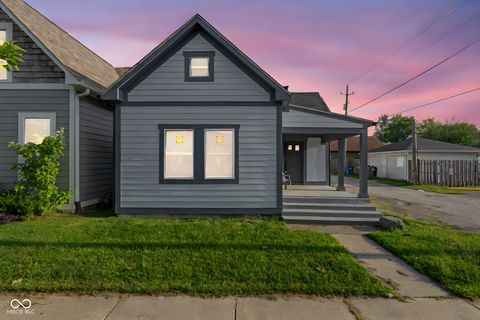
922 Iowa St, Indianapolis, IN 46203
$-68
Cash flow
-1.0%
Cash-on-Cash Return
5.9%
Cap rate
0.7%
Rent to Value Ratio
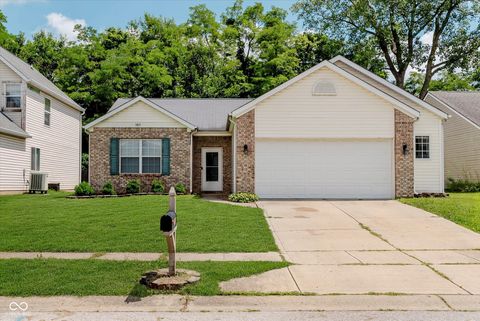
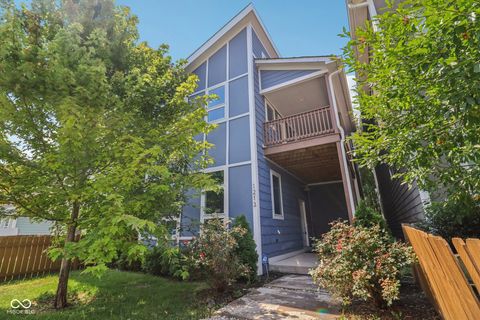
Active
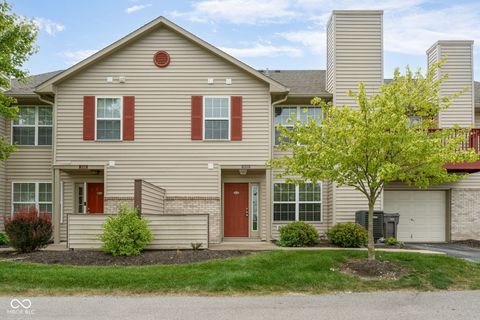
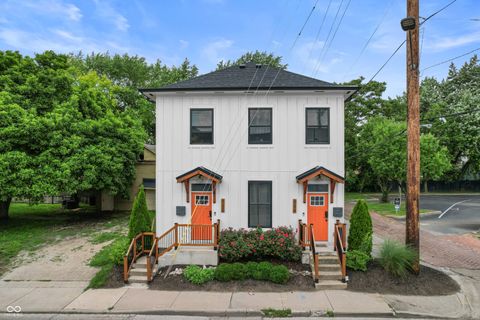
$234,900
3
bds
|
2
ba
|
1,192
sqft
|
built
2000
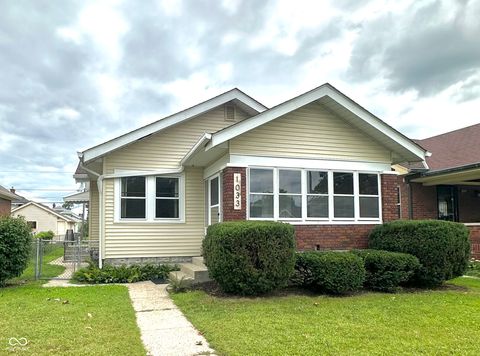
3815 Churchman Woods Blvd, Indianapolis, IN 46203
$-116
Cash flow
-2.6%
Cash-on-Cash Return
5.6%
Cap rate
0.7%
Rent to Value Ratio
Active
$325,000
3
bds
|
2
ba
|
1,737
sqft
|
built
1900
525 Orange St, Indianapolis, IN 46203
$-9
Cash flow
-0.1%
Cash-on-Cash Return
6.1%
Cap rate
0.7%
Rent to Value Ratio
Active
$125,000
3
bds
|
1
ba
|
1,344
sqft
|
built
1920
2134 Pleasant St, Indianapolis, IN 46203
$50
Cash flow
2.1%
Cash-on-Cash Return
6.6%
Cap rate
0.8%
Rent to Value Ratio
Active
$139,900
2
bds
|
1
ba
|
885
sqft
|
built
1923
1619 E Bradbury Ave, Indianapolis, IN 46203
$180
Cash flow
6.7%
Cash-on-Cash Return
7.7%
Cap rate
0.9%
Rent to Value Ratio
Active
$149,900
2
bds
|
1
ba
|
916
sqft
|
built
1905
2025 Barth Ave, Indianapolis, IN 46203
$198
Cash flow
6.9%
Cash-on-Cash Return
7.7%
Cap rate
0.9%
Rent to Value Ratio
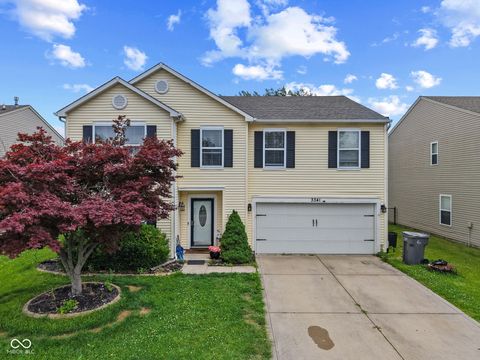
Active
$299,900
3
bds
|
3
ba
|
2,630
sqft
|
built
2000
3341 Carica Dr, Indianapolis, IN 46203
$-56
Cash flow
-1.0%
Cash-on-Cash Return
5.9%
Cap rate
0.7%
Rent to Value Ratio
Active
$194,900
3
bds
|
2
ba
|
1,473
sqft
|
built
1914
1501 Nelson Ave, Indianapolis, IN 46203
$-101
Cash flow
-2.7%
Cash-on-Cash Return
5.5%
Cap rate
0.7%
Rent to Value Ratio
Active
$469,900
3
bds
|
3
ba
|
2,256
sqft
|
built
2019
1803 Fletcher Ave, Indianapolis, IN 46203
$-613
Cash flow
-6.8%
Cash-on-Cash Return
4.6%
Cap rate
0.6%
Rent to Value Ratio
Active
$235,000
3
bds
|
2
ba
|
1,354
sqft
|
built
1960
2602 S Oxford St, Indianapolis, IN 46203
$-169
Cash flow
-3.8%
Cash-on-Cash Return
5.3%
Cap rate
0.6%
Rent to Value Ratio
Active
$125,000
3
bds
|
1
ba
|
875
sqft
|
built
1952
2049 Reformers Ave, Indianapolis, IN 46203
$119
Cash flow
5.0%
Cash-on-Cash Return
7.3%
Cap rate
0.9%
Rent to Value Ratio
Active
$191,900
2
bds
|
3
ba
|
1,218
sqft
|
built
1925
1004 S Keystone Ave, Indianapolis, IN 46203
$-86
Cash flow
-2.3%
Cash-on-Cash Return
5.6%
Cap rate
0.7%
Rent to Value Ratio
Active
$660,000
5
bds
|
4
ba
|
3,285
sqft
|
built
2020
1459 Spann Ave, Indianapolis, IN 46203
$-621
Cash flow
-4.9%
Cash-on-Cash Return
5.0%
Cap rate
0.6%
Rent to Value Ratio
Active
$165,000
2
bds
|
2
ba
|
1,206
sqft
|
built
2006
3010 Wildcat Ln, Indianapolis, IN 46203
$-64
Cash flow
-2.0%
Cash-on-Cash Return
5.7%
Cap rate
0.8%
Rent to Value Ratio
Active
$99,000
4
bds
|
2
ba
|
1,632
sqft
|
built
1914
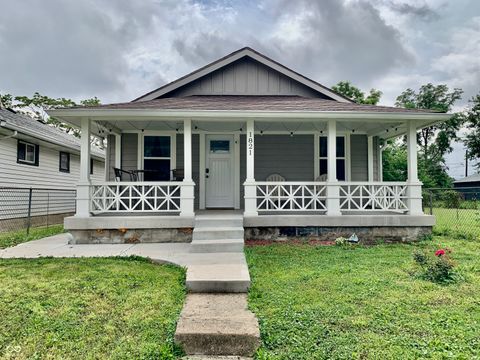
1534 Cruft St, Indianapolis, IN 46203
$390
Cash flow
20.6%
Cash-on-Cash Return
10.9%
Cap rate
1.3%
Rent to Value Ratio
Active
$184,900
2
bds
|
2
ba
|
979
sqft
|
built
1910
2014 Barth Ave, Indianapolis, IN 46203
$88
Cash flow
2.5%
Cash-on-Cash Return
6.7%
Cap rate
0.8%
Rent to Value Ratio
Active
$250,000
1
bds
|
1
ba
|
1,248
sqft
|
built
1955
3324 Prospect St, Indianapolis, IN 46203
$-384
Cash flow
-8.0%
Cash-on-Cash Return
4.3%
Cap rate
0.5%
Rent to Value Ratio
Active
$580,000
4
bds
|
0
ba
|
0
sqft
|
built
1940
934 Calvary St, Indianapolis, IN 46203
$-2,212
Cash flow
-19.9%
Cash-on-Cash Return
1.6%
Cap rate
0.2%
Rent to Value Ratio
Active
$139,000
2
bds
|
1
ba
|
725
sqft
|
built
1950
2350 E Legrande Ave, Indianapolis, IN 46203
$254
Cash flow
9.5%
Cash-on-Cash Return
8.3%
Cap rate
1.0%
Rent to Value Ratio
Active
$126,000
2
bds
|
1
ba
|
880
sqft
|
built
1922
1719 Dawson St, Indianapolis, IN 46203
$183
Cash flow
7.6%
Cash-on-Cash Return
7.9%
Cap rate
1.0%
Rent to Value Ratio
Active
$294,900
2
bds
|
2
ba
|
1,680
sqft
|
built
1915
1044 E Garfield Dr, Indianapolis, IN 46203
$214
Cash flow
3.8%
Cash-on-Cash Return
7.0%
Cap rate
0.8%
Rent to Value Ratio
Active
$420,000
4
bds
|
3
ba
|
2,491
sqft
|
built
2017
1213 Cottage Ave, Indianapolis, IN 46203
$264
Cash flow
3.3%
Cash-on-Cash Return
6.9%
Cap rate
0.8%
Rent to Value Ratio
Active
$274,000
2
bds
|
2
ba
|
968
sqft
|
built
1890
1221 Cottage Ave, Indianapolis, IN 46203
$-162
Cash flow
-3.1%
Cash-on-Cash Return
5.4%
Cap rate
0.7%
Rent to Value Ratio
Active
$975,000
5
bds
|
6
ba
|
2,200
sqft
|
built
1900
545 Fletcher Ave, Indianapolis, IN 46203
$-1,061
Cash flow
-5.7%
Cash-on-Cash Return
4.8%
Cap rate
0.6%
Rent to Value Ratio
Active
$425,000
4
bds
|
4
ba
|
1,748
sqft
|
built
1900
1724 Prospect St, Indianapolis, IN 46203
$-590
Cash flow
-7.2%
Cash-on-Cash Return
4.5%
Cap rate
0.5%
Rent to Value Ratio
Active
$219,900
2
bds
|
2
ba
|
956
sqft
|
built
1922
1821 New St, Indianapolis, IN 46203
$254
Cash flow
6.0%
Cash-on-Cash Return
7.5%
Cap rate
0.9%
Rent to Value Ratio
Active
$145,000
2
bds
|
1
ba
|
864
sqft
|
built
1929
3909 Hoyt Ave, Indianapolis, IN 46203
$223
Cash flow
8.0%
Cash-on-Cash Return
8.0%
Cap rate
1.0%
Rent to Value Ratio
Active
$225,000
2
bds
|
1
ba
|
802
sqft
|
built
1910
1305 Lexington Ave, Indianapolis, IN 46203
$-187
Cash flow
-4.3%
Cash-on-Cash Return
5.2%
Cap rate
0.6%
Rent to Value Ratio
Active
$374,995
4
bds
|
3
ba
|
2,209
sqft
|
built
1920
519 E Minnesota St, Indianapolis, IN 46203
$-1,024
Cash flow
-14.2%
Cash-on-Cash Return
2.9%
Cap rate
0.3%
Rent to Value Ratio
Active
$299,000
3
bds
|
2
ba
|
1,276
sqft
|
built
1929
1033 E Yoke St, Indianapolis, IN 46203
$-428
Cash flow
-7.5%
Cash-on-Cash Return
4.4%
Cap rate
0.5%
Rent to Value Ratio
Active
$325,000
3
bds
|
3
ba
|
1,216
sqft
|
built
2016
1456 Fletcher Ave, Indianapolis, IN 46203
$267
Cash flow
4.3%
Cash-on-Cash Return
7.1%
Cap rate
0.9%
Rent to Value Ratio
Active
$164,900
3
bds
|
1
ba
|
900
sqft
|
built
1912
1339 Wade St, Indianapolis, IN 46203
$121
Cash flow
3.8%
Cash-on-Cash Return
7.0%
Cap rate
0.8%
Rent to Value Ratio
Active
$244,000
3
bds
|
2
ba
|
1,542
sqft
|
built
1910
2230 Pleasant St, Indianapolis, IN 46203
$61
Cash flow
1.3%
Cash-on-Cash Return
6.4%
Cap rate
0.8%
Rent to Value Ratio
Active
$179,900
3
bds
|
2
ba
|
1,156
sqft
|
built
1900
1016 Dawson St, Indianapolis, IN 46203
$-232
Cash flow
-6.7%
Cash-on-Cash Return
4.6%
Cap rate
0.6%
Rent to Value Ratio
Active
$319,000
3
bds
|
3
ba
|
2,138
sqft
|
built
1898
615 E Morris St, Indianapolis, IN 46203
$-254
Cash flow
-4.2%
Cash-on-Cash Return
5.2%
Cap rate
0.6%
Rent to Value Ratio
Active
$399,900
4
bds
|
3
ba
|
2,492
sqft
|
built
1925
1852 Singleton St, Indianapolis, IN 46203
$91
Cash flow
1.2%
Cash-on-Cash Return
6.4%
Cap rate
0.8%
Rent to Value Ratio
Active
$220,000
2
bds
|
2
ba
|
1,219
sqft
|
built
1922
2320 Spann Ave, Indianapolis, IN 46203
$253
Cash flow
6.0%
Cash-on-Cash Return
7.5%
Cap rate
0.9%
Rent to Value Ratio
Active
$429,000
3
bds
|
3
ba
|
2,152
sqft
|
built
1885
1627 Pleasant St, Indianapolis, IN 46203
$-59
Cash flow
-0.7%
Cash-on-Cash Return
6.0%
Cap rate
0.7%
Rent to Value Ratio