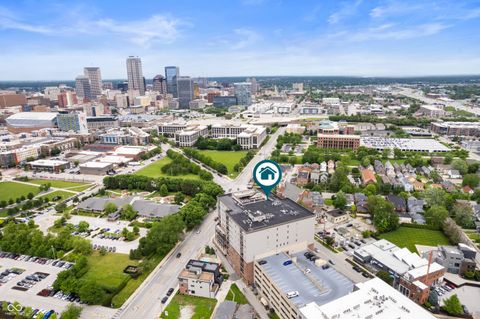
46203 Investment Properties for Sale
Browse homes for sale and investment properties in 46203. Refine your search by price, property type, or more.
Best cash flowing properties in 46203
Active
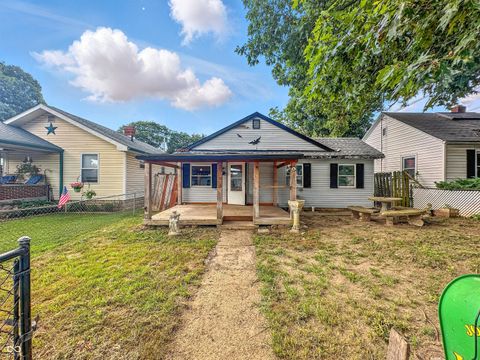
$89,900
2
bds
|
1
ba
|
964
sqft
|
built
2017
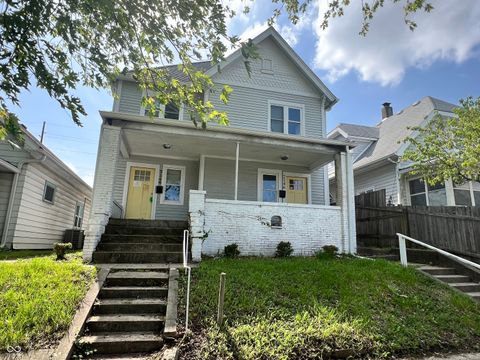
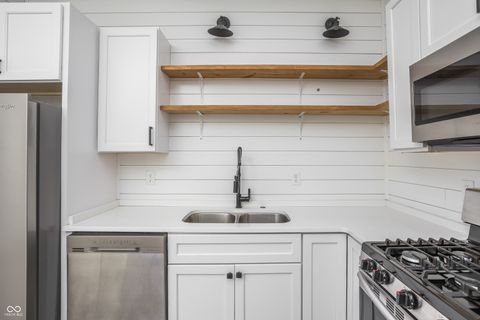
2148 Singleton St, Indianapolis, IN 46203
$436
Cash flow
25.3%
Cash-on-Cash Return
12.0%
Cap rate
1.4%
Rent to Value Ratio
Active
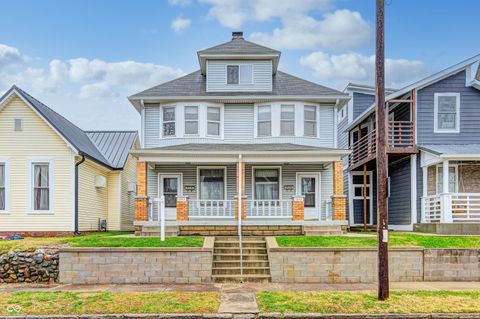
$109,000
2
bds
|
1
ba
|
1,200
sqft
|
built
1926
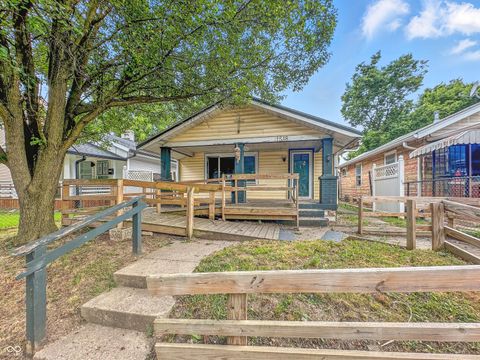
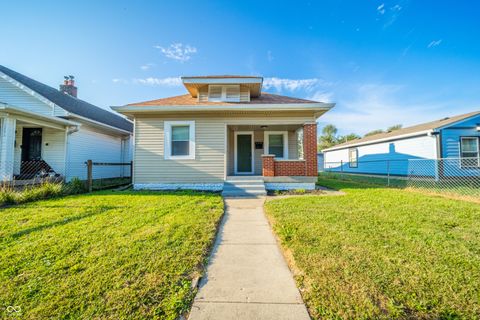
1518 Asbury St, Indianapolis, IN 46203
$408
Cash flow
19.5%
Cash-on-Cash Return
10.6%
Cap rate
1.3%
Rent to Value Ratio
133 out of 137 properties for sale in 46203
Limited Results Shown
Create a free account, or log in to reveal all property listings and enjoy the complete experience.
Active
$219,900
2
bds
|
2
ba
|
956
sqft
|
built
1922
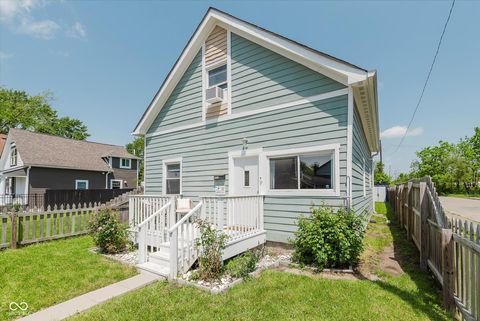
1821 New St, Indianapolis, IN 46203
$254
Cash flow
6.0%
Cash-on-Cash Return
7.5%
Cap rate
0.9%
Rent to Value Ratio
Active
$299,000
3
bds
|
2
ba
|
1,276
sqft
|
built
1929
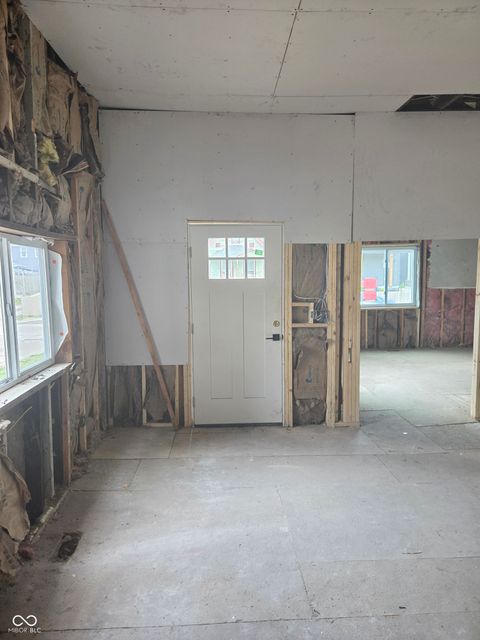
1033 E Yoke St, Indianapolis, IN 46203
$-428
Cash flow
-7.5%
Cash-on-Cash Return
4.4%
Cap rate
0.5%
Rent to Value Ratio
Active
$325,000
3
bds
|
3
ba
|
1,216
sqft
|
built
2016
1456 Fletcher Ave, Indianapolis, IN 46203
$267
Cash flow
4.3%
Cash-on-Cash Return
7.1%
Cap rate
0.9%
Rent to Value Ratio
Active
$164,900
3
bds
|
1
ba
|
900
sqft
|
built
1912
1339 Wade St, Indianapolis, IN 46203
$121
Cash flow
3.8%
Cash-on-Cash Return
7.0%
Cap rate
0.8%
Rent to Value Ratio
Active
$244,000
3
bds
|
2
ba
|
1,542
sqft
|
built
1910
2230 Pleasant St, Indianapolis, IN 46203
$61
Cash flow
1.3%
Cash-on-Cash Return
6.4%
Cap rate
0.8%
Rent to Value Ratio
Active
$179,900
3
bds
|
2
ba
|
1,156
sqft
|
built
1900
1016 Dawson St, Indianapolis, IN 46203
$-232
Cash flow
-6.7%
Cash-on-Cash Return
4.6%
Cap rate
0.6%
Rent to Value Ratio
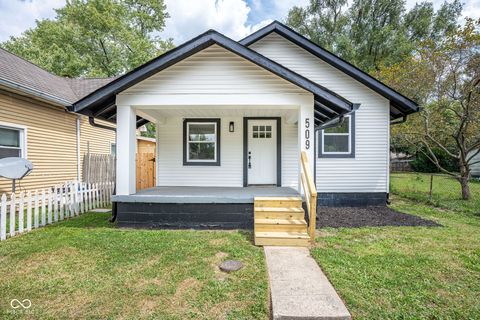
Active
$190,000
2
bds
|
2
ba
|
900
sqft
|
built
1955
509 Saint Paul St, Indianapolis, IN 46203
$407
Cash flow
11.2%
Cash-on-Cash Return
8.7%
Cap rate
1.1%
Rent to Value Ratio
Active
$319,000
3
bds
|
3
ba
|
2,138
sqft
|
built
1898
615 E Morris St, Indianapolis, IN 46203
$-254
Cash flow
-4.2%
Cash-on-Cash Return
5.2%
Cap rate
0.6%
Rent to Value Ratio
Active
$220,000
2
bds
|
2
ba
|
1,219
sqft
|
built
1922
2320 Spann Ave, Indianapolis, IN 46203
$253
Cash flow
6.0%
Cash-on-Cash Return
7.5%
Cap rate
0.9%
Rent to Value Ratio
Active
$429,000
3
bds
|
3
ba
|
2,152
sqft
|
built
1885
1627 Pleasant St, Indianapolis, IN 46203
$-59
Cash flow
-0.7%
Cash-on-Cash Return
6.0%
Cap rate
0.7%
Rent to Value Ratio
Active
$750,000
3
bds
|
3
ba
|
2,080
sqft
|
built
2006
435 Virginia Ave, Indianapolis, IN 46203
$-2,311
Cash flow
-16.1%
Cash-on-Cash Return
2.4%
Cap rate
0.5%
Rent to Value Ratio

Active
$329,000
3
bds
|
3
ba
|
1,540
sqft
|
built
1890
834 Weghorst St, Indianapolis, IN 46203
$109
Cash flow
1.7%
Cash-on-Cash Return
6.5%
Cap rate
0.8%
Rent to Value Ratio

Active
$165,000
2
bds
|
2
ba
|
1,206
sqft
|
built
2003
3082 Wildcat Ln, Indianapolis, IN 46203
$-64
Cash flow
-2.0%
Cash-on-Cash Return
5.7%
Cap rate
0.8%
Rent to Value Ratio

Active
$314,900
3
bds
|
2
ba
|
1,044
sqft
|
built
1962
1145 Villa Ave, Indianapolis, IN 46203
$-371
Cash flow
-6.1%
Cash-on-Cash Return
4.7%
Cap rate
0.6%
Rent to Value Ratio

Active
$169,900
3
bds
|
1
ba
|
1,124
sqft
|
built
1962
1618 E Gimber St, Indianapolis, IN 46203
$27
Cash flow
0.8%
Cash-on-Cash Return
6.3%
Cap rate
0.8%
Rent to Value Ratio

Active
$166,500
4
bds
|
2
ba
|
1,104
sqft
|
built
1971
1150 Vandeman St, Indianapolis, IN 46203
$44
Cash flow
1.4%
Cash-on-Cash Return
6.5%
Cap rate
0.8%
Rent to Value Ratio

Active
$389,000
4
bds
|
2
ba
|
2,910
sqft
|
built
1900
1036 Dawson St, Indianapolis, IN 46203
$-475
Cash flow
-6.4%
Cash-on-Cash Return
4.7%
Cap rate
0.6%
Rent to Value Ratio

Active
$149,000
2
bds
|
1
ba
|
704
sqft
|
built
1950
1730 S State Ave, Indianapolis, IN 46203
$134
Cash flow
4.7%
Cash-on-Cash Return
7.2%
Cap rate
0.9%
Rent to Value Ratio

Active
$326,000
4
bds
|
3
ba
|
1,890
sqft
|
built
1930
1210 Finley Ave, Indianapolis, IN 46203
$-152
Cash flow
-2.4%
Cash-on-Cash Return
5.6%
Cap rate
0.7%
Rent to Value Ratio

Active
$479,900
4
bds
|
4
ba
|
3,351
sqft
|
built
2018
808 E Minnesota St, Indianapolis, IN 46203
$-43
Cash flow
-0.5%
Cash-on-Cash Return
6.0%
Cap rate
0.7%
Rent to Value Ratio

Active
$124,900
2
bds
|
0
ba
|
0
sqft
|
built
1925
1610 Hoefgen St, Indianapolis, IN 46203
$-157
Cash flow
-6.6%
Cash-on-Cash Return
4.6%
Cap rate
0.6%
Rent to Value Ratio
Active
$375,000
3
bds
|
3
ba
|
2,118
sqft
|
built
2010
1838 Applegate St, Indianapolis, IN 46203
$80
Cash flow
1.1%
Cash-on-Cash Return
6.4%
Cap rate
0.8%
Rent to Value Ratio
Active
$179,000
2
bds
|
2
ba
|
836
sqft
|
built
1911
1127 E Kelly St, Indianapolis, IN 46203
$187
Cash flow
5.5%
Cash-on-Cash Return
7.4%
Cap rate
0.9%
Rent to Value Ratio

Active
$475,000
3
bds
|
3
ba
|
2,310
sqft
|
built
2018
1226 Cottage Ave, Indianapolis, IN 46203
$51
Cash flow
0.6%
Cash-on-Cash Return
6.3%
Cap rate
0.8%
Rent to Value Ratio
Active
$194,900
2
bds
|
1
ba
|
759
sqft
|
built
1928
1841 New St, Indianapolis, IN 46203
$106
Cash flow
2.8%
Cash-on-Cash Return
6.8%
Cap rate
0.8%
Rent to Value Ratio

Active
$237,500
2
bds
|
2
ba
|
1,536
sqft
|
built
1900
1035 Albany St, Indianapolis, IN 46203
$-44
Cash flow
-1.0%
Cash-on-Cash Return
5.9%
Cap rate
0.7%
Rent to Value Ratio
Active
$119,500
3
bds
|
1
ba
|
936
sqft
|
built
1932
1654 E Bradbury Ave, Indianapolis, IN 46203
$285
Cash flow
12.4%
Cash-on-Cash Return
9.0%
Cap rate
1.1%
Rent to Value Ratio

Active
$469,000
3
bds
|
4
ba
|
1,883
sqft
|
built
1910
1434 Orange St, Indianapolis, IN 46203
$13
Cash flow
0.1%
Cash-on-Cash Return
6.2%
Cap rate
0.7%
Rent to Value Ratio

Active
$135,000
2
bds
|
1
ba
|
953
sqft
|
built
1955
1719 Thaddeus St, Indianapolis, IN 46203
$274
Cash flow
10.6%
Cash-on-Cash Return
8.6%
Cap rate
1.0%
Rent to Value Ratio

Active
$140,000
2
bds
|
1
ba
|
720
sqft
|
built
1940
4339 Spann Ave, Indianapolis, IN 46203
$249
Cash flow
9.3%
Cash-on-Cash Return
8.3%
Cap rate
1.0%
Rent to Value Ratio

Active
$239,900
2
bds
|
2
ba
|
1,115
sqft
|
built
1920
1234 E Pleasant Run Parkway North Dr, Indianapolis, IN 46203
$151
Cash flow
3.3%
Cash-on-Cash Return
6.9%
Cap rate
0.8%
Rent to Value Ratio

Active
$187,000
2
bds
|
1
ba
|
936
sqft
|
built
1995
1737 Laurel St, Indianapolis, IN 46203
$146
Cash flow
4.1%
Cash-on-Cash Return
7.1%
Cap rate
0.9%
Rent to Value Ratio

Active
$125,000
2
bds
|
1
ba
|
768
sqft
|
built
1955
1861 New St, Indianapolis, IN 46203
$257
Cash flow
10.7%
Cash-on-Cash Return
8.6%
Cap rate
1.0%
Rent to Value Ratio

Active
$595,000
4
bds
|
3
ba
|
2,724
sqft
|
built
1890
1067 Hosbrook St, Indianapolis, IN 46203
$-884
Cash flow
-7.8%
Cash-on-Cash Return
3.9%
Cap rate
0.5%
Rent to Value Ratio

Active
$294,900
2
bds
|
2
ba
|
1,465
sqft
|
built
1915
818 Parkway Ave, Indianapolis, IN 46203
$-131
Cash flow
-2.3%
Cash-on-Cash Return
5.6%
Cap rate
0.7%
Rent to Value Ratio
Active
$675,000
4
bds
|
4
ba
|
2,405
sqft
|
built
2022
811 E Minnesota St, Indianapolis, IN 46203
$-353
Cash flow
-2.7%
Cash-on-Cash Return
5.5%
Cap rate
0.7%
Rent to Value Ratio
Active
$980,000
5
bds
|
6
ba
|
4,265
sqft
|
built
1955
543 Fletcher Ave, Indianapolis, IN 46203
$-3,019
Cash flow
-16.1%
Cash-on-Cash Return
2.5%
Cap rate
0.3%
Rent to Value Ratio
Active
$300,000
4
bds
|
0
ba
|
0
sqft
|
built
1920
1845 Barth Ave, Indianapolis, IN 46203
$-709
Cash flow
-12.3%
Cash-on-Cash Return
3.3%
Cap rate
0.4%
Rent to Value Ratio