46222 Investment Properties for Sale
Browse homes for sale and investment properties in 46222. Refine your search by price, property type, or more.
Best cash flowing properties in 46222
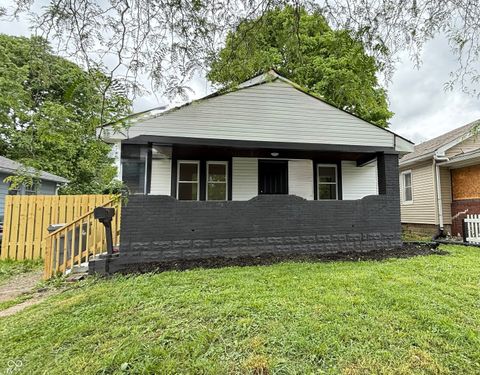
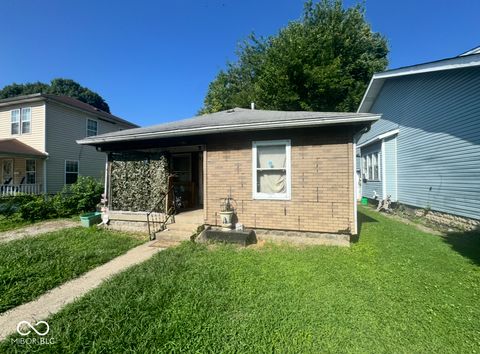
Active
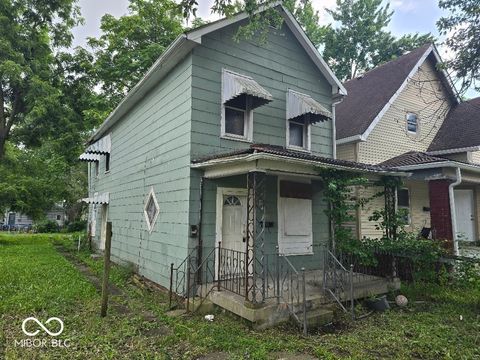
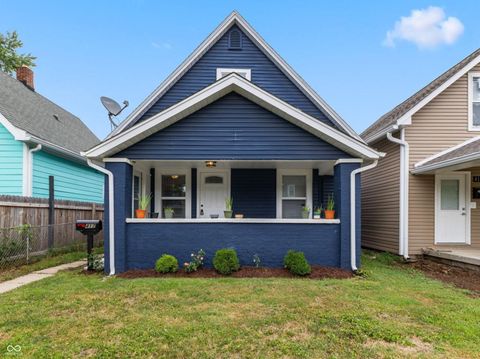
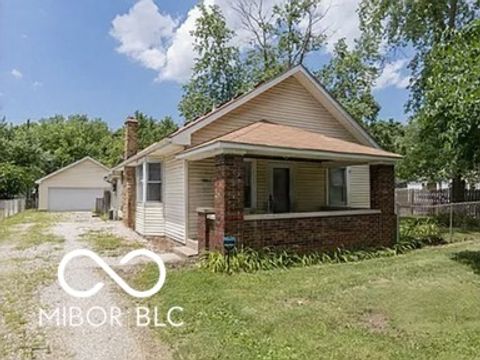
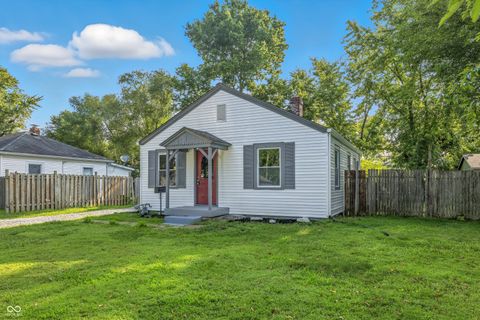
$49,900
3
bds
|
2
ba
|
1,344
sqft
|
built
1920
131 S Elder Ave, Indianapolis, IN 46222
$897
Cash flow
20.9%
Cash-on-Cash Return
21.6%
Cap rate
2.6%
Rent to Value Ratio
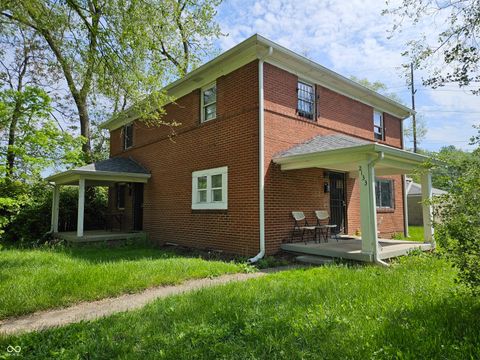
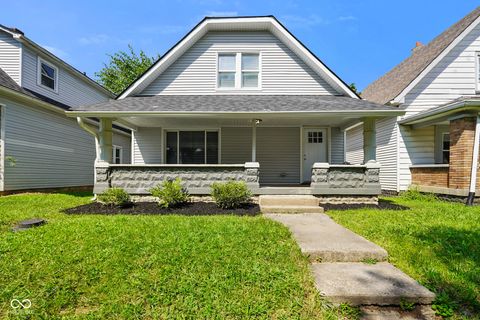
Active
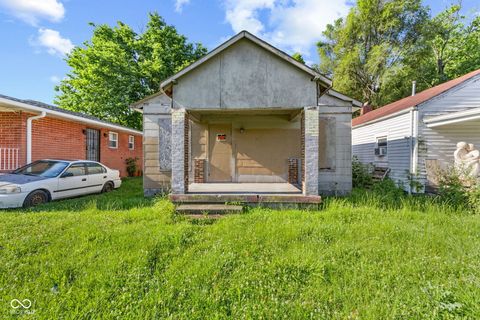
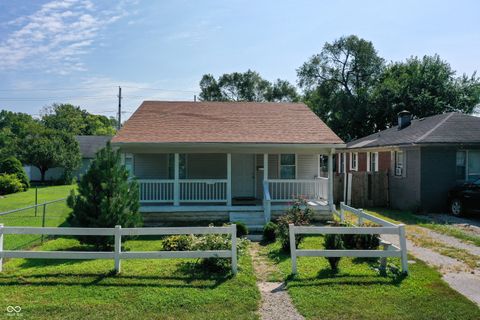
$40,000
2
bds
|
1
ba
|
720
sqft
|
built
1912
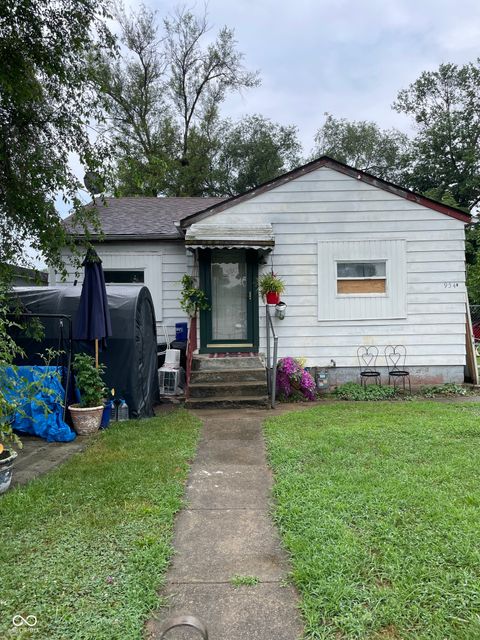
3335 W 9th St, Indianapolis, IN 46222
$759
Cash flow
22.1%
Cash-on-Cash Return
22.8%
Cap rate
2.8%
Rent to Value Ratio
66 out of 67 properties for sale in 46222
Limited Results Shown
Create a free account, or log in to reveal all property listings and enjoy the complete experience.
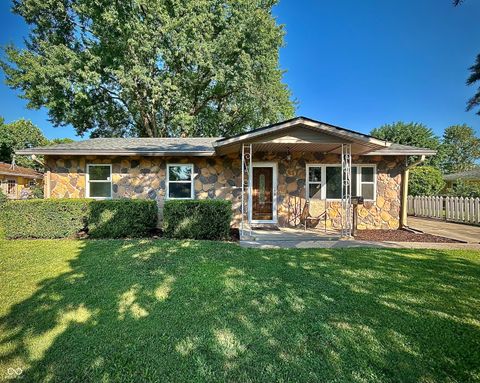
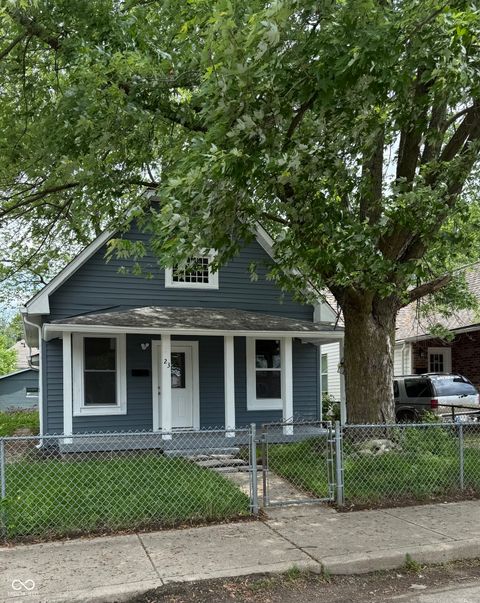
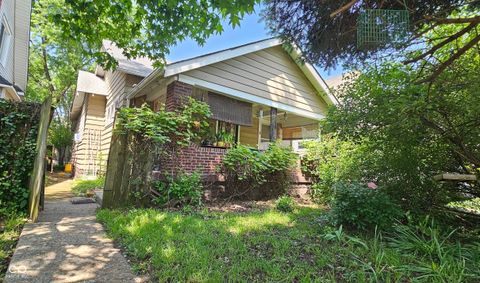
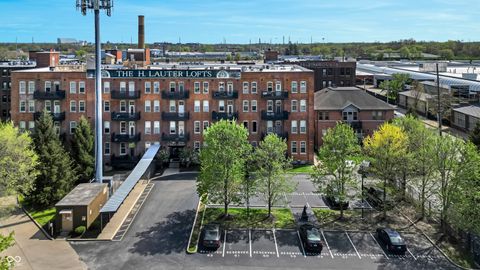
Active
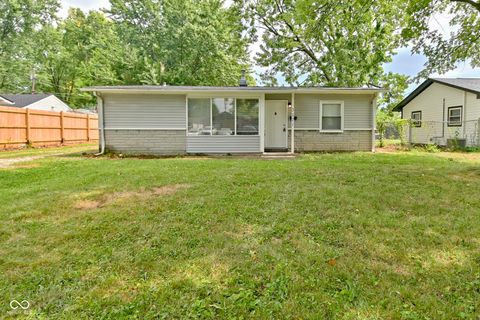
$169,900
3
bds
|
1
ba
|
980
sqft
|
built
1955
3221 Lowry Rd, Indianapolis, IN 46222
$27
Cash flow
0.8%
Cash-on-Cash Return
6.3%
Cap rate
0.8%
Rent to Value Ratio
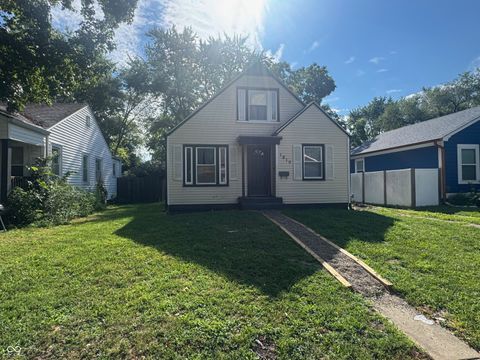
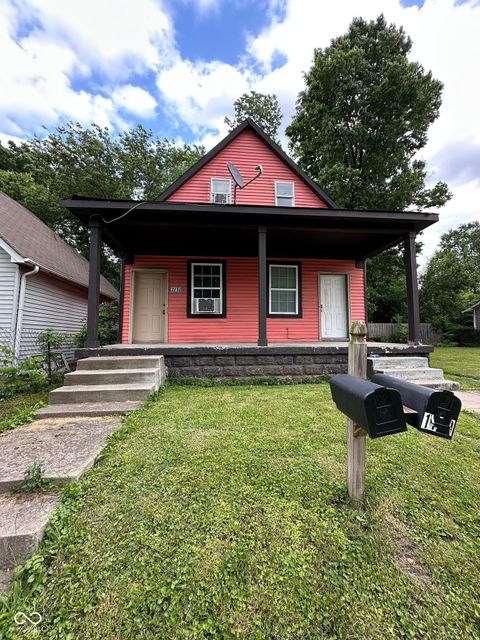
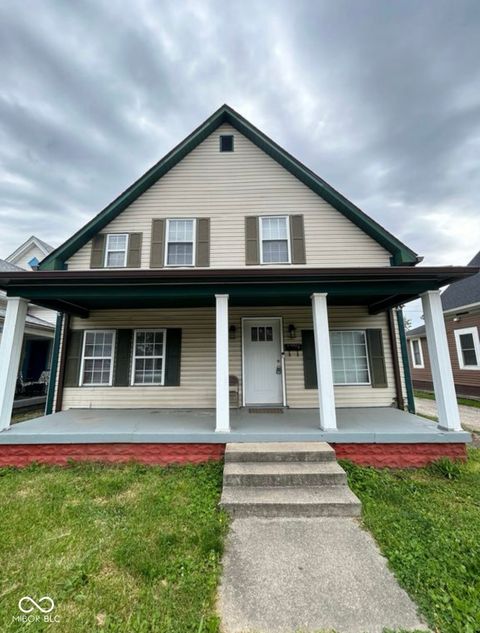
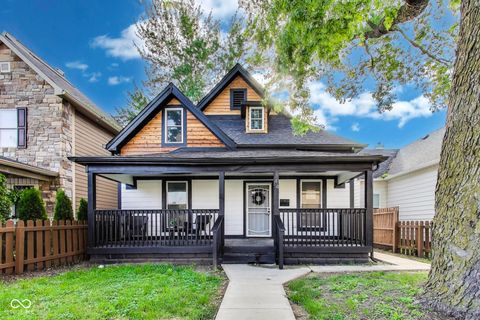
Active
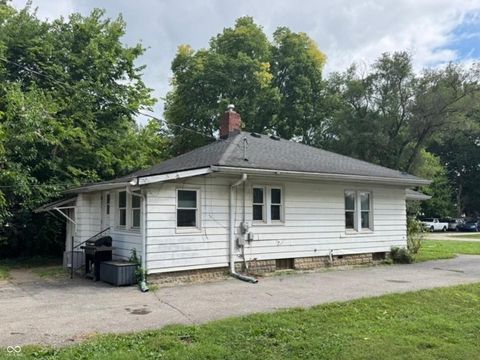
$127,000
2
bds
|
1
ba
|
886
sqft
|
built
1930
1024 N Alton Ave, Indianapolis, IN 46222
$315
Cash flow
12.9%
Cash-on-Cash Return
9.1%
Cap rate
1.1%
Rent to Value Ratio
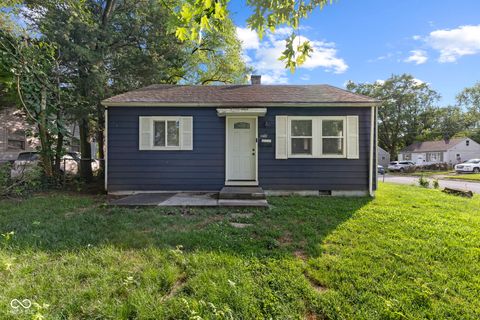
Active
$180,000
3
bds
|
1
ba
|
900
sqft
|
built
1955
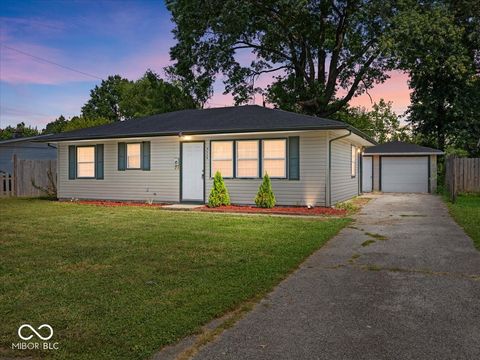
4528 Brittany Rd, Indianapolis, IN 46222
$44
Cash flow
1.3%
Cash-on-Cash Return
6.4%
Cap rate
0.8%
Rent to Value Ratio
Active
$150,000
3
bds
|
1
ba
|
924
sqft
|
built
1900
302 S Warman Ave, Indianapolis, IN 46222
$198
Cash flow
6.9%
Cash-on-Cash Return
7.7%
Cap rate
0.9%
Rent to Value Ratio
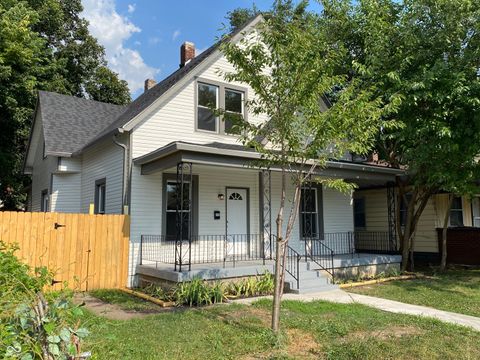
Active
$89,900
3
bds
|
2
ba
|
1,818
sqft
|
built
1948
954 N Moreland Ave, Indianapolis, IN 46222
$574
Cash flow
33.3%
Cash-on-Cash Return
13.8%
Cap rate
1.7%
Rent to Value Ratio
Active
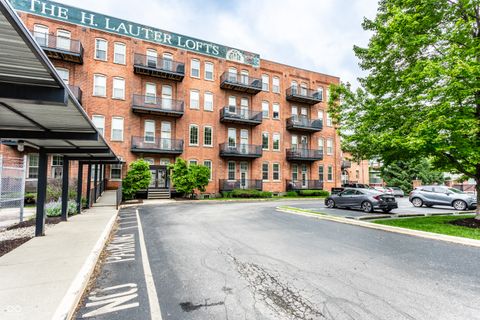
$169,900
1
bds
|
1
ba
|
754
sqft
|
built
1920
55 S Harding St, Indianapolis, IN 46222
$-115
Cash flow
-3.5%
Cash-on-Cash Return
5.3%
Cap rate
0.8%
Rent to Value Ratio
Active
$189,999
3
bds
|
1
ba
|
888
sqft
|
built
1945
3908 Bertrand Rd, Indianapolis, IN 46222
$-7
Cash flow
-0.2%
Cash-on-Cash Return
6.1%
Cap rate
0.7%
Rent to Value Ratio
Active
$99,000
3
bds
|
1
ba
|
1,072
sqft
|
built
1910
3426 W Michigan St, Indianapolis, IN 46222
$321
Cash flow
16.9%
Cash-on-Cash Return
10.0%
Cap rate
1.2%
Rent to Value Ratio
Active
$159,900
3
bds
|
1
ba
|
1,036
sqft
|
built
1972
1170 N Concord St, Indianapolis, IN 46222
$147
Cash flow
4.8%
Cash-on-Cash Return
7.2%
Cap rate
0.9%
Rent to Value Ratio
Active
$126,750
2
bds
|
1
ba
|
1,450
sqft
|
built
1945
1852 N Warman Ave, Indianapolis, IN 46222
$110
Cash flow
4.5%
Cash-on-Cash Return
7.2%
Cap rate
0.9%
Rent to Value Ratio
Active
$157,000
3
bds
|
1
ba
|
1,361
sqft
|
built
1920
1032 Groff Ave, Indianapolis, IN 46222
$162
Cash flow
5.4%
Cash-on-Cash Return
7.4%
Cap rate
0.9%
Rent to Value Ratio
Active
$200,000
3
bds
|
2
ba
|
1,034
sqft
|
built
1955
3230 Milan St, Indianapolis, IN 46222
$-58
Cash flow
-1.5%
Cash-on-Cash Return
5.8%
Cap rate
0.7%
Rent to Value Ratio
Active
$165,000
4
bds
|
1
ba
|
1,288
sqft
|
built
1944
1819 Sharon Ave, Indianapolis, IN 46222
$121
Cash flow
3.8%
Cash-on-Cash Return
7.0%
Cap rate
0.8%
Rent to Value Ratio
Active
$179,899
3
bds
|
2
ba
|
1,015
sqft
|
built
1949
2422 N Centennial St, Indianapolis, IN 46222
$182
Cash flow
5.3%
Cash-on-Cash Return
7.4%
Cap rate
0.9%
Rent to Value Ratio
Active
$75,000
2
bds
|
1
ba
|
904
sqft
|
built
1930
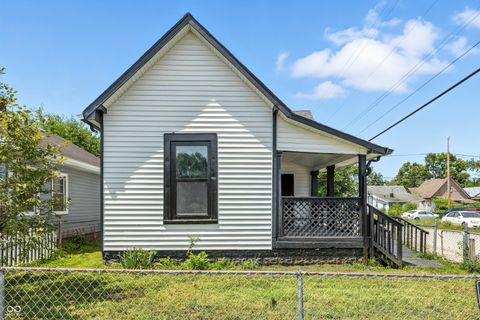
418 N Centennial St, Indianapolis, IN 46222
$513
Cash flow
35.7%
Cash-on-Cash Return
14.4%
Cap rate
1.7%
Rent to Value Ratio
Active
$190,000
0
bds
|
0
ba
|
0
sqft
|
built
1950
2133 Winfield Ave, Indianapolis, IN 46222
$-7
Cash flow
-0.2%
Cash-on-Cash Return
6.1%
Cap rate
0.7%
Rent to Value Ratio
Active
$129,999
2
bds
|
1
ba
|
770
sqft
|
built
1900
23 S Holmes Ave, Indianapolis, IN 46222
$93
Cash flow
3.7%
Cash-on-Cash Return
7.0%
Cap rate
0.8%
Rent to Value Ratio
Active
$165,000
3
bds
|
0
ba
|
0
sqft
|
built
1920
1129 N Pershing Ave, Indianapolis, IN 46222
$-155
Cash flow
-4.9%
Cash-on-Cash Return
5.0%
Cap rate
0.6%
Rent to Value Ratio
Active
$164,900
2
bds
|
1
ba
|
725
sqft
|
built
1949
2257 N Goodlet Ave, Indianapolis, IN 46222
$52
Cash flow
1.6%
Cash-on-Cash Return
6.5%
Cap rate
0.8%
Rent to Value Ratio
Active
$185,000
3
bds
|
1
ba
|
900
sqft
|
built
1955
3148 Keswick Rd, Indianapolis, IN 46222
$-51
Cash flow
-1.4%
Cash-on-Cash Return
5.8%
Cap rate
0.7%
Rent to Value Ratio
Active
$195,000
2
bds
|
1
ba
|
832
sqft
|
built
1930
717 Olin Ave, Indianapolis, IN 46222
$-240
Cash flow
-6.4%
Cash-on-Cash Return
4.7%
Cap rate
0.6%
Rent to Value Ratio
Active
$274,999
3
bds
|
2
ba
|
1,734
sqft
|
built
1955
1542 W New York St, Indianapolis, IN 46222
$-29
Cash flow
-0.6%
Cash-on-Cash Return
6.0%
Cap rate
0.7%
Rent to Value Ratio
Active
$255,000
3
bds
|
2
ba
|
1,710
sqft
|
built
1940
4024 Cossell Rd, Indianapolis, IN 46222
$212
Cash flow
4.3%
Cash-on-Cash Return
7.1%
Cap rate
0.9%
Rent to Value Ratio
Active
$159,900
3
bds
|
1
ba
|
1,120
sqft
|
built
1928
3646 Creston Dr, Indianapolis, IN 46222
$147
Cash flow
4.8%
Cash-on-Cash Return
7.2%
Cap rate
0.9%
Rent to Value Ratio
Active
$150,000
2
bds
|
1
ba
|
624
sqft
|
built
1952
1116 N Berwick Ave, Indianapolis, IN 46222
$129
Cash flow
4.5%
Cash-on-Cash Return
7.2%
Cap rate
0.9%
Rent to Value Ratio
Active
$154,900
2
bds
|
1
ba
|
1,342
sqft
|
built
1945
1425 Sharon Ave, Indianapolis, IN 46222
$173
Cash flow
5.8%
Cash-on-Cash Return
7.5%
Cap rate
0.9%
Rent to Value Ratio
Active
$204,999
3
bds
|
3
ba
|
1,560
sqft
|
built
1920
417 N Goodlet Ave, Indianapolis, IN 46222
$192
Cash flow
4.9%
Cash-on-Cash Return
7.3%
Cap rate
0.9%
Rent to Value Ratio
Active
$215,000
4
bds
|
3
ba
|
1,664
sqft
|
built
1915
1056 N Mount St, Indianapolis, IN 46222
$-342
Cash flow
-8.3%
Cash-on-Cash Return
4.2%
Cap rate
0.5%
Rent to Value Ratio
Active
$89,900
2
bds
|
1
ba
|
1,002
sqft
|
built
1910
250 N Tremont St, Indianapolis, IN 46222
$505
Cash flow
29.3%
Cash-on-Cash Return
12.9%
Cap rate
1.6%
Rent to Value Ratio
Active
$230,000
4
bds
|
2
ba
|
1,396
sqft
|
built
1920
249 N Richland St, Indianapolis, IN 46222
$-74
Cash flow
-1.7%
Cash-on-Cash Return
5.8%
Cap rate
0.7%
Rent to Value Ratio
Active
$140,000
4
bds
|
1
ba
|
1,886
sqft
|
built
1931
1062 N Berwick Ave, Indianapolis, IN 46222
$180
Cash flow
6.7%
Cash-on-Cash Return
7.7%
Cap rate
0.9%
Rent to Value Ratio
Active
$173,000
3
bds
|
1
ba
|
958
sqft
|
built
1920
1739 N Alton Ave, Indianapolis, IN 46222
$80
Cash flow
2.4%
Cash-on-Cash Return
6.7%
Cap rate
0.8%
Rent to Value Ratio
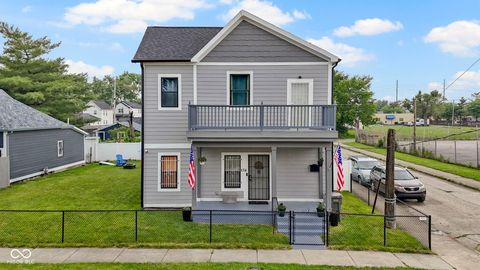
Active
$286,000
2
bds
|
2
ba
|
1,359
sqft
|
built
2004
55 S Harding St, Indianapolis, IN 46222
$-310
Cash flow
-5.7%
Cash-on-Cash Return
4.8%
Cap rate
0.8%
Rent to Value Ratio
Active
$260,000
4
bds
|
3
ba
|
2,154
sqft
|
built
1910
44 S Tremont St, Indianapolis, IN 46222
$-435
Cash flow
-8.7%
Cash-on-Cash Return
4.1%
Cap rate
0.5%
Rent to Value Ratio
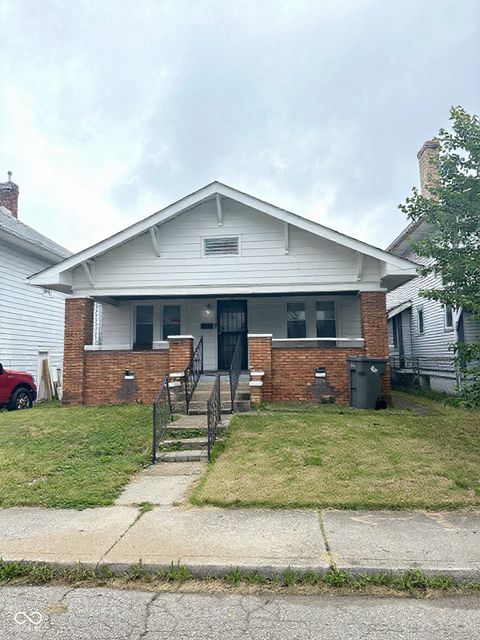
Active
$159,900
2
bds
|
1
ba
|
700
sqft
|
built
1940
1407 N Luett Ave, Indianapolis, IN 46222
$78
Cash flow
2.5%
Cash-on-Cash Return
6.7%
Cap rate
0.8%
Rent to Value Ratio
Active
$210,000
3
bds
|
2
ba
|
1,656
sqft
|
built
1920
113 S Traub Ave, Indianapolis, IN 46222
$28
Cash flow
0.7%
Cash-on-Cash Return
6.3%
Cap rate
0.8%
Rent to Value Ratio
Active
$259,900
4
bds
|
3
ba
|
2,188
sqft
|
built
1900
134 N Elder Ave, Indianapolis, IN 46222
$325
Cash flow
6.5%
Cash-on-Cash Return
7.6%
Cap rate
0.9%
Rent to Value Ratio
Active
$140,000
3
bds
|
1
ba
|
1,176
sqft
|
built
1910
57 N Tremont St, Indianapolis, IN 46222
$249
Cash flow
9.3%
Cash-on-Cash Return
8.3%
Cap rate
1.0%
Rent to Value Ratio