46225 Investment Properties for Sale
Browse homes for sale and investment properties in 46225. Refine your search by price, property type, or more.
Best cash flowing properties in 46225
Active
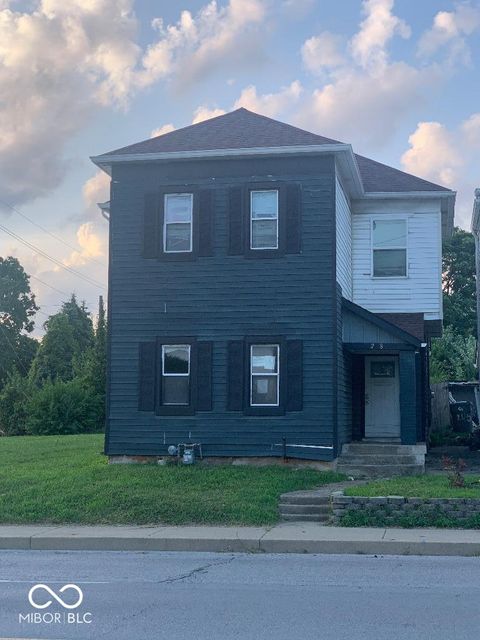
$152,000
3
bds
|
2
ba
|
1,736
sqft
|
built
1900
248 W Morris St, Indianapolis, IN 46225
$601
Cash flow
20.6%
Cash-on-Cash Return
10.9%
Cap rate
1.3%
Rent to Value Ratio

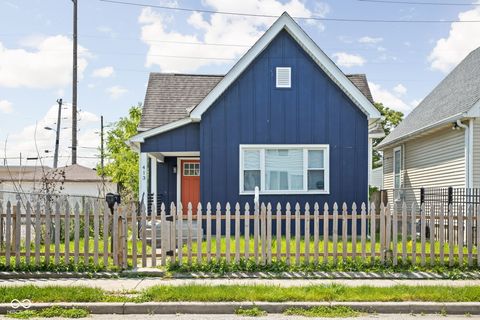
Active
$105,000
2
bds
|
1
ba
|
895
sqft
|
built
1918
2335 Union St, Indianapolis, IN 46225
$428
Cash flow
21.3%
Cash-on-Cash Return
11.0%
Cap rate
1.3%
Rent to Value Ratio
36 out of 37 properties for sale in 46225
Limited Results Shown
Create a free account, or log in to reveal all property listings and enjoy the complete experience.
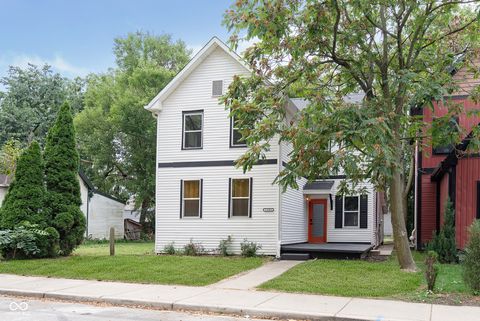
Active
$232,500
2
bds
|
2
ba
|
953
sqft
|
built
1895
413 E Caven St, Indianapolis, IN 46225
$189
Cash flow
4.2%
Cash-on-Cash Return
7.1%
Cap rate
0.9%
Rent to Value Ratio
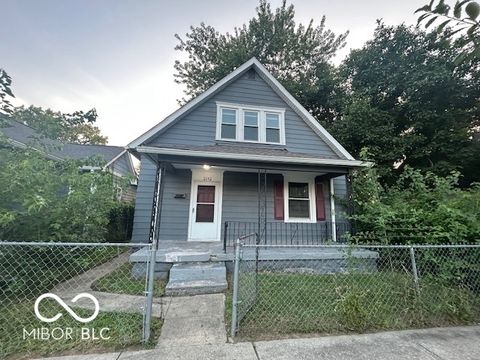
Active
$279,000
4
bds
|
3
ba
|
1,968
sqft
|
built
1922
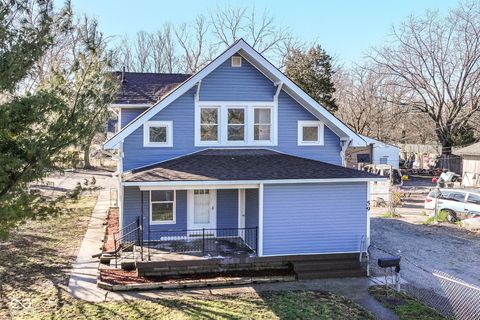
1306 S Talbott St, Indianapolis, IN 46225
$296
Cash flow
5.5%
Cash-on-Cash Return
7.4%
Cap rate
0.9%
Rent to Value Ratio

Active
$180,000
3
bds
|
2
ba
|
1,750
sqft
|
built
1950
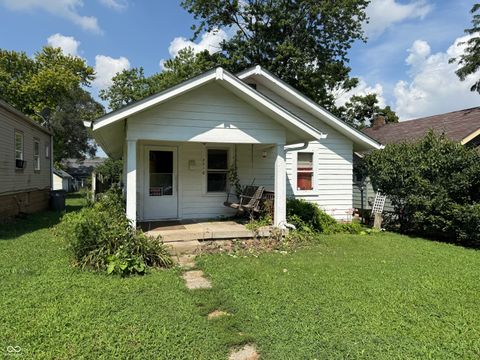
196 Bakemeyer St, Indianapolis, IN 46225
$182
Cash flow
5.3%
Cash-on-Cash Return
7.4%
Cap rate
0.9%
Rent to Value Ratio
Active
$174,900
3
bds
|
2
ba
|
1,496
sqft
|
built
1901
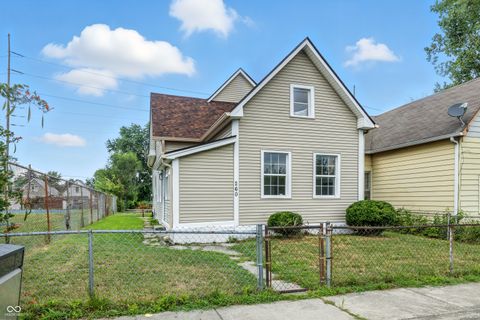
2142 Webb St, Indianapolis, IN 46225
$-137
Cash flow
-4.1%
Cash-on-Cash Return
5.2%
Cap rate
0.6%
Rent to Value Ratio
Active
$320,000
3
bds
|
2
ba
|
2,044
sqft
|
built
1896
260 E Beecher St, Indianapolis, IN 46225
$-397
Cash flow
-6.5%
Cash-on-Cash Return
4.7%
Cap rate
0.6%
Rent to Value Ratio

Active
$265,000
3
bds
|
3
ba
|
1,400
sqft
|
built
2022
1921 Union St, Indianapolis, IN 46225
$23
Cash flow
0.5%
Cash-on-Cash Return
6.2%
Cap rate
0.8%
Rent to Value Ratio

Active
$230,000
2
bds
|
2
ba
|
1,352
sqft
|
built
1895
1130 S Senate Ave, Indianapolis, IN 46225
$202
Cash flow
4.6%
Cash-on-Cash Return
7.2%
Cap rate
0.9%
Rent to Value Ratio

Active
$449,000
3
bds
|
4
ba
|
1,972
sqft
|
built
2021
417 E Morris St, Indianapolis, IN 46225
$115
Cash flow
1.3%
Cash-on-Cash Return
6.5%
Cap rate
0.8%
Rent to Value Ratio
Active
$265,000
3
bds
|
2
ba
|
1,130
sqft
|
built
1930
337 E Minnesota St, Indianapolis, IN 46225
$-184
Cash flow
-3.6%
Cash-on-Cash Return
5.3%
Cap rate
0.6%
Rent to Value Ratio

Active
$275,000
2
bds
|
1
ba
|
956
sqft
|
built
1880
907 S East St, Indianapolis, IN 46225
$-29
Cash flow
-0.6%
Cash-on-Cash Return
6.0%
Cap rate
0.7%
Rent to Value Ratio
Active
$205,000
0
bds
|
0
ba
|
0
sqft
|
built
1920
301 E Southern Ave, Indianapolis, IN 46225
$-84
Cash flow
-2.1%
Cash-on-Cash Return
5.7%
Cap rate
0.7%
Rent to Value Ratio
Active
$150,000
1
bds
|
1
ba
|
720
sqft
|
built
1922
2933 S East St, Indianapolis, IN 46225
$129
Cash flow
4.5%
Cash-on-Cash Return
7.2%
Cap rate
0.9%
Rent to Value Ratio
Active
$280,000
2
bds
|
2
ba
|
1,829
sqft
|
built
1923
2502 S Delaware St, Indianapolis, IN 46225
$-330
Cash flow
-6.1%
Cash-on-Cash Return
4.7%
Cap rate
0.6%
Rent to Value Ratio
Active
$229,900
2
bds
|
2
ba
|
912
sqft
|
built
1928
115 Wisconsin St, Indianapolis, IN 46225
$202
Cash flow
4.6%
Cash-on-Cash Return
7.2%
Cap rate
0.9%
Rent to Value Ratio

Active
$372,000
4
bds
|
3
ba
|
2,412
sqft
|
built
1920
326 Parkway Ave, Indianapolis, IN 46225
$26
Cash flow
0.4%
Cash-on-Cash Return
6.2%
Cap rate
0.8%
Rent to Value Ratio
Active
$109,900
3
bds
|
1
ba
|
1,808
sqft
|
built
1910
2165 S Meridian St, Indianapolis, IN 46225
$334
Cash flow
15.9%
Cash-on-Cash Return
9.8%
Cap rate
1.2%
Rent to Value Ratio
Active
$479,000
4
bds
|
3
ba
|
1,800
sqft
|
built
1880
1440 S New Jersey St, Indianapolis, IN 46225
$-1,695
Cash flow
-18.5%
Cash-on-Cash Return
1.9%
Cap rate
0.2%
Rent to Value Ratio
Active
$242,000
4
bds
|
3
ba
|
1,376
sqft
|
built
1886
2540 Madison Ave, Indianapolis, IN 46225
$-412
Cash flow
-8.9%
Cash-on-Cash Return
4.1%
Cap rate
0.5%
Rent to Value Ratio
Active
$365,000
4
bds
|
3
ba
|
1,774
sqft
|
built
1885
1425 Kennington St, Indianapolis, IN 46225
$-352
Cash flow
-5.0%
Cash-on-Cash Return
5.0%
Cap rate
0.6%
Rent to Value Ratio

Active
$268,000
2
bds
|
2
ba
|
983
sqft
|
built
1862
309 Sanders St, Indianapolis, IN 46225
$-131
Cash flow
-2.6%
Cash-on-Cash Return
5.6%
Cap rate
0.7%
Rent to Value Ratio

Active
$199,900
2
bds
|
2
ba
|
1,584
sqft
|
built
1920
1433 Charles St, Indianapolis, IN 46225
$149
Cash flow
3.9%
Cash-on-Cash Return
7.0%
Cap rate
0.9%
Rent to Value Ratio
Active
$235,000
2
bds
|
2
ba
|
882
sqft
|
built
1900
1413 S New Jersey St, Indianapolis, IN 46225
$38
Cash flow
0.8%
Cash-on-Cash Return
6.3%
Cap rate
0.8%
Rent to Value Ratio
Active
$267,500
3
bds
|
2
ba
|
1,842
sqft
|
built
1900
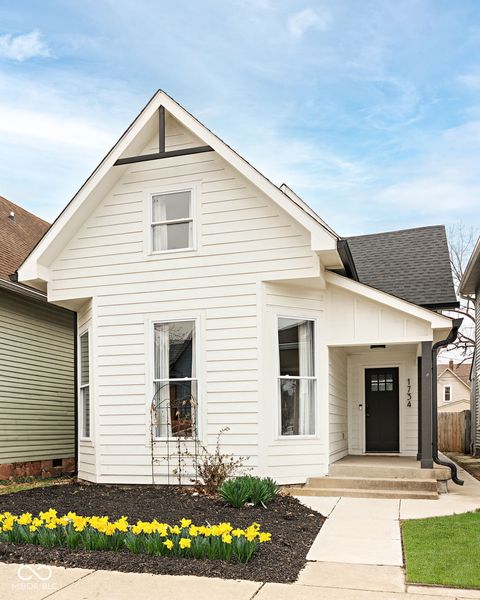
421 E Morris St, Indianapolis, IN 46225
$217
Cash flow
4.2%
Cash-on-Cash Return
7.1%
Cap rate
0.9%
Rent to Value Ratio
Active
$179,900
2
bds
|
1
ba
|
796
sqft
|
built
1923
2510 S Pennsylvania St, Indianapolis, IN 46225
$-25
Cash flow
-0.7%
Cash-on-Cash Return
6.0%
Cap rate
0.7%
Rent to Value Ratio
Active
$200,000
4
bds
|
3
ba
|
1,760
sqft
|
built
1910
59 E Troy Ave, Indianapolis, IN 46225
$-334
Cash flow
-8.7%
Cash-on-Cash Return
4.1%
Cap rate
0.5%
Rent to Value Ratio
Active
$434,900
4
bds
|
4
ba
|
3,500
sqft
|
built
1890
19 E Regent St, Indianapolis, IN 46225
$-1,262
Cash flow
-15.1%
Cash-on-Cash Return
2.7%
Cap rate
0.3%
Rent to Value Ratio
Active
$375,000
4
bds
|
3
ba
|
2,113
sqft
|
built
1910
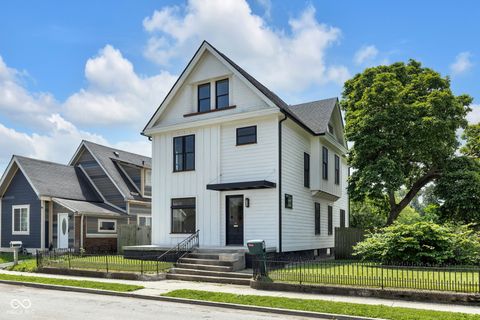
1734 S Talbott St, Indianapolis, IN 46225
$218
Cash flow
3.0%
Cash-on-Cash Return
6.8%
Cap rate
0.8%
Rent to Value Ratio
Active
$180,000
2
bds
|
1
ba
|
1,008
sqft
|
built
1968
113 W Gimber St, Indianapolis, IN 46225
$44
Cash flow
1.3%
Cash-on-Cash Return
6.4%
Cap rate
0.8%
Rent to Value Ratio
Active
$229,900
2
bds
|
0
ba
|
0
sqft
|
built
1920
408 E Beecher St, Indianapolis, IN 46225
$-281
Cash flow
-6.4%
Cash-on-Cash Return
4.7%
Cap rate
0.6%
Rent to Value Ratio
Active
$189,900
2
bds
|
1
ba
|
1,430
sqft
|
built
1925
2227 S Pennsylvania St, Indianapolis, IN 46225
$131
Cash flow
3.6%
Cash-on-Cash Return
7.0%
Cap rate
0.8%
Rent to Value Ratio
Active
$219,999
3
bds
|
2
ba
|
1,656
sqft
|
built
1986
1661 S Talbott St, Indianapolis, IN 46225
$-23
Cash flow
-0.5%
Cash-on-Cash Return
6.0%
Cap rate
0.7%
Rent to Value Ratio
Active
$549,500
9
bds
|
3
ba
|
2,810
sqft
|
built
1919
262 W Ray St, Indianapolis, IN 46225
$-124
Cash flow
-1.2%
Cash-on-Cash Return
5.9%
Cap rate
0.7%
Rent to Value Ratio
Active
$299,900
3
bds
|
2
ba
|
1,872
sqft
|
built
1920
333 Iowa St, Indianapolis, IN 46225
$-156
Cash flow
-2.7%
Cash-on-Cash Return
5.5%
Cap rate
0.7%
Rent to Value Ratio
Active
$369,000
5
bds
|
2
ba
|
2,654
sqft
|
built
1924
1242 Union St, Indianapolis, IN 46225
$-648
Cash flow
-9.2%
Cash-on-Cash Return
4.0%
Cap rate
0.5%
Rent to Value Ratio