46250 Investment Properties for Sale
Browse homes for sale and investment properties in 46250. Refine your search by price, property type, or more.
Best cash flowing properties in 46250
Active
$949,900
4
bds
|
6
ba
|
5,611
sqft
|
built
1970
4339 Royal Pine Blvd, Indianapolis, IN 46250
$543
Cash flow
3.0%
Cash-on-Cash Return
7.0%
Cap rate
0.8%
Rent to Value Ratio

Active
$189,900
2
bds
|
2
ba
|
1,142
sqft
|
built
1988
9459 Wimbledon Ct, Indianapolis, IN 46250
$-34
Cash flow
-0.9%
Cash-on-Cash Return
6.0%
Cap rate
0.9%
Rent to Value Ratio
15 out of 16 properties for sale in 46250
Limited Results Shown
Create a free account, or log in to reveal all property listings and enjoy the complete experience.
Active
$1,395,000
5
bds
|
6
ba
|
6,980
sqft
|
built
2007
4726 Ellery Ln, Indianapolis, IN 46250
$-1,963
Cash flow
-7.3%
Cash-on-Cash Return
4.6%
Cap rate
0.6%
Rent to Value Ratio

Active
$209,900
2
bds
|
2
ba
|
1,530
sqft
|
built
1984
9415 Timber View Dr, Indianapolis, IN 46250
$-254
Cash flow
-6.3%
Cash-on-Cash Return
4.8%
Cap rate
0.7%
Rent to Value Ratio

Active
$359,900
3
bds
|
2
ba
|
1,627
sqft
|
built
1960
7915 Allisonville Rd, Indianapolis, IN 46250
$-292
Cash flow
-4.2%
Cash-on-Cash Return
5.3%
Cap rate
0.6%
Rent to Value Ratio
Active
$229,900
3
bds
|
3
ba
|
1,455
sqft
|
built
1989
9477 Aberdare Dr, Indianapolis, IN 46250
$-221
Cash flow
-5.0%
Cash-on-Cash Return
5.0%
Cap rate
0.8%
Rent to Value Ratio

Active
$174,900
2
bds
|
2
ba
|
1,025
sqft
|
built
1981
6404 Bayside Ct, Indianapolis, IN 46250
$-178
Cash flow
-5.3%
Cash-on-Cash Return
5.0%
Cap rate
0.9%
Rent to Value Ratio

Active
$205,000
2
bds
|
4
ba
|
1,400
sqft
|
built
1985
6070 Southbay Dr, Indianapolis, IN 46250
$-176
Cash flow
-4.5%
Cash-on-Cash Return
5.2%
Cap rate
0.8%
Rent to Value Ratio

Active
$210,000
2
bds
|
2
ba
|
1,252
sqft
|
built
1982
6263 Behner Way, Indianapolis, IN 46250
$-223
Cash flow
-5.5%
Cash-on-Cash Return
5.0%
Cap rate
0.9%
Rent to Value Ratio

Active
$799,900
4
bds
|
5
ba
|
4,789
sqft
|
built
1997
8089 Lynch Ln, Indianapolis, IN 46250
$-1,819
Cash flow
-11.9%
Cash-on-Cash Return
3.5%
Cap rate
0.5%
Rent to Value Ratio

Active
$630,000
5
bds
|
5
ba
|
4,686
sqft
|
built
1968
5917 Camelback Ct, Indianapolis, IN 46250
$-1,564
Cash flow
-13.0%
Cash-on-Cash Return
3.3%
Cap rate
0.4%
Rent to Value Ratio
Active
$285,000
3
bds
|
3
ba
|
1,687
sqft
|
built
1976
5802 Rymark Ct, Indianapolis, IN 46250
$-84
Cash flow
-1.5%
Cash-on-Cash Return
5.8%
Cap rate
0.7%
Rent to Value Ratio
Active
$235,000
2
bds
|
3
ba
|
1,454
sqft
|
built
1985
6505 Miramar Ct, Indianapolis, IN 46250
$-270
Cash flow
-6.0%
Cash-on-Cash Return
4.9%
Cap rate
0.8%
Rent to Value Ratio

Active
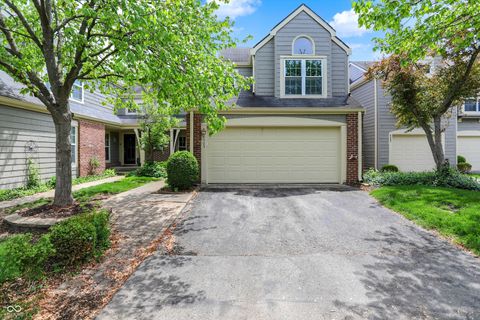
$279,900
3
bds
|
2
ba
|
1,495
sqft
|
built
1990
6564 Aintree Pl, Indianapolis, IN 46250
$-299
Cash flow
-5.6%
Cash-on-Cash Return
5.0%
Cap rate
0.6%
Rent to Value Ratio
Active
$959,000
5
bds
|
5
ba
|
5,380
sqft
|
built
2007
5202 Logan Ln, Indianapolis, IN 46250
$-2,623
Cash flow
-14.3%
Cash-on-Cash Return
3.0%
Cap rate
0.4%
Rent to Value Ratio