48103 Investment Properties for Sale
Browse homes for sale and investment properties in 48103. Refine your search by price, property type, or more.
Best cash flowing properties in 48103
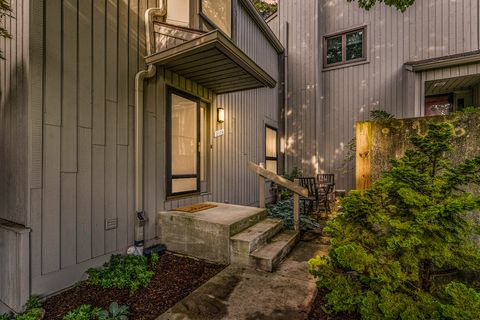
Active
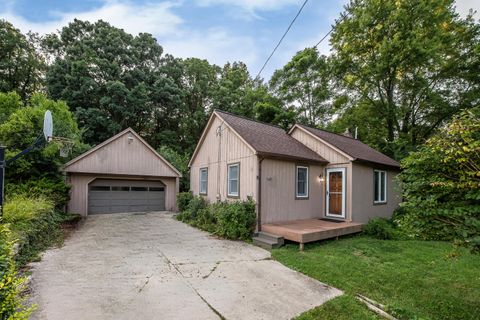
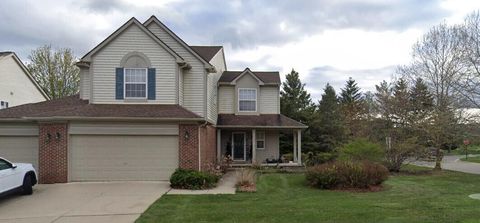
$374,900
3
bds
|
2
ba
|
1,195
sqft
|
built
1949
945 Rose Dr, Ann Arbor, MI 48103
$-447
Cash flow
-6.2%
Cash-on-Cash Return
4.7%
Cap rate
0.7%
Rent to Value Ratio
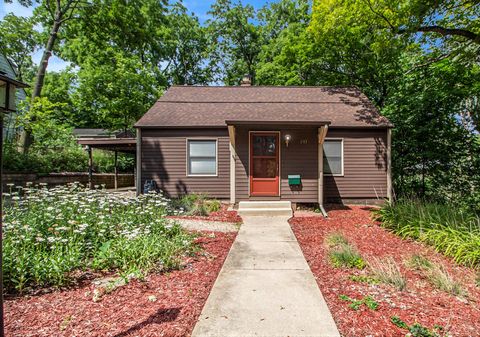
Active
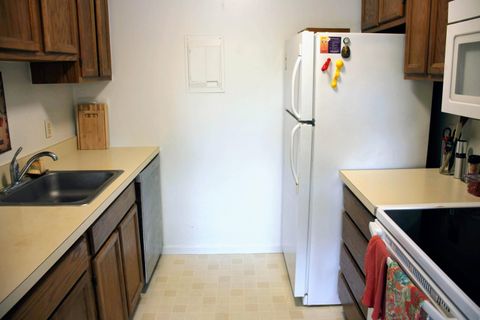
$209,900
2
bds
|
2
ba
|
1,173
sqft
|
built
1968
1265 S Maple Rd, Ann Arbor, MI 48103
$-517
Cash flow
-12.9%
Cash-on-Cash Return
3.2%
Cap rate
0.9%
Rent to Value Ratio
40 out of 48 properties for sale in 48103
Limited Results Shown
Create a free account, or log in to reveal all property listings and enjoy the complete experience.
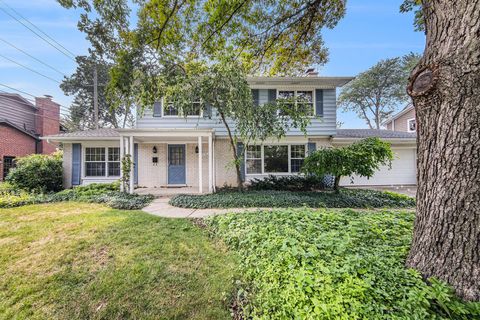
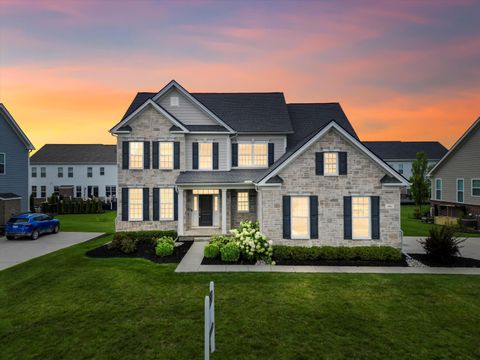
Active
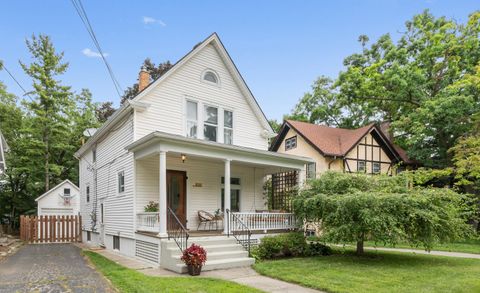
$595,000
3
bds
|
1
ba
|
1,064
sqft
|
built
1914
1022 W Liberty St, Ann Arbor, MI 48103
$-1,532
Cash flow
-13.4%
Cash-on-Cash Return
3.1%
Cap rate
0.6%
Rent to Value Ratio
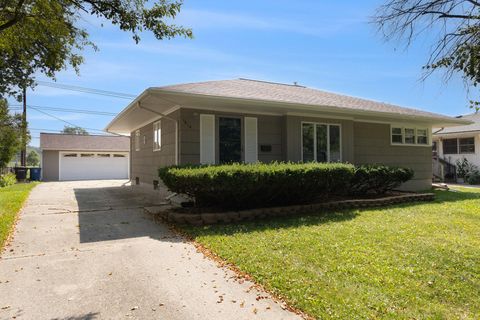
Active
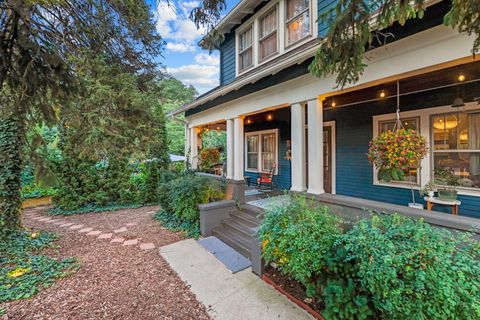
$675,000
4
bds
|
3
ba
|
1,560
sqft
|
built
1927
2509 W Liberty St, Ann Arbor, MI 48103
$-2,227
Cash flow
-17.2%
Cash-on-Cash Return
2.2%
Cap rate
0.4%
Rent to Value Ratio
Active
$1,699,000
4
bds
|
6
ba
|
8,147
sqft
|
built
2004
2086 Autumn Hill Dr, Ann Arbor, MI 48103
$-8,059
Cash flow
-24.7%
Cash-on-Cash Return
0.5%
Cap rate
0.2%
Rent to Value Ratio
Active
$600,000
3
bds
|
2
ba
|
2,060
sqft
|
built
1956
1720 Avondale Ave, Ann Arbor, MI 48103
$-1,968
Cash flow
-17.1%
Cash-on-Cash Return
2.2%
Cap rate
0.4%
Rent to Value Ratio

Active
$969,000
5
bds
|
6
ba
|
5,251
sqft
|
built
2005
2570 Andrew Thomas Trl, Ann Arbor, MI 48103
$-3,215
Cash flow
-17.3%
Cash-on-Cash Return
2.2%
Cap rate
0.4%
Rent to Value Ratio
Active
$498,000
4
bds
|
2
ba
|
2,088
sqft
|
built
1965
415 Pinewood St, Ann Arbor, MI 48103
$-1,193
Cash flow
-12.5%
Cash-on-Cash Return
3.3%
Cap rate
0.6%
Rent to Value Ratio
Active
$449,000
3
bds
|
4
ba
|
2,208
sqft
|
built
1994
2512 Jade Ct, Ann Arbor, MI 48103
$-1,357
Cash flow
-15.8%
Cash-on-Cash Return
2.5%
Cap rate
0.6%
Rent to Value Ratio

Active
$379,900
2
bds
|
3
ba
|
1,478
sqft
|
built
2017
5633 Arbor Chase Dr, Ann Arbor, MI 48103
$-742
Cash flow
-10.2%
Cash-on-Cash Return
3.8%
Cap rate
0.8%
Rent to Value Ratio
Active
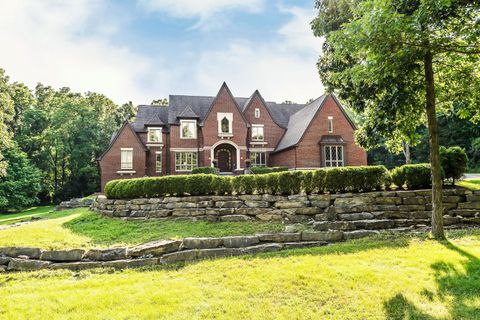
$1,995,000
4
bds
|
6
ba
|
7,170
sqft
|
built
2002
3250 Oak Hollow Dr, Ann Arbor, MI 48103
$-9,267
Cash flow
-24.2%
Cash-on-Cash Return
0.6%
Cap rate
0.2%
Rent to Value Ratio

Active
$539,900
3
bds
|
2
ba
|
1,755
sqft
|
built
1962
1342 Ardmoor Ave, Ann Arbor, MI 48103
$-1,482
Cash flow
-14.3%
Cash-on-Cash Return
2.9%
Cap rate
0.5%
Rent to Value Ratio

Active
$380,000
3
bds
|
1
ba
|
1,558
sqft
|
built
1952
1159 Pauline Blvd, Ann Arbor, MI 48103
$-637
Cash flow
-8.7%
Cash-on-Cash Return
4.1%
Cap rate
0.7%
Rent to Value Ratio
Active
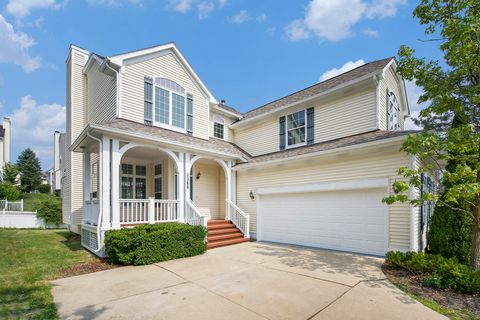
$499,900
4
bds
|
3
ba
|
1,990
sqft
|
built
2004
1366 N Bay Dr, Ann Arbor, MI 48103
$-1,305
Cash flow
-13.6%
Cash-on-Cash Return
3.0%
Cap rate
0.6%
Rent to Value Ratio
Active
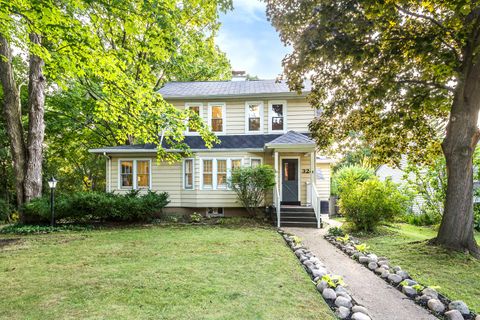
$460,000
3
bds
|
2
ba
|
1,548
sqft
|
built
1927
324 Highlake Ave, Ann Arbor, MI 48103
$-1,205
Cash flow
-13.7%
Cash-on-Cash Return
3.0%
Cap rate
0.6%
Rent to Value Ratio
Active
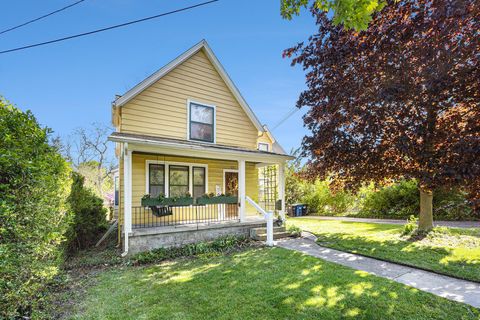
$869,000
5
bds
|
3
ba
|
2,176
sqft
|
built
1920
721 W Washington St, Ann Arbor, MI 48103
$-2,968
Cash flow
-17.8%
Cash-on-Cash Return
2.0%
Cap rate
0.4%
Rent to Value Ratio
Active
$599,999
4
bds
|
4
ba
|
3,058
sqft
|
built
2000
1929 Harley Dr, Ann Arbor, MI 48103
$-1,393
Cash flow
-12.1%
Cash-on-Cash Return
3.4%
Cap rate
0.5%
Rent to Value Ratio

Active
$174,900
1
bds
|
1
ba
|
927
sqft
|
built
1959
1235 S Maple Rd, Ann Arbor, MI 48103
$-610
Cash flow
-18.2%
Cash-on-Cash Return
2.0%
Cap rate
1.0%
Rent to Value Ratio
Active
$679,900
4
bds
|
3
ba
|
1,999
sqft
|
built
1967
2050 Delaware Dr, Ann Arbor, MI 48103
$-2,129
Cash flow
-16.3%
Cash-on-Cash Return
2.4%
Cap rate
0.5%
Rent to Value Ratio

Active
$429,900
3
bds
|
2
ba
|
1,934
sqft
|
built
1960
1049 Hasper Dr, Ann Arbor, MI 48103
$-962
Cash flow
-11.7%
Cash-on-Cash Return
3.5%
Cap rate
0.7%
Rent to Value Ratio
Active
$755,000
bds
|
0
ba
|
0
sqft
|
built
1901
508 W Summit St, Ann Arbor, MI 48103
$-3,428
Cash flow
-23.7%
Cash-on-Cash Return
0.7%
Cap rate
0.4%
Rent to Value Ratio

Active
$425,000
5
bds
|
2
ba
|
1,116
sqft
|
built
1940
520 Center Dr, Ann Arbor, MI 48103
$-1,026
Cash flow
-12.6%
Cash-on-Cash Return
3.2%
Cap rate
0.7%
Rent to Value Ratio
Active
$315,000
2
bds
|
2
ba
|
1,560
sqft
|
built
1975
2165 Pauline Ct, Ann Arbor, MI 48103
$-821
Cash flow
-13.6%
Cash-on-Cash Return
3.0%
Cap rate
0.7%
Rent to Value Ratio
Active
$445,000
3
bds
|
4
ba
|
2,366
sqft
|
built
1979
2174 Overlook Ct, Ann Arbor, MI 48103
$-1,528
Cash flow
-17.9%
Cash-on-Cash Return
2.0%
Cap rate
0.7%
Rent to Value Ratio

Active
$475,000
3
bds
|
2
ba
|
1,419
sqft
|
built
2021
560 Little Lake Dr, Ann Arbor, MI 48103
$-976
Cash flow
-10.7%
Cash-on-Cash Return
3.7%
Cap rate
0.6%
Rent to Value Ratio
Active
$395,000
2
bds
|
2
ba
|
1,270
sqft
|
built
1947
317 Doty Ave, Ann Arbor, MI 48103
$-623
Cash flow
-8.2%
Cash-on-Cash Return
4.3%
Cap rate
0.7%
Rent to Value Ratio
Active
$750,000
4
bds
|
3
ba
|
2,874
sqft
|
built
2018
406 Pineway Dr, Ann Arbor, MI 48103
$-2,105
Cash flow
-14.6%
Cash-on-Cash Return
2.8%
Cap rate
0.5%
Rent to Value Ratio

Active
$1,400,000
5
bds
|
3
ba
|
3,788
sqft
|
built
1856
4944 Scio Church Rd, Ann Arbor, MI 48103
$-4,180
Cash flow
-15.6%
Cash-on-Cash Return
2.6%
Cap rate
0.4%
Rent to Value Ratio
Active
$469,900
3
bds
|
1
ba
|
1,724
sqft
|
built
1958
1610 Saunders Cres, Ann Arbor, MI 48103
$-1,125
Cash flow
-12.5%
Cash-on-Cash Return
3.3%
Cap rate
0.5%
Rent to Value Ratio
Active
$379,000
2
bds
|
3
ba
|
1,250
sqft
|
built
2006
225 W Oakbrook Dr, Ann Arbor, MI 48103
$-1,432
Cash flow
-19.7%
Cash-on-Cash Return
1.6%
Cap rate
0.7%
Rent to Value Ratio
Active
$434,000
3
bds
|
2
ba
|
1,110
sqft
|
built
1930
501 W Mosley St, Ann Arbor, MI 48103
$-1,058
Cash flow
-12.7%
Cash-on-Cash Return
3.2%
Cap rate
0.6%
Rent to Value Ratio

Active
$679,000
3
bds
|
0
ba
|
0
sqft
|
built
1928
514 Pauline Blvd, Ann Arbor, MI 48103
$-2,443
Cash flow
-18.8%
Cash-on-Cash Return
1.8%
Cap rate
0.5%
Rent to Value Ratio
Active
$388,000
3
bds
|
2
ba
|
1,326
sqft
|
built
1961
2204 Walter Dr, Ann Arbor, MI 48103
$-564
Cash flow
-7.6%
Cash-on-Cash Return
4.4%
Cap rate
0.7%
Rent to Value Ratio
Active
$675,000
5
bds
|
3
ba
|
3,407
sqft
|
built
1976
1775 S Franklin Ct, Ann Arbor, MI 48103
$-2,204
Cash flow
-17.0%
Cash-on-Cash Return
2.2%
Cap rate
0.5%
Rent to Value Ratio
Active
$1,497,000
4
bds
|
4
ba
|
3,458
sqft
|
built
2007
4297 Upper Glade Ct, Ann Arbor, MI 48103
$-6,988
Cash flow
-24.4%
Cash-on-Cash Return
0.5%
Cap rate
0.3%
Rent to Value Ratio
Active
$550,000
4
bds
|
3
ba
|
2,441
sqft
|
built
1966
2100 W Delhi Rd, Ann Arbor, MI 48103
$-705
Cash flow
-6.7%
Cash-on-Cash Return
4.6%
Cap rate
0.7%
Rent to Value Ratio

Active
$899,900
4
bds
|
5
ba
|
2,728
sqft
|
built
1901
916 Brooks St, Ann Arbor, MI 48103
$-2,774
Cash flow
-16.1%
Cash-on-Cash Return
2.4%
Cap rate
0.4%
Rent to Value Ratio

Active
$670,000
3
bds
|
2
ba
|
2,016
sqft
|
built
1900
5255 W Ellsworth Rd, Ann Arbor, MI 48103
$-1,833
Cash flow
-14.3%
Cash-on-Cash Return
2.9%
Cap rate
0.5%
Rent to Value Ratio
Active
$2,195,000
7
bds
|
6
ba
|
6,893
sqft
|
built
2006
2865 Walters Way, Ann Arbor, MI 48103
$-8,351
Cash flow
-19.8%
Cash-on-Cash Return
1.6%
Cap rate
0.3%
Rent to Value Ratio
Active
$425,000
3
bds
|
0
ba
|
1,052
sqft
|
built
1864
717 W Liberty St, Ann Arbor, MI 48103
$-1,035
Cash flow
-12.7%
Cash-on-Cash Return
3.2%
Cap rate
0.6%
Rent to Value Ratio