48170 Investment Properties for Sale
Browse homes for sale and investment properties in 48170. Refine your search by price, property type, or more.
Best cash flowing properties in 48170

Active
$219,900
2
bds
|
1
ba
|
919
sqft
|
built
1987
221 Pinewood Cir, Plymouth, MI 48170
$-465
Cash flow
-11.0%
Cash-on-Cash Return
3.6%
Cap rate
0.8%
Rent to Value Ratio

Active
$309,000
3
bds
|
2
ba
|
1,420
sqft
|
built
1947
15601 Park Ln, Plymouth, MI 48170
$-569
Cash flow
-9.6%
Cash-on-Cash Return
3.9%
Cap rate
0.7%
Rent to Value Ratio
15 out of 16 properties for sale in 48170
Limited Results Shown
Create a free account, or log in to reveal all property listings and enjoy the complete experience.

Active
$1,399,900
4
bds
|
5
ba
|
5,999
sqft
|
built
2020
9375 N Beck Rd, Plymouth, MI 48170
$-6,575
Cash flow
-24.5%
Cash-on-Cash Return
0.5%
Cap rate
0.2%
Rent to Value Ratio
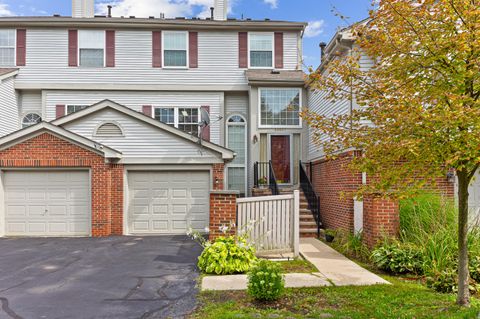
Active
$299,900
2
bds
|
4
ba
|
1,476
sqft
|
built
1994
49667 Draper Cir, Plymouth, MI 48170
$-812
Cash flow
-14.1%
Cash-on-Cash Return
2.9%
Cap rate
0.7%
Rent to Value Ratio

Active
$945,000
4
bds
|
4
ba
|
3,820
sqft
|
built
2001
4251 Fleming Way, Plymouth, MI 48170
$-3,613
Cash flow
-19.9%
Cash-on-Cash Return
1.6%
Cap rate
0.4%
Rent to Value Ratio
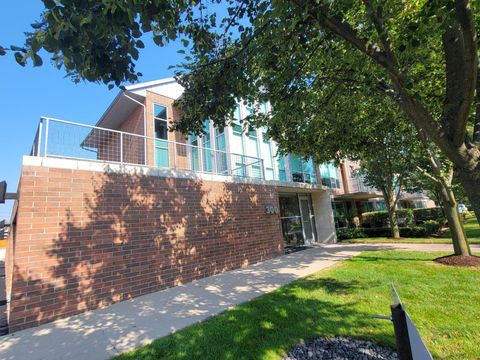
Active
$598,999
2
bds
|
2
ba
|
1,466
sqft
|
built
2006
300 Hamilton St, Plymouth, MI 48170
$-2,092
Cash flow
-18.2%
Cash-on-Cash Return
2.0%
Cap rate
0.4%
Rent to Value Ratio
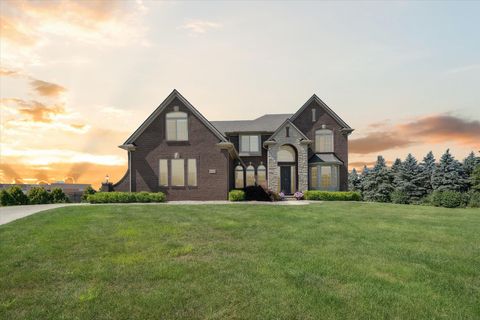
Active
$1,050,000
5
bds
|
4
ba
|
3,830
sqft
|
built
2016
48391 Sherwood Dr, Plymouth, MI 48170
$-3,106
Cash flow
-15.4%
Cash-on-Cash Return
2.6%
Cap rate
0.5%
Rent to Value Ratio
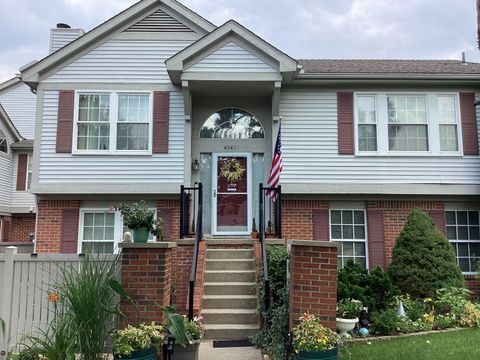
Active
$326,900
2
bds
|
3
ba
|
1,751
sqft
|
built
1993
49451 Plymouth Way, Plymouth, MI 48170
$-669
Cash flow
-10.7%
Cash-on-Cash Return
3.7%
Cap rate
0.7%
Rent to Value Ratio
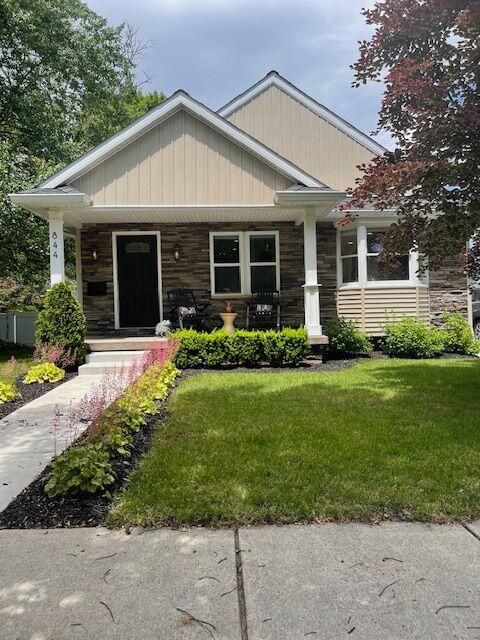
Active
$550,000
3
bds
|
2
ba
|
1,800
sqft
|
built
1941
844 Ross St, Plymouth, MI 48170
$-1,569
Cash flow
-14.9%
Cash-on-Cash Return
2.7%
Cap rate
0.6%
Rent to Value Ratio
Active
$2,950,000
3
bds
|
7
ba
|
7,650
sqft
|
built
2021
543 Deer St, Plymouth, MI 48170
$-15,350
Cash flow
-27.1%
Cash-on-Cash Return
-0.1%
Cap rate
0.1%
Rent to Value Ratio
Active
$540,000
4
bds
|
4
ba
|
2,000
sqft
|
built
2020
202 N Sydney Ct, Plymouth, MI 48170
$-1,533
Cash flow
-14.8%
Cash-on-Cash Return
2.7%
Cap rate
0.6%
Rent to Value Ratio
Active
$307,900
2
bds
|
2
ba
|
910
sqft
|
built
2005
101 S Union St, Plymouth, MI 48170
$-907
Cash flow
-15.4%
Cash-on-Cash Return
2.6%
Cap rate
0.7%
Rent to Value Ratio

Active
$699,900
5
bds
|
4
ba
|
2,724
sqft
|
built
2015
50501 Elmwood Ct, Plymouth, MI 48170
$-1,770
Cash flow
-13.2%
Cash-on-Cash Return
3.1%
Cap rate
0.6%
Rent to Value Ratio
Active
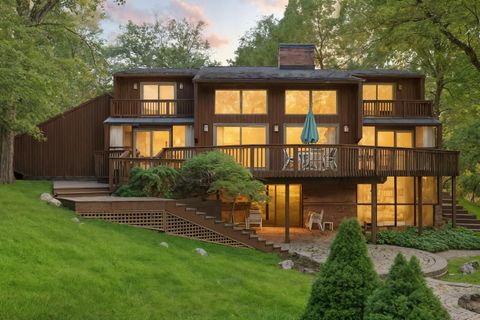
$1,050,000
3
bds
|
4
ba
|
4,455
sqft
|
built
1981
6710 Curtis Rd, Plymouth, MI 48170
$-3,418
Cash flow
-17.0%
Cash-on-Cash Return
2.2%
Cap rate
0.3%
Rent to Value Ratio
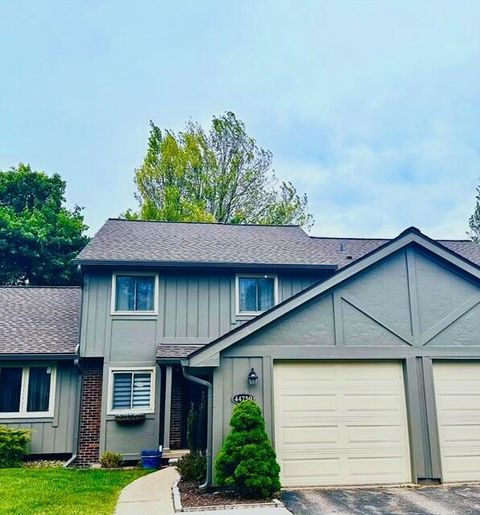
Active
$349,000
3
bds
|
3
ba
|
1,418
sqft
|
built
1977
44750 Erin Dr, Plymouth, MI 48170
$-1,105
Cash flow
-16.5%
Cash-on-Cash Return
2.3%
Cap rate
0.7%
Rent to Value Ratio