48838 Investment Properties for Sale
Browse homes for sale and investment properties in 48838. Refine your search by price, property type, or more.
Best cash flowing properties in 48838

Active
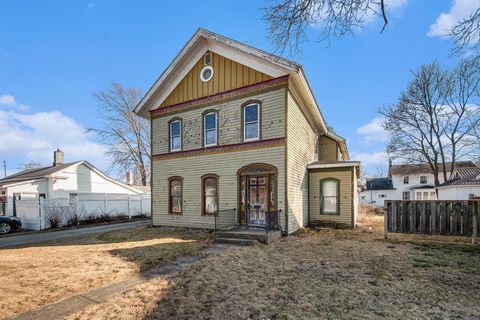
$150,000
bds
|
2
ba
|
3,694
sqft
|
built
1945
814 E Coffren St, Greenville, MI 48838
$336
Cash flow
11.7%
Cash-on-Cash Return
8.8%
Cap rate
1.1%
Rent to Value Ratio
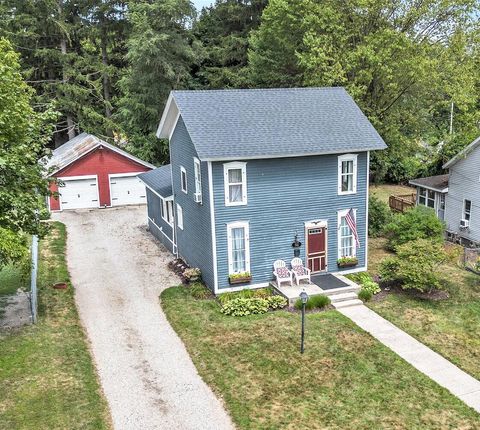
Active
$181,500
5
bds
|
2
ba
|
2,880
sqft
|
built
1947
215 W Grove St, Greenville, MI 48838
$223
Cash flow
6.4%
Cash-on-Cash Return
7.6%
Cap rate
1.1%
Rent to Value Ratio
17 out of 22 properties for sale in 48838
Limited Results Shown
Create a free account, or log in to reveal all property listings and enjoy the complete experience.
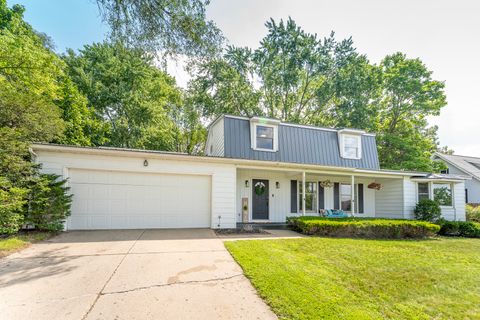
Active
$269,000
3
bds
|
2
ba
|
1,756
sqft
|
built
1876
522 W Cass St, Greenville, MI 48838
$-439
Cash flow
-8.5%
Cash-on-Cash Return
4.2%
Cap rate
0.6%
Rent to Value Ratio

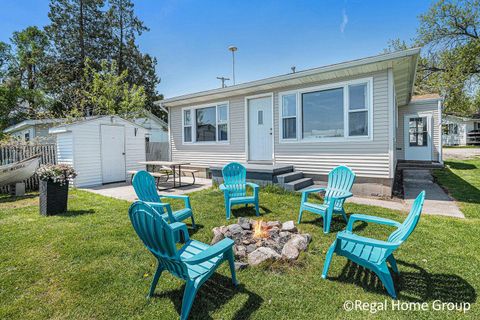
Active
$189,900
4
bds
|
1
ba
|
1,638
sqft
|
built
1910
214 W Montcalm St, Greenville, MI 48838
$94
Cash flow
2.6%
Cash-on-Cash Return
6.7%
Cap rate
0.9%
Rent to Value Ratio

Active
$299,999
5
bds
|
2
ba
|
1,800
sqft
|
built
1900
615 S Webster St, Greenville, MI 48838
$-569
Cash flow
-9.9%
Cash-on-Cash Return
3.9%
Cap rate
0.6%
Rent to Value Ratio

Active
$160,000
2
bds
|
1
ba
|
1,338
sqft
|
built
1900
111 E Union St, Greenville, MI 48838
$6
Cash flow
0.2%
Cash-on-Cash Return
6.2%
Cap rate
0.9%
Rent to Value Ratio
Active
$315,000
4
bds
|
2
ba
|
2,391
sqft
|
built
1967
212 S Hillcrest St, Greenville, MI 48838
$-3,407
Cash flow
-56.4%
Cash-on-Cash Return
-6.8%
Cap rate
0.8%
Rent to Value Ratio
Active
$274,900
3
bds
|
1
ba
|
988
sqft
|
built
1963
271 Pine Dr, Greenville, MI 48838
$-345
Cash flow
-6.5%
Cash-on-Cash Return
4.6%
Cap rate
0.7%
Rent to Value Ratio

Active
$975,000
4
bds
|
4
ba
|
3,085
sqft
|
built
2007
11725 Wabasis Lake Dr NE, Greenville, MI 48838
$-3,729
Cash flow
-20.0%
Cash-on-Cash Return
1.6%
Cap rate
0.3%
Rent to Value Ratio

Active
$795,000
4
bds
|
3
ba
|
3,000
sqft
|
built
2006
12199 Hart St NE, Greenville, MI 48838
$-2,662
Cash flow
-17.5%
Cash-on-Cash Return
2.1%
Cap rate
0.3%
Rent to Value Ratio

Active
$775,000
4
bds
|
4
ba
|
3,874
sqft
|
built
2006
10245 Lincoln Lake Rd NE, Greenville, MI 48838
$-2,488
Cash flow
-16.7%
Cash-on-Cash Return
2.3%
Cap rate
0.4%
Rent to Value Ratio
Active
$264,900
2
bds
|
2
ba
|
1,491
sqft
|
built
1966
800 E Judd St, Greenville, MI 48838
$-273
Cash flow
-5.4%
Cash-on-Cash Return
4.9%
Cap rate
0.7%
Rent to Value Ratio

Active
$510,000
4
bds
|
2
ba
|
2,134
sqft
|
built
1910
651 W Baldwin Lake Dr, Greenville, MI 48838
$-1,286
Cash flow
-13.2%
Cash-on-Cash Return
3.1%
Cap rate
0.6%
Rent to Value Ratio

Active
$299,900
3
bds
|
2
ba
|
1,468
sqft
|
built
1947
11737 W Carson City Rd, Greenville, MI 48838
$-359
Cash flow
-6.2%
Cash-on-Cash Return
4.7%
Cap rate
0.7%
Rent to Value Ratio

Active
$390,000
4
bds
|
3
ba
|
2,460
sqft
|
built
2016
1453 Trailview Dr, Greenville, MI 48838
$-945
Cash flow
-12.6%
Cash-on-Cash Return
3.2%
Cap rate
0.6%
Rent to Value Ratio
Active
$2,200,000
4
bds
|
2
ba
|
2,116
sqft
|
built
1970
12375 Overlook Dr NE, Greenville, MI 48838
$-10,052
Cash flow
-23.8%
Cash-on-Cash Return
0.7%
Cap rate
0.1%
Rent to Value Ratio
Active
$110,000
1
bds
|
1
ba
|
392
sqft
|
built
1974
771 Sunny Trl, Greenville, MI 48838
$109
Cash flow
5.2%
Cash-on-Cash Return
7.3%
Cap rate
1.0%
Rent to Value Ratio