49203 Investment Properties for Sale
Browse homes for sale and investment properties in 49203. Refine your search by price, property type, or more.
Best cash flowing properties in 49203
Active
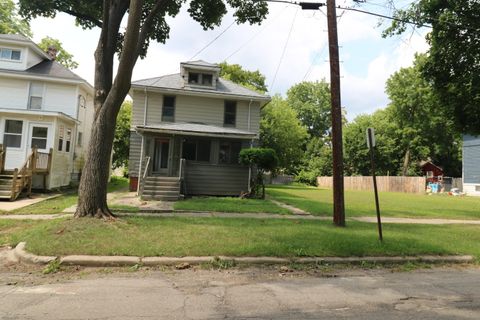
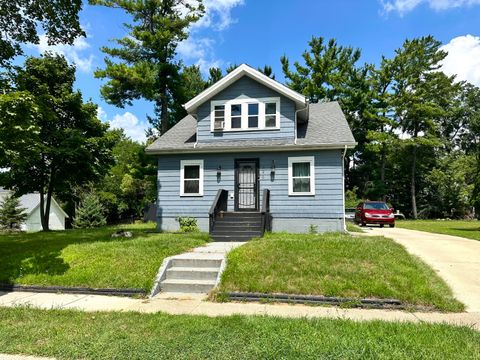
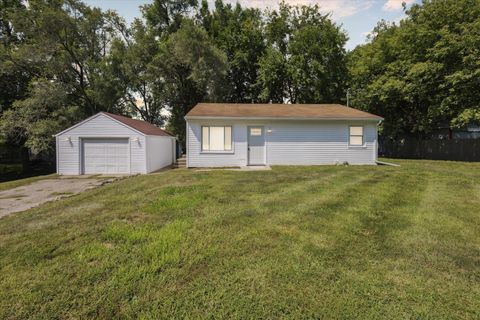
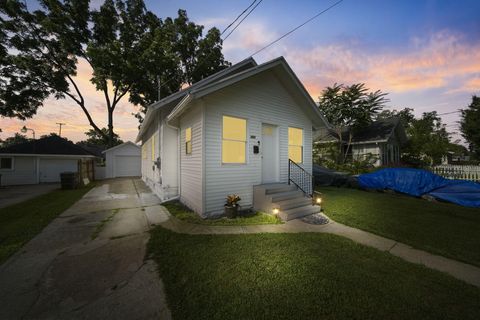
$45,000
4
bds
|
3
ba
|
1,688
sqft
|
built
1900
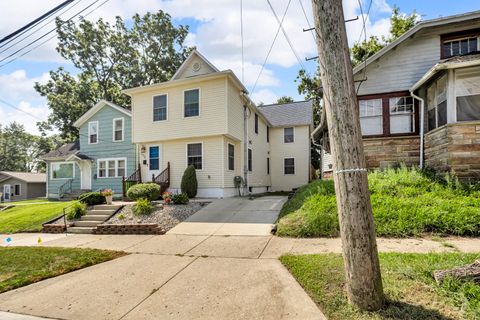
1014 Woodbridge St, Jackson, MI 49203
$941
Cash flow
24.4%
Cash-on-Cash Return
25.1%
Cap rate
3.6%
Rent to Value Ratio
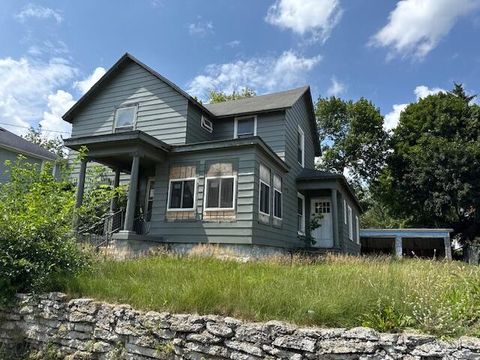
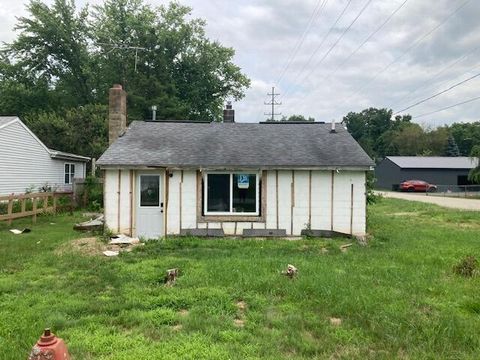
Active
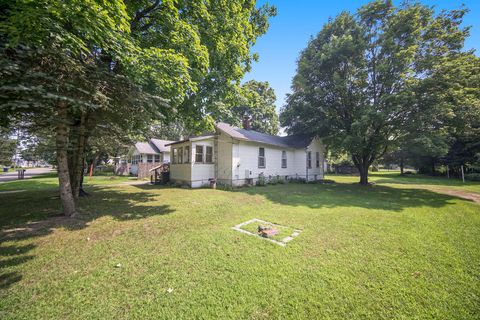
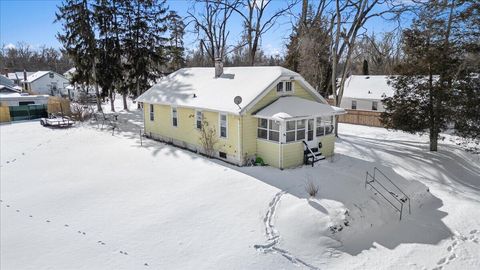
$37,500
3
bds
|
0
ba
|
0
sqft
|
built
1920
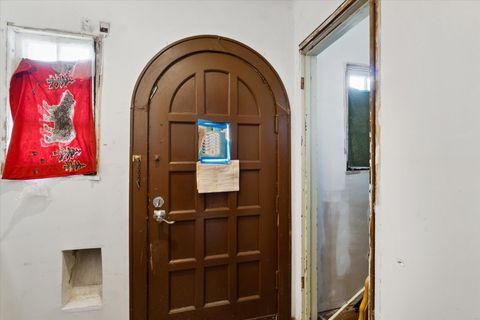
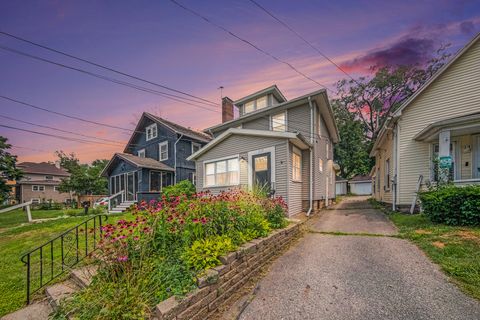
1026 Carl Breeding Way, Jackson, MI 49203
$854
Cash flow
26.5%
Cash-on-Cash Return
27.3%
Cap rate
4.3%
Rent to Value Ratio
61 out of 69 properties for sale in 49203
Limited Results Shown
Create a free account, or log in to reveal all property listings and enjoy the complete experience.
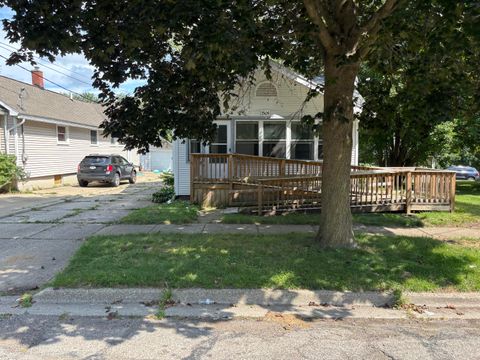
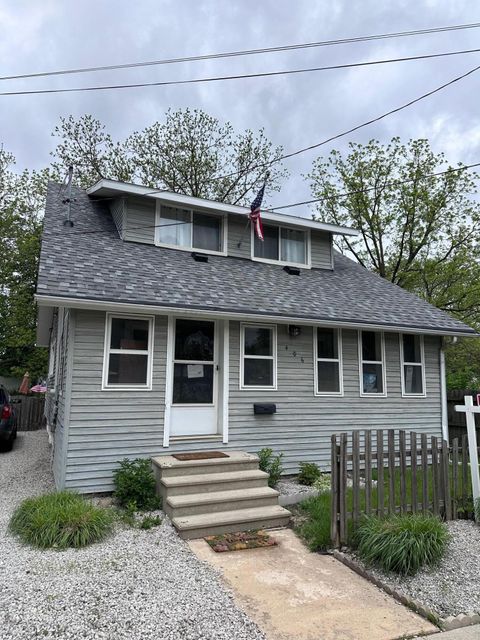
Active
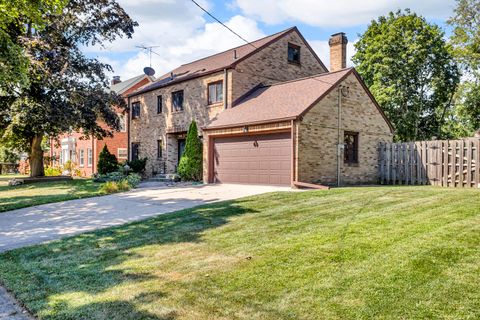
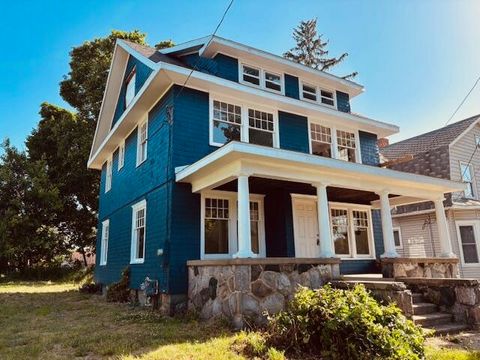
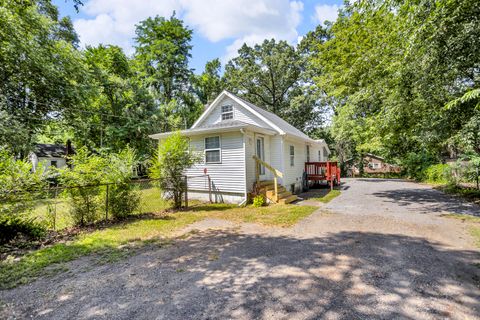
$119,900
2
bds
|
1
ba
|
886
sqft
|
built
1920
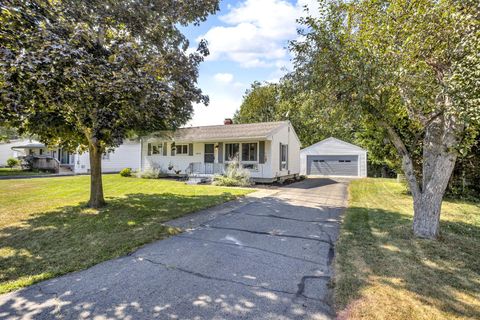
1309 Woodbridge St, Jackson, MI 49203
$139
Cash flow
6.0%
Cash-on-Cash Return
7.5%
Cap rate
1.0%
Rent to Value Ratio
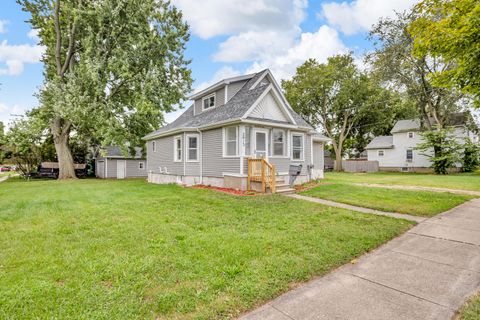
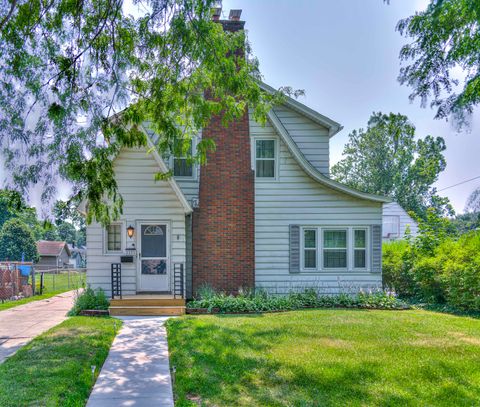
Active
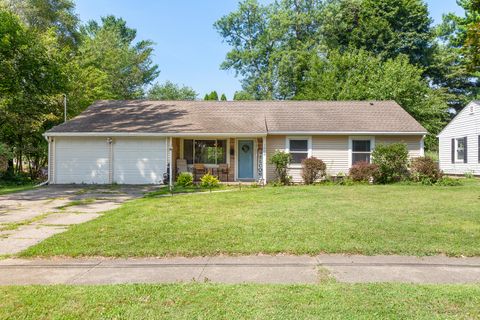
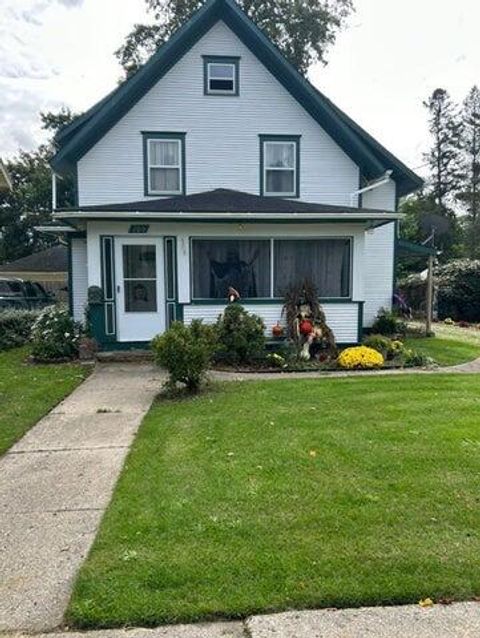
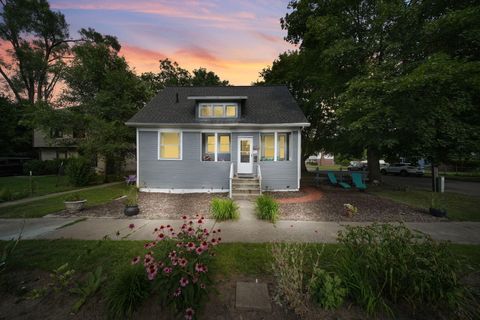
$189,000
3
bds
|
2
ba
|
1,402
sqft
|
built
1930
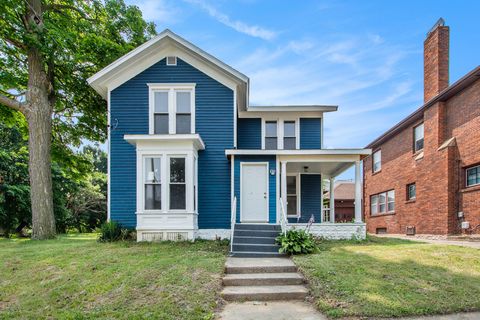
2013 Tyson St, Jackson, MI 49203
$-402
Cash flow
-11.1%
Cash-on-Cash Return
3.6%
Cap rate
0.7%
Rent to Value Ratio

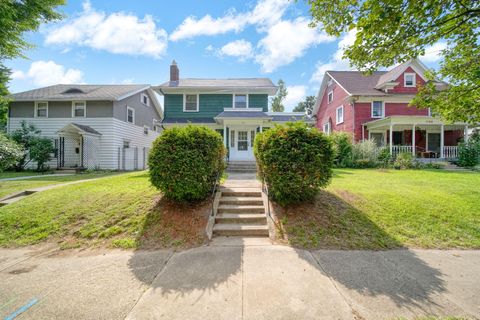
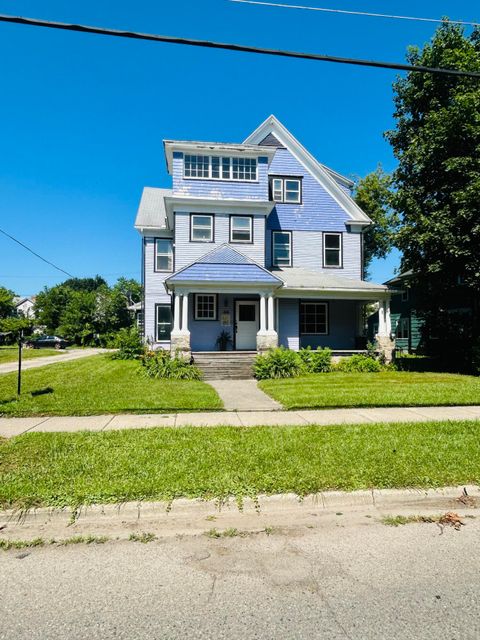
Active
$199,900
4
bds
|
1
ba
|
1,321
sqft
|
built
1920
508 6th St, Jackson, MI 49203
$-33
Cash flow
-0.9%
Cash-on-Cash Return
5.9%
Cap rate
0.8%
Rent to Value Ratio
Active
$189,900
3
bds
|
0
ba
|
0
sqft
|
built
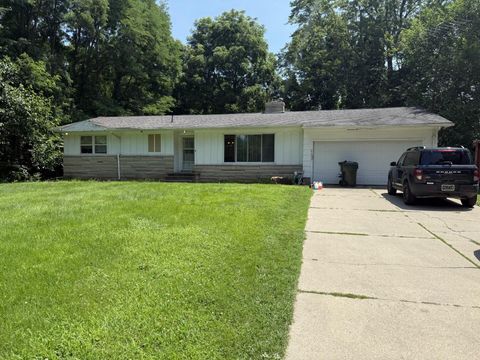
1957
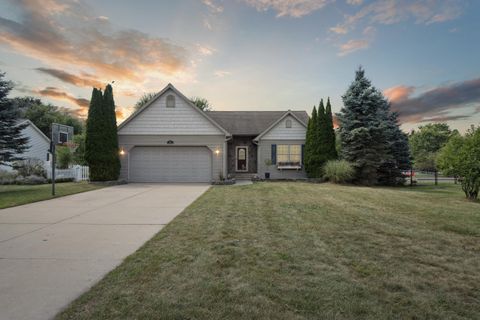
780 Brighton Rd, Jackson, MI 49203
$-61
Cash flow
-1.7%
Cash-on-Cash Return
5.8%
Cap rate
0.9%
Rent to Value Ratio

Active
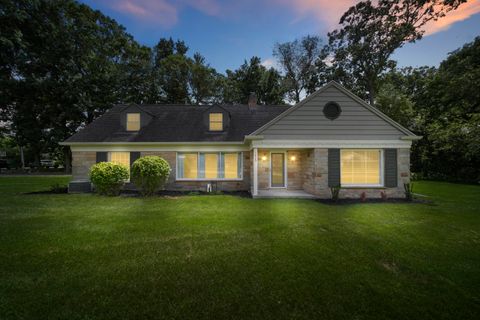
$319,900
3
bds
|
3
ba
|
2,590
sqft
|
built
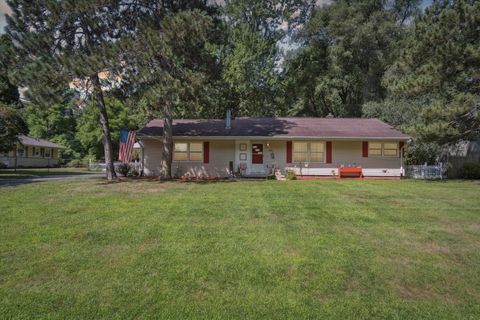
1965
941 Halstead Blvd, Jackson, MI 49203
$-371
Cash flow
-6.1%
Cash-on-Cash Return
4.8%
Cap rate
0.7%
Rent to Value Ratio
Active
$134,900
5
bds
|
1
ba
|
1,582
sqft
|
built
1910
226 E High St, Jackson, MI 49203
$99
Cash flow
3.8%
Cash-on-Cash Return
7.0%
Cap rate
1.0%
Rent to Value Ratio
Active
$330,000
5
bds
|
3
ba
|
2,688
sqft
|
built
1945
512 S Wisner St, Jackson, MI 49203
$-591
Cash flow
-9.3%
Cash-on-Cash Return
4.0%
Cap rate
0.7%
Rent to Value Ratio
Active
$235,000
3
bds
|
2
ba
|
1,566
sqft
|
built
1940
1008 S Higby St, Jackson, MI 49203
$-258
Cash flow
-5.7%
Cash-on-Cash Return
4.8%
Cap rate
0.8%
Rent to Value Ratio

Active
$189,999
bds
|
0
ba
|
0
sqft
|
built
1923
1000 S West Ave, Jackson, MI 49203
$15
Cash flow
0.4%
Cash-on-Cash Return
6.2%
Cap rate
0.9%
Rent to Value Ratio
Active
$174,900
4
bds
|
2
ba
|
1,999
sqft
|
built
1900
105 Mitchell St, Jackson, MI 49203
$-5
Cash flow
-0.1%
Cash-on-Cash Return
6.1%
Cap rate
0.9%
Rent to Value Ratio
Active
$77,000
3
bds
|
1
ba
|
2,126
sqft
|
built
1925
1045 S West Ave, Jackson, MI 49203
$556
Cash flow
37.7%
Cash-on-Cash Return
14.8%
Cap rate
2.1%
Rent to Value Ratio
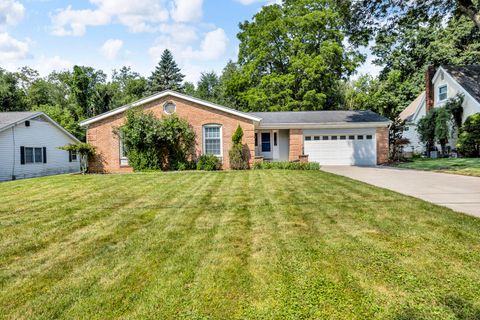
Active
$209,000
3
bds
|
1
ba
|
1,424
sqft
|
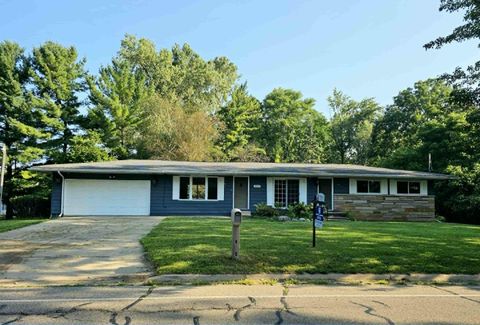
built
1954
3635 Roosevelt Cir, Jackson, MI 49203
$-174
Cash flow
-4.3%
Cash-on-Cash Return
5.2%
Cap rate
0.7%
Rent to Value Ratio
Active
$159,999
4
bds
|
2
ba
|
1,930
sqft
|
built
1920
504 2nd St, Jackson, MI 49203
$234
Cash flow
7.6%
Cash-on-Cash Return
7.9%
Cap rate
1.0%
Rent to Value Ratio
Active
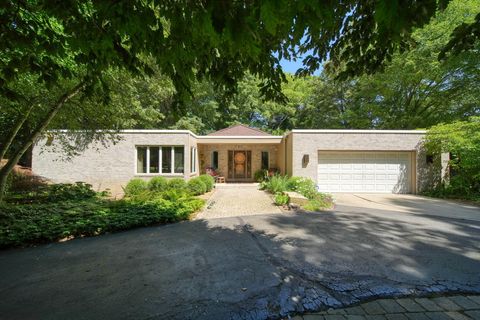
$215,000
4
bds
|
1
ba
|
2,240
sqft
|
built
1954
4246 Huntington Dr, Jackson, MI 49203
$6
Cash flow
0.1%
Cash-on-Cash Return
6.2%
Cap rate
0.8%
Rent to Value Ratio
Active
$139,900
3
bds
|
1
ba
|
1,341
sqft
|
built
1962
3201 S Meridian Rd, Jackson, MI 49203
$219
Cash flow
8.2%
Cash-on-Cash Return
8.0%
Cap rate
1.1%
Rent to Value Ratio
Active
$209,900
3
bds
|
2
ba
|
2,256
sqft
|
built
1972
212 E South St, Jackson, MI 49203
$23
Cash flow
0.6%
Cash-on-Cash Return
6.3%
Cap rate
0.9%
Rent to Value Ratio
Active
$85,000
4
bds
|
3
ba
|
2,160
sqft
|
built
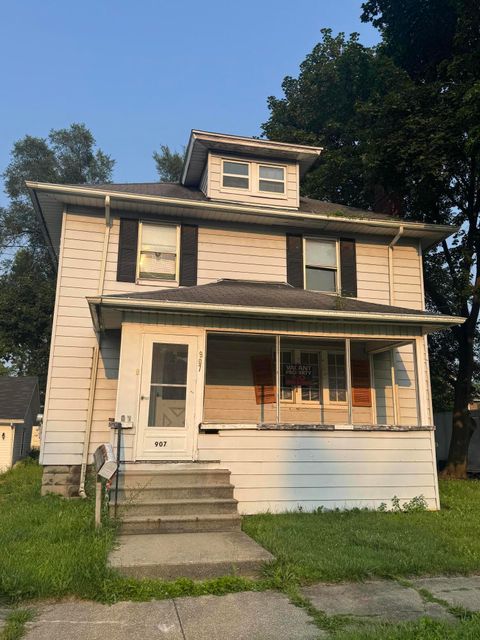
1925
907 3rd St, Jackson, MI 49203
$406
Cash flow
24.9%
Cash-on-Cash Return
11.9%
Cap rate
1.6%
Rent to Value Ratio
Active
$449,900
6
bds
|
3
ba
|
4,802
sqft
|
built
2006
4014 Kingston Ct, Jackson, MI 49203
$-1,238
Cash flow
-14.4%
Cash-on-Cash Return
2.8%
Cap rate
0.5%
Rent to Value Ratio
Active
$160,000
3
bds
|
1
ba
|
1,180
sqft
|
built
1916
113 S Webster St, Jackson, MI 49203
$87
Cash flow
2.8%
Cash-on-Cash Return
6.8%
Cap rate
1.0%
Rent to Value Ratio
Active
$194,900
4
bds
|
1
ba
|
1,130
sqft
|
built
1949
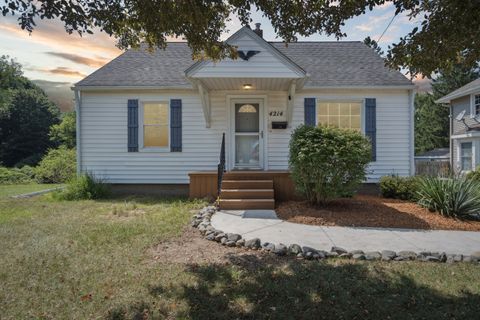
4214 Francis St, Jackson, MI 49203
$-110
Cash flow
-2.9%
Cash-on-Cash Return
5.5%
Cap rate
0.7%
Rent to Value Ratio
Active
$259,900
4
bds
|
2
ba
|
1,922
sqft
|
built
1956
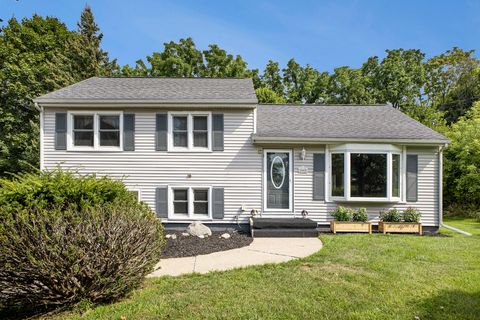
2005 Cascade Dr, Jackson, MI 49203
$-391
Cash flow
-7.8%
Cash-on-Cash Return
4.3%
Cap rate
0.7%
Rent to Value Ratio
Active
$180,000
3
bds
|
1
ba
|
1,150
sqft
|
built
1952
906 Floyd Ave, Jackson, MI 49203
$-54
Cash flow
-1.6%
Cash-on-Cash Return
5.8%
Cap rate
0.8%
Rent to Value Ratio
Active
$122,000
3
bds
|
1
ba
|
968
sqft
|
built
1940
2405 Crest Ave, Jackson, MI 49203
$245
Cash flow
10.5%
Cash-on-Cash Return
8.6%
Cap rate
1.1%
Rent to Value Ratio

Active
$134,900
3
bds
|
1
ba
|
1,532
sqft
|
built
1928
804 17th St, Jackson, MI 49203
$131
Cash flow
5.1%
Cash-on-Cash Return
7.3%
Cap rate
1.0%
Rent to Value Ratio
Active
$77,500
4
bds
|
2
ba
|
2,393
sqft
|
built
1890
328 W Mason St, Jackson, MI 49203
$578
Cash flow
38.9%
Cash-on-Cash Return
15.1%
Cap rate
2.1%
Rent to Value Ratio
Active
$164,900
3
bds
|
1
ba
|
1,152
sqft
|
built
1910
709 Griswold St, Jackson, MI 49203
$124
Cash flow
3.9%
Cash-on-Cash Return
7.1%
Cap rate
1.0%
Rent to Value Ratio
Active
$120,000
2
bds
|
1
ba
|
904
sqft
|
built
1930
151 W Euclid Ave, Jackson, MI 49203
$26
Cash flow
1.1%
Cash-on-Cash Return
6.4%
Cap rate
0.9%
Rent to Value Ratio
Active
$65,000
3
bds
|
1
ba
|
1,066
sqft
|
built
1920
337 E Addison St, Jackson, MI 49203
$733
Cash flow
13.1%
Cash-on-Cash Return
13.5%
Cap rate
2.2%
Rent to Value Ratio
Active
$179,900
2
bds
|
1
ba
|
888
sqft
|
built
1930
698 S Dettman Rd, Jackson, MI 49203
$-90
Cash flow
-2.6%
Cash-on-Cash Return
5.5%
Cap rate
0.7%
Rent to Value Ratio
Active
$121,900
3
bds
|
2
ba
|
1,292
sqft
|
built
1900
1717 Carl Breeding Way, Jackson, MI 49203
$138
Cash flow
5.9%
Cash-on-Cash Return
7.5%
Cap rate
1.1%
Rent to Value Ratio
Active
$439,900
4
bds
|
4
ba
|
3,134
sqft
|
built
1950
1829 Probert Rd, Jackson, MI 49203
$-938
Cash flow
-11.1%
Cash-on-Cash Return
3.6%
Cap rate
0.6%
Rent to Value Ratio
Active
$475,000
4
bds
|
5
ba
|
3,589
sqft
|
built
1972
1360 Kathmar Dr, Jackson, MI 49203
$-1,162
Cash flow
-12.8%
Cash-on-Cash Return
3.2%
Cap rate
0.6%
Rent to Value Ratio
Active
$190,000
4
bds
|
2
ba
|
2,233
sqft
|
built
1910
1112 1st St, Jackson, MI 49203
$224
Cash flow
6.2%
Cash-on-Cash Return
7.6%
Cap rate
1.1%
Rent to Value Ratio
Active
$278,000
3
bds
|
2
ba
|
1,639
sqft
|
built
1964
2144 Creglow Dr, Jackson, MI 49203
$-354
Cash flow
-6.6%
Cash-on-Cash Return
4.6%
Cap rate
0.7%
Rent to Value Ratio
Active
$40,000
2
bds
|
1
ba
|
864
sqft
|
built
1940
121 Bagg Ave, Jackson, MI 49203
$797
Cash flow
23.2%
Cash-on-Cash Return
23.9%
Cap rate
3.3%
Rent to Value Ratio
Active
$159,000
3
bds
|
2
ba
|
1,296
sqft
|
built
1920
406 S Elm Ave, Jackson, MI 49203
$70
Cash flow
2.3%
Cash-on-Cash Return
6.7%
Cap rate
0.9%
Rent to Value Ratio
Active
$224,900
3
bds
|
2
ba
|
1,519
sqft
|
built
1930
1111 Elmwood Ave, Jackson, MI 49203
$-220
Cash flow
-5.1%
Cash-on-Cash Return
5.0%
Cap rate
0.8%
Rent to Value Ratio
Active
$270,000
8
bds
|
4
ba
|
6,000
sqft
|
built
1920
514 1st St, Jackson, MI 49203
$-471
Cash flow
-9.1%
Cash-on-Cash Return
4.1%
Cap rate
0.7%
Rent to Value Ratio