49525 Investment Properties for Sale
Browse homes for sale and investment properties in 49525. Refine your search by price, property type, or more.
Best cash flowing properties in 49525

Active
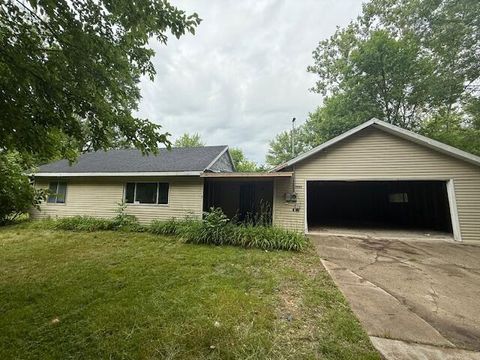
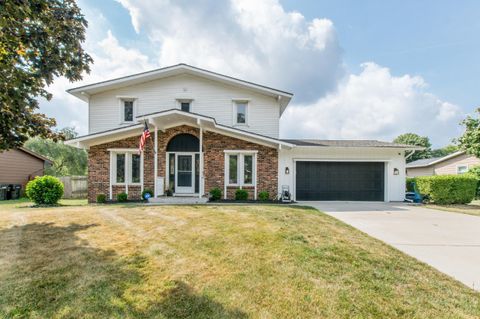
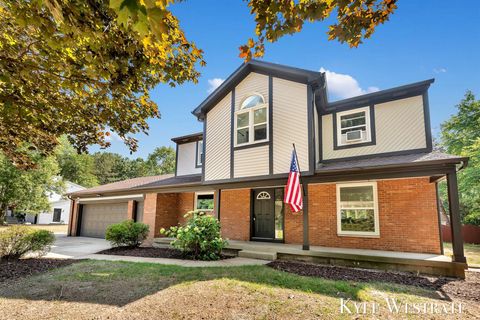
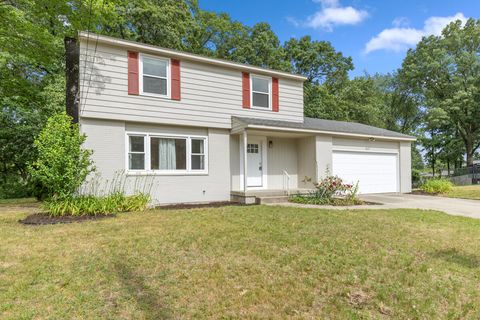
$217,000
3
bds
|
1
ba
|
1,668
sqft
|
built
1958
4042 Hillsdale Ave NE, Grand Rapids, MI 49525
$104
Cash flow
2.5%
Cash-on-Cash Return
6.7%
Cap rate
0.9%
Rent to Value Ratio
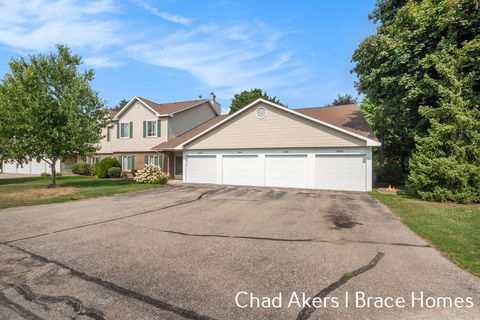
Active
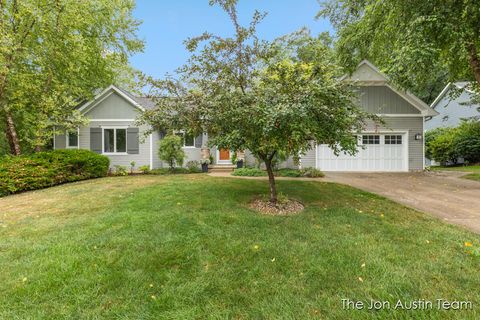
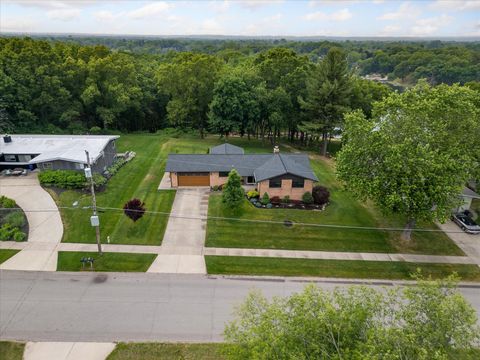
$149,900
3
bds
|
1
ba
|
1,424
sqft
|
built
1973
3903 Willow Dr NE, Grand Rapids, MI 49525
$70
Cash flow
2.4%
Cash-on-Cash Return
6.7%
Cap rate
1.1%
Rent to Value Ratio
36 out of 40 properties for sale in 49525
Limited Results Shown
Create a free account, or log in to reveal all property listings and enjoy the complete experience.
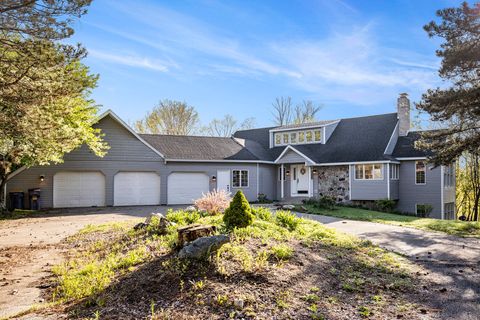
Active
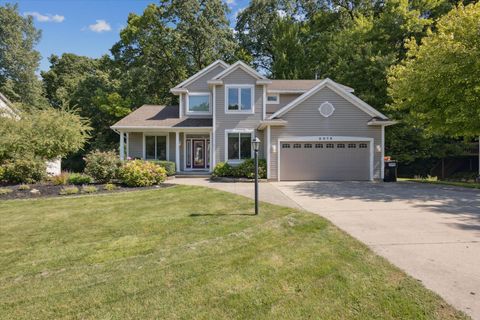
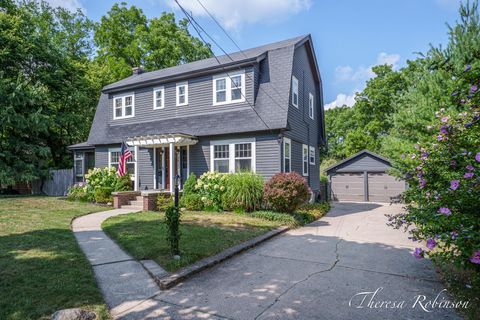
$575,000
4
bds
|
4
ba
|
3,180
sqft
|
built
1996
2279 Waterford Way NE, Grand Rapids, MI 49525
$-1,649
Cash flow
-15.0%
Cash-on-Cash Return
2.7%
Cap rate
0.6%
Rent to Value Ratio
Active
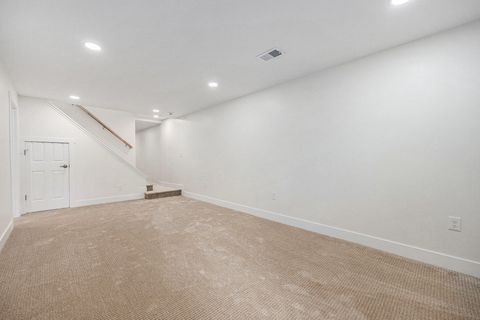
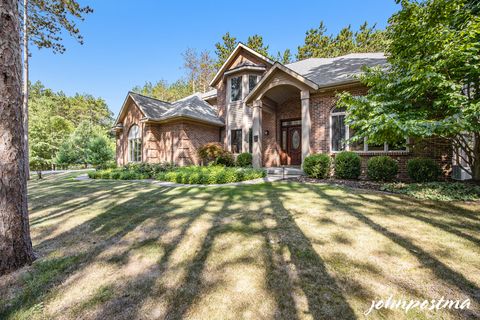
$515,000
4
bds
|
4
ba
|
2,196
sqft
|
built
1994
3750 Benjamin Ave NE, Grand Rapids, MI 49525
$-1,806
Cash flow
-18.3%
Cash-on-Cash Return
1.9%
Cap rate
0.3%
Rent to Value Ratio

Active
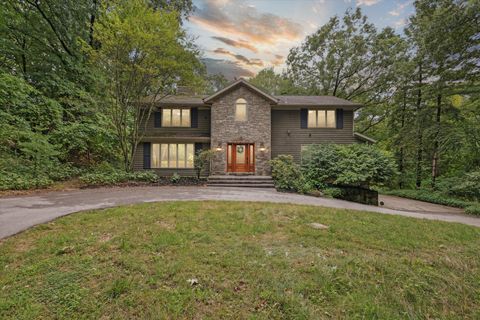
$469,900
3
bds
|
3
ba
|
2,599
sqft
|
built
1991
2921 Bird Ave NE, Grand Rapids, MI 49525
$-778
Cash flow
-8.6%
Cash-on-Cash Return
4.2%
Cap rate
0.6%
Rent to Value Ratio

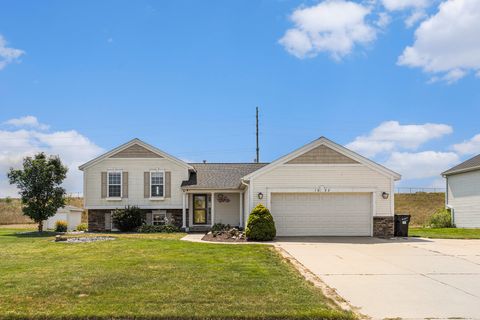
Active
$429,000
3
bds
|
2
ba
|
2,904
sqft
|
built
1976
4847 Ridgeline Dr NE, Grand Rapids, MI 49525
$-840
Cash flow
-10.2%
Cash-on-Cash Return
3.8%
Cap rate
0.6%
Rent to Value Ratio

Active
$795,000
4
bds
|
3
ba
|
2,693
sqft
|
built
2015
4307 Maybeck Dr NE, Grand Rapids, MI 49525
$-3,320
Cash flow
-21.8%
Cash-on-Cash Return
1.1%
Cap rate
0.4%
Rent to Value Ratio

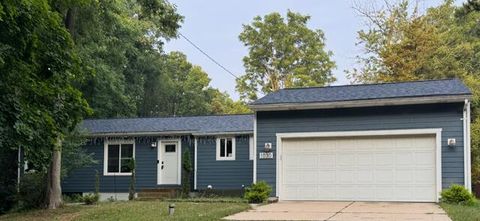
Active
$299,900
3
bds
|
2
ba
|
1,005
sqft
|
built
1948
2958 Dean Lake Ave NE, Grand Rapids, MI 49525
$-305
Cash flow
-5.3%
Cash-on-Cash Return
4.9%
Cap rate
0.7%
Rent to Value Ratio
Active
$750,000
5
bds
|
4
ba
|
4,737
sqft
|
built
1988
3530 Wild Rose Ln NE, Grand Rapids, MI 49525
$-1,487
Cash flow
-10.3%
Cash-on-Cash Return
3.8%
Cap rate
0.6%
Rent to Value Ratio
Active
$415,000
3
bds
|
3
ba
|
2,079
sqft
|
built
1975
3050 Winesap Dr NE, Grand Rapids, MI 49525
$-792
Cash flow
-10.0%
Cash-on-Cash Return
3.9%
Cap rate
0.6%
Rent to Value Ratio
Active
$599,000
3
bds
|
4
ba
|
2,384
sqft
|
built
2006
4808 Firefly Dr NE, Grand Rapids, MI 49525
$-1,798
Cash flow
-15.7%
Cash-on-Cash Return
2.5%
Cap rate
0.4%
Rent to Value Ratio
Active
$429,900
3
bds
|
2
ba
|
1,584
sqft
|
built
1925
3423 Coit Ave NE, Grand Rapids, MI 49525
$-647
Cash flow
-7.9%
Cash-on-Cash Return
4.3%
Cap rate
0.7%
Rent to Value Ratio
Active
$735,000
4
bds
|
5
ba
|
3,491
sqft
|
built
1996
3523 Bluewater Pines Dr NE, Grand Rapids, MI 49525
$-2,092
Cash flow
-14.9%
Cash-on-Cash Return
2.7%
Cap rate
0.5%
Rent to Value Ratio

Active
$1,150,000
5
bds
|
5
ba
|
3,289
sqft
|
built
2008
2479 Shears Crossing Ct NE, Grand Rapids, MI 49525
$-4,114
Cash flow
-18.7%
Cash-on-Cash Return
1.9%
Cap rate
0.3%
Rent to Value Ratio
Active
$499,900
4
bds
|
3
ba
|
2,952
sqft
|
built
1961
3416 Assumption Dr NE, Grand Rapids, MI 49525
$-1,018
Cash flow
-10.6%
Cash-on-Cash Return
3.7%
Cap rate
0.6%
Rent to Value Ratio

Active
$409,000
3
bds
|
2
ba
|
1,610
sqft
|
built
1948
3632 Knapp St NE, Grand Rapids, MI 49525
$-1,101
Cash flow
-14.0%
Cash-on-Cash Return
2.9%
Cap rate
0.5%
Rent to Value Ratio

Active
$1,250,000
3
bds
|
3
ba
|
2,481
sqft
|
built
1998
3705 Grand River Dr NE, Grand Rapids, MI 49525
$-4,728
Cash flow
-19.7%
Cash-on-Cash Return
1.6%
Cap rate
0.3%
Rent to Value Ratio

Active
$1,450,000
5
bds
|
5
ba
|
4,324
sqft
|
built
2013
3757 Lake Birch St NE, Grand Rapids, MI 49525
$-4,180
Cash flow
-15.0%
Cash-on-Cash Return
2.7%
Cap rate
0.4%
Rent to Value Ratio
Active
$265,000
3
bds
|
2
ba
|
1,209
sqft
|
built
1989
3100 Windcrest Ct NE, Grand Rapids, MI 49525
$-521
Cash flow
-10.3%
Cash-on-Cash Return
3.8%
Cap rate
0.9%
Rent to Value Ratio
Active
$379,900
3
bds
|
3
ba
|
1,866
sqft
|
built
1959
1030 4 Mile Rd NE, Grand Rapids, MI 49525
$-335
Cash flow
-4.6%
Cash-on-Cash Return
5.1%
Cap rate
0.7%
Rent to Value Ratio
Active
$398,000
4
bds
|
2
ba
|
1,706
sqft
|
built
2004
1688 Rahn Dr NE, Grand Rapids, MI 49525
$-780
Cash flow
-10.2%
Cash-on-Cash Return
3.8%
Cap rate
0.6%
Rent to Value Ratio

Active
$779,900
5
bds
|
3
ba
|
3,454
sqft
|
built
2003
4470 Oak Arbor NE, Grand Rapids, MI 49525
$-2,534
Cash flow
-17.0%
Cash-on-Cash Return
2.2%
Cap rate
0.5%
Rent to Value Ratio

Active
$499,900
3
bds
|
4
ba
|
2,812
sqft
|
built
2004
1692 Roaming Ct NE, Grand Rapids, MI 49525
$-1,194
Cash flow
-12.5%
Cash-on-Cash Return
3.3%
Cap rate
0.5%
Rent to Value Ratio
Active
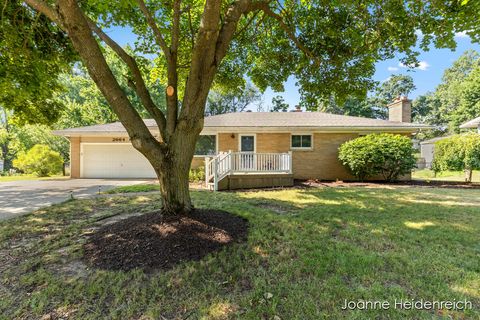
$369,000
3
bds
|
2
ba
|
1,950
sqft
|
built
1966
2664 Pinesboro Dr NE, Grand Rapids, MI 49525
$-440
Cash flow
-6.2%
Cash-on-Cash Return
4.7%
Cap rate
0.7%
Rent to Value Ratio
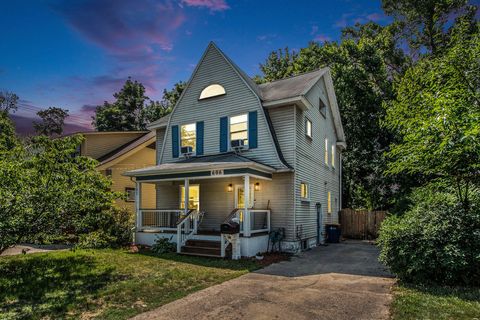
Active
$264,900
3
bds
|
2
ba
|
1,994
sqft
|
built
1920
606 N Park St NE, Grand Rapids, MI 49525
$-3
Cash flow
-0.1%
Cash-on-Cash Return
6.1%
Cap rate
0.8%
Rent to Value Ratio
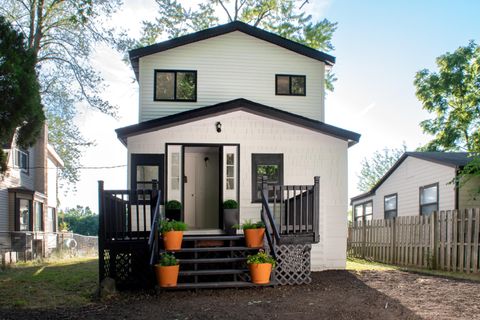
Active
$285,000
3
bds
|
2
ba
|
1,512
sqft
|
built
1910
3785 Willow Dr NE, Grand Rapids, MI 49525
$-245
Cash flow
-4.5%
Cash-on-Cash Return
5.1%
Cap rate
0.7%
Rent to Value Ratio

Active
$675,000
5
bds
|
4
ba
|
4,984
sqft
|
built
1979
2650 Oldepointe Dr NE, Grand Rapids, MI 49525
$-1,674
Cash flow
-12.9%
Cash-on-Cash Return
3.2%
Cap rate
0.5%
Rent to Value Ratio
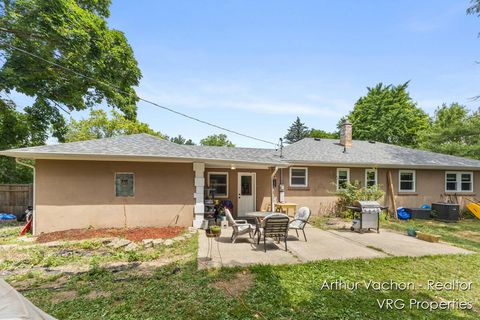
Active
$349,900
3
bds
|
2
ba
|
2,001
sqft
|
built
1952
3330 Bradford St NE, Grand Rapids, MI 49525
$-565
Cash flow
-8.4%
Cash-on-Cash Return
4.2%
Cap rate
0.6%
Rent to Value Ratio

Active
$849,900
6
bds
|
4
ba
|
3,679
sqft
|
built
2005
3440 Monterey Hills Dr NE, Grand Rapids, MI 49525
$-2,358
Cash flow
-14.5%
Cash-on-Cash Return
2.8%
Cap rate
0.5%
Rent to Value Ratio
Active
$299,900
2
bds
|
2
ba
|
1,332
sqft
|
built
2018
2005 Celadon Dr NE, Grand Rapids, MI 49525
$-476
Cash flow
-8.3%
Cash-on-Cash Return
4.2%
Cap rate
0.8%
Rent to Value Ratio
Active
$899,000
3
bds
|
2
ba
|
1,500
sqft
|
built
1964
2647 Manitoba Ct NE, Grand Rapids, MI 49525
$-3,199
Cash flow
-18.6%
Cash-on-Cash Return
1.9%
Cap rate
0.3%
Rent to Value Ratio
Active
$799,900
4
bds
|
3
ba
|
2,283
sqft
|
built
1966
3801 Keeweenaw Dr NE, Grand Rapids, MI 49525
$-2,607
Cash flow
-17.0%
Cash-on-Cash Return
2.2%
Cap rate
0.4%
Rent to Value Ratio

Active
$474,900
4
bds
|
2
ba
|
2,275
sqft
|
built
1925
3544 Briggs Blvd NE, Grand Rapids, MI 49525
$-965
Cash flow
-10.6%
Cash-on-Cash Return
3.7%
Cap rate
0.5%
Rent to Value Ratio

Active
$429,900
3
bds
|
2
ba
|
1,837
sqft
|
built
1931
4372 Hunsberger Ave NE, Grand Rapids, MI 49525
$-667
Cash flow
-8.1%
Cash-on-Cash Return
4.3%
Cap rate
0.6%
Rent to Value Ratio
Active
$475,000
3
bds
|
2
ba
|
3,291
sqft
|
built
1983
620 Twin Lakes Dr NE, Grand Rapids, MI 49525
$-1,163
Cash flow
-12.8%
Cash-on-Cash Return
3.2%
Cap rate
0.6%
Rent to Value Ratio
Active
$699,000
3
bds
|
3
ba
|
4,324
sqft
|
built
1953
1710 Kreft St NE, Grand Rapids, MI 49525
$-200
Cash flow
-1.5%
Cash-on-Cash Return
5.8%
Cap rate
0.7%
Rent to Value Ratio