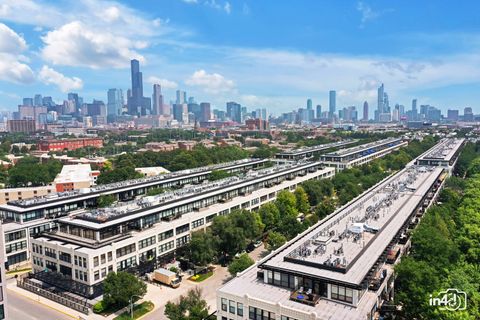
60608 Investment Properties for Sale
Browse homes for sale and investment properties in 60608. Refine your search by price, property type, or more.
Best cash flowing properties in 60608
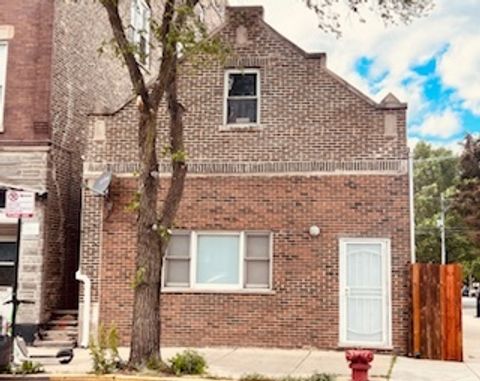
Active
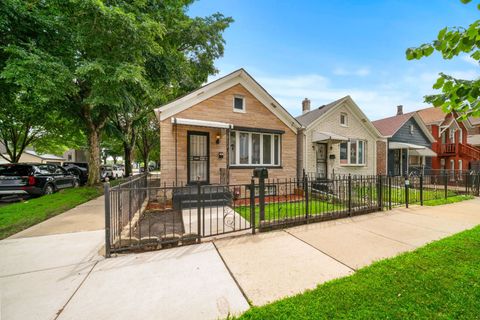
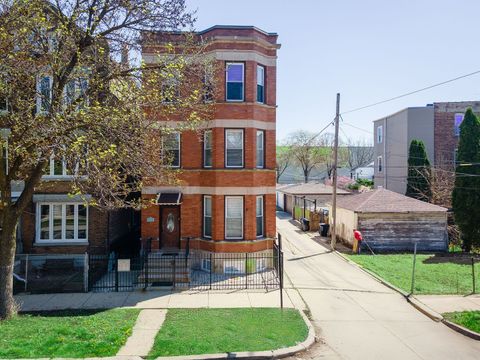
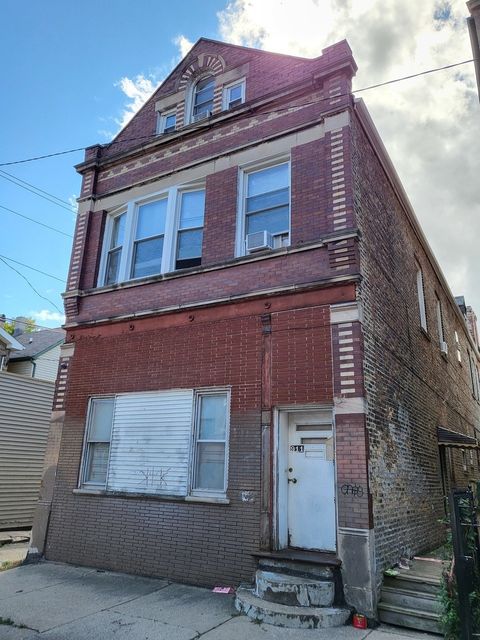
$369,000
2
bds
|
2
ba
|
0
sqft
|
built
1887
3301 S Hamilton Ave, Chicago, IL 60608
$-176
Cash flow
-2.5%
Cash-on-Cash Return
5.1%
Cap rate
0.7%
Rent to Value Ratio
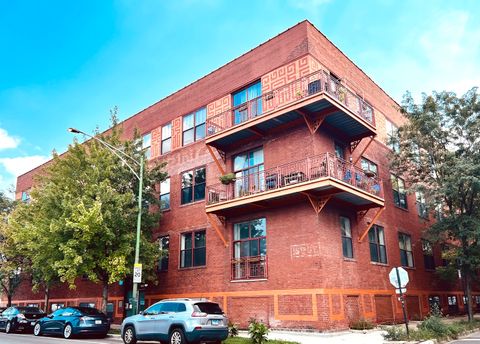
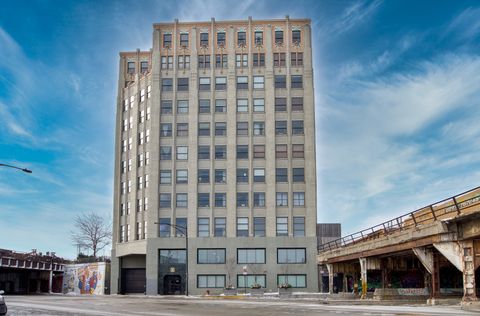
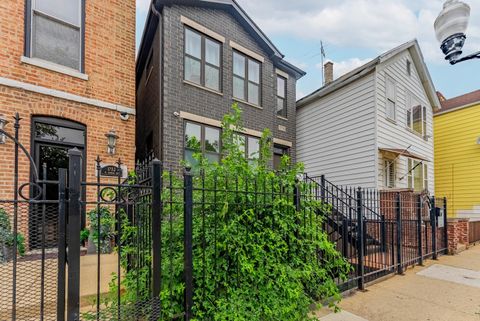
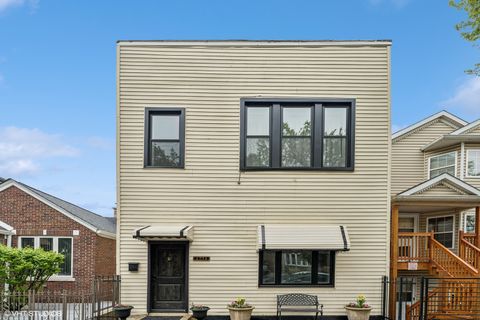
Active
$229,000
1
bds
|
1
ba
|
0
sqft
|
built
2005
1061 W 16th St, Chicago, IL 60608
$-351
Cash flow
-8.0%
Cash-on-Cash Return
3.8%
Cap rate
0.8%
Rent to Value Ratio
46 out of 55 properties for sale in 60608
Limited Results Shown
Create a free account, or log in to reveal all property listings and enjoy the complete experience.
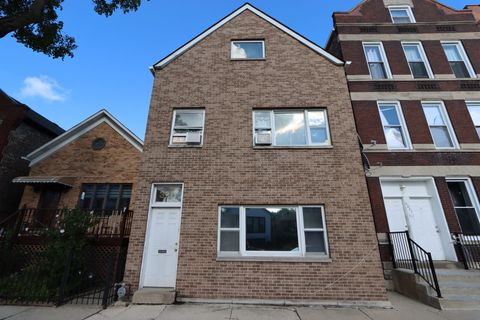
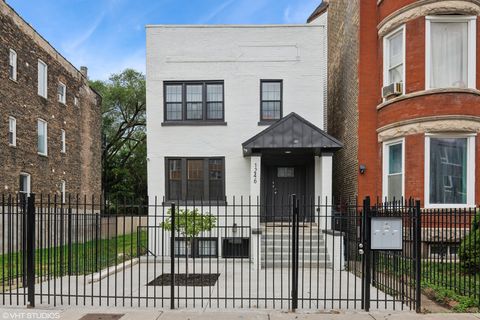
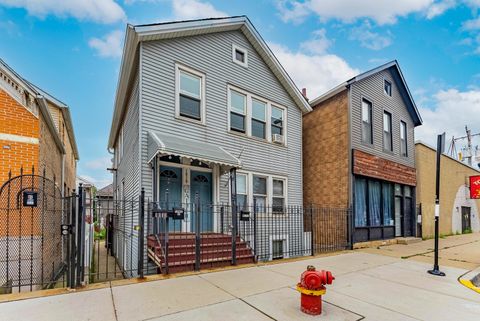
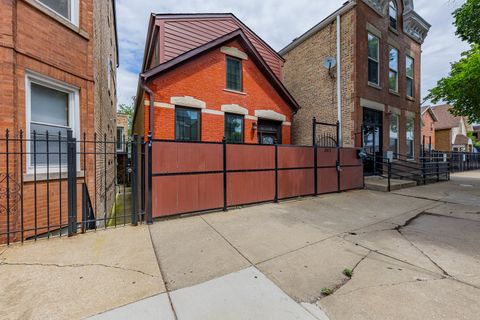
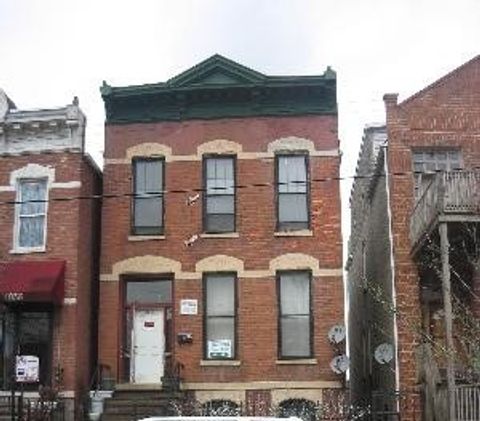
Active
$599,000
6
bds
|
3
ba
|
0
sqft
|
built
1888
3217 S May St, Chicago, IL 60608
$-1,690
Cash flow
-14.7%
Cash-on-Cash Return
2.3%
Cap rate
0.4%
Rent to Value Ratio
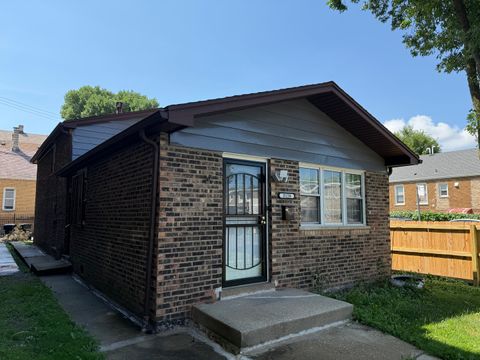
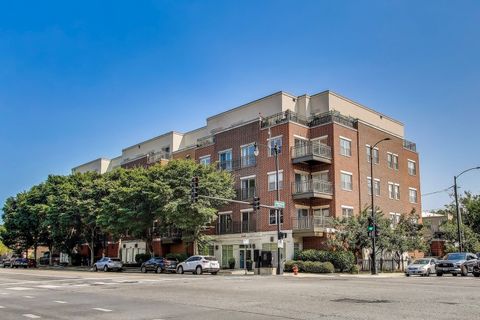
Active
$485,000
3
bds
|
2
ba
|
1,412
sqft
|
built
1972
3128 S Lituanica Ave, Chicago, IL 60608
$-1,165
Cash flow
-12.5%
Cash-on-Cash Return
2.8%
Cap rate
0.5%
Rent to Value Ratio
Active
$650,000
6
bds
|
4
ba
|
0
sqft
|
built
1899
1643 S Fairfield Ave, Chicago, IL 60608
$-1,341
Cash flow
-10.8%
Cash-on-Cash Return
3.2%
Cap rate
0.4%
Rent to Value Ratio
Active
$235,000
1
bds
|
1
ba
|
785
sqft
|
built
1927
1550 S Blue Island Ave, Chicago, IL 60608
$-586
Cash flow
-13.0%
Cash-on-Cash Return
2.7%
Cap rate
0.9%
Rent to Value Ratio
Active
$799,000
9
bds
|
6
ba
|
0
sqft
|
built
1893
1246 S Fairfield Ave, Chicago, IL 60608
$-2,658
Cash flow
-17.4%
Cash-on-Cash Return
1.7%
Cap rate
0.3%
Rent to Value Ratio
Active
$500,000
3
bds
|
2
ba
|
1,439
sqft
|
built
2006
1155 W Roosevelt Rd, Chicago, IL 60608
$-1,472
Cash flow
-15.4%
Cash-on-Cash Return
2.1%
Cap rate
0.6%
Rent to Value Ratio
Active
$244,900
2
bds
|
1
ba
|
0
sqft
|
built
1927
1550 S Blue Island Ave, Chicago, IL 60608
$-647
Cash flow
-13.8%
Cash-on-Cash Return
2.5%
Cap rate
1.0%
Rent to Value Ratio
Active
$1,175,000
6
bds
|
6
ba
|
0
sqft
|
built
2007
1836 S Carpenter St, Chicago, IL 60608
$-3,713
Cash flow
-16.5%
Cash-on-Cash Return
1.9%
Cap rate
0.3%
Rent to Value Ratio
Active
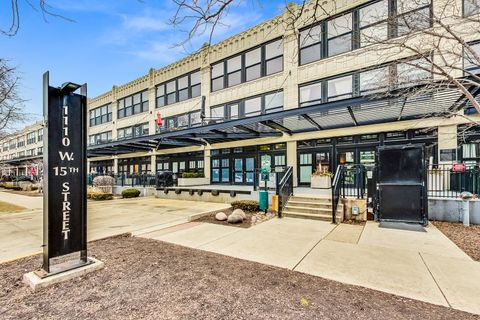
$379,900
2
bds
|
2
ba
|
1,036
sqft
|
built
2007
1111 W 15th St, Chicago, IL 60608
$-944
Cash flow
-13.0%
Cash-on-Cash Return
2.7%
Cap rate
0.7%
Rent to Value Ratio
Active
$274,999
1
bds
|
1
ba
|
817
sqft
|
built
1920
1151 W 14th Pl, Chicago, IL 60608
$-503
Cash flow
-9.5%
Cash-on-Cash Return
3.5%
Cap rate
0.8%
Rent to Value Ratio
Active
$320,000
2
bds
|
2
ba
|
0
sqft
|
built
1919
1150 W 15th St, Chicago, IL 60608
$-571
Cash flow
-9.3%
Cash-on-Cash Return
3.5%
Cap rate
0.9%
Rent to Value Ratio
Active
$628,000
8
bds
|
4
ba
|
0
sqft
|
built
1898
911 W 32nd St, Chicago, IL 60608
$-2,056
Cash flow
-17.1%
Cash-on-Cash Return
1.8%
Cap rate
0.4%
Rent to Value Ratio
Active
$1,054,999
9
bds
|
6
ba
|
0
sqft
|
built
2018
1750 W Cermak Rd, Chicago, IL 60608
$-4,552
Cash flow
-22.5%
Cash-on-Cash Return
0.5%
Cap rate
0.2%
Rent to Value Ratio
Active
$864,999
6
bds
|
4
ba
|
0
sqft
|
built
1885
1019 W 18th St, Chicago, IL 60608
$-3,023
Cash flow
-18.2%
Cash-on-Cash Return
1.5%
Cap rate
0.3%
Rent to Value Ratio
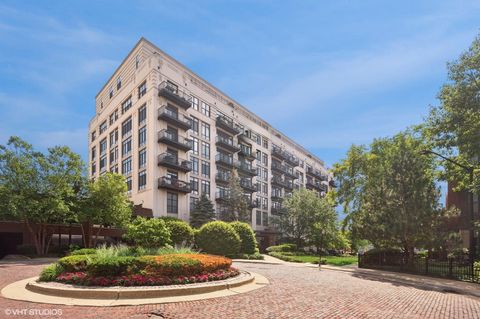
Active
$425,000
2
bds
|
2
ba
|
1,217
sqft
|
built
1919
1070 W 15th St, Chicago, IL 60608
$-939
Cash flow
-11.5%
Cash-on-Cash Return
3.0%
Cap rate
0.8%
Rent to Value Ratio
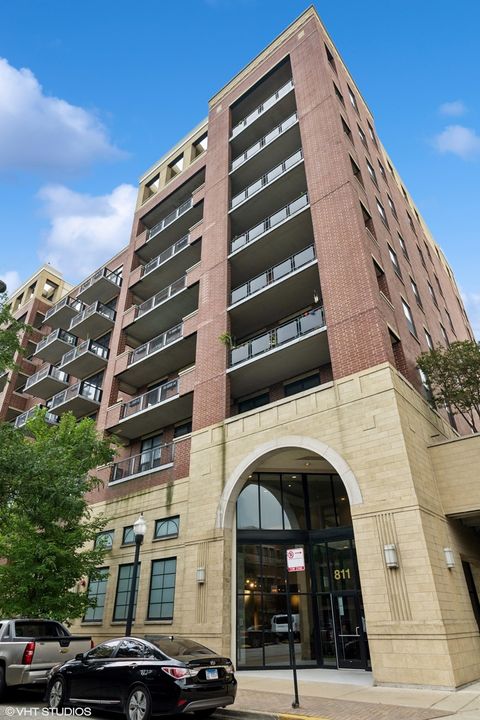
Active
$235,000
1
bds
|
1
ba
|
700
sqft
|
built
2003
811 W 15th Pl, Chicago, IL 60608
$-380
Cash flow
-8.4%
Cash-on-Cash Return
3.7%
Cap rate
0.8%
Rent to Value Ratio
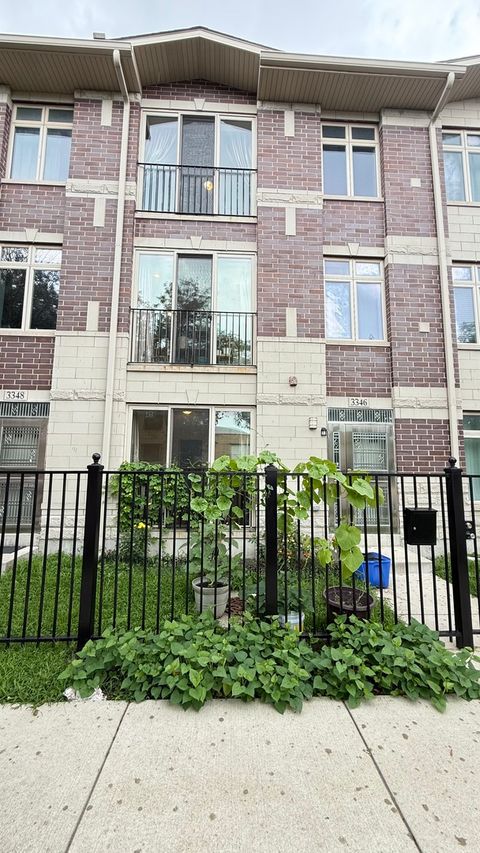
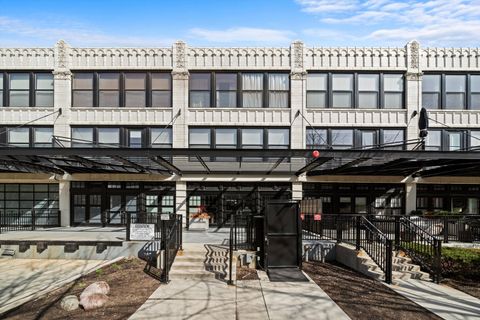
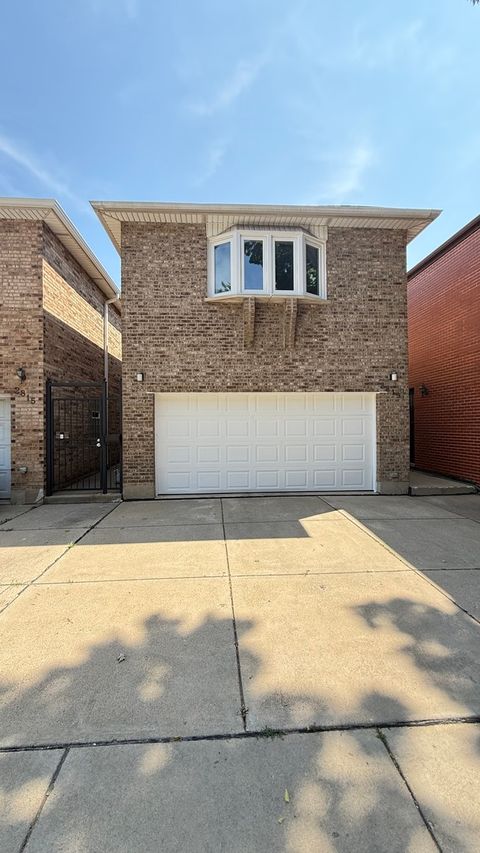
Active
$530,000
4
bds
|
4
ba
|
2,300
sqft
|
built
2018
3346 S Justine St, Chicago, IL 60608
$-425
Cash flow
-4.2%
Cash-on-Cash Return
4.7%
Cap rate
0.8%
Rent to Value Ratio

Active
$300,000
2
bds
|
2
ba
|
1,100
sqft
|
built
2007
3450 S Halsted St, Chicago, IL 60608
$-745
Cash flow
-13.0%
Cash-on-Cash Return
2.7%
Cap rate
0.8%
Rent to Value Ratio
Active
$679,000
6
bds
|
4
ba
|
0
sqft
|
built
1883
2713 S Crowell St, Chicago, IL 60608
$-1,879
Cash flow
-14.4%
Cash-on-Cash Return
2.4%
Cap rate
0.4%
Rent to Value Ratio
Active
$689,900
3
bds
|
4
ba
|
3,000
sqft
|
built
1893
2012 W Coulter St, Chicago, IL 60608
$-2,120
Cash flow
-16.0%
Cash-on-Cash Return
2.0%
Cap rate
0.4%
Rent to Value Ratio
Active
$534,900
2
bds
|
2
ba
|
1,550
sqft
|
built
2003
1524 S Sangamon St, Chicago, IL 60608
$-2,348
Cash flow
-22.9%
Cash-on-Cash Return
0.4%
Cap rate
0.6%
Rent to Value Ratio
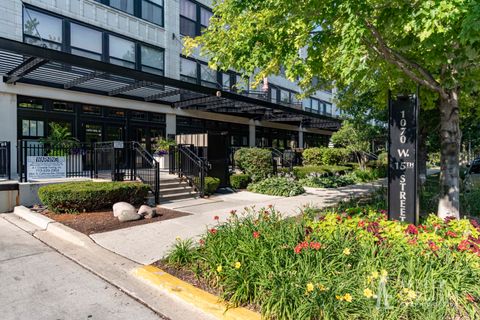
Active
$474,999
3
bds
|
2
ba
|
1,650
sqft
|
built
1924
1070 W 15th St, Chicago, IL 60608
$-1,130
Cash flow
-12.4%
Cash-on-Cash Return
2.8%
Cap rate
0.7%
Rent to Value Ratio
Active
$645,000
3
bds
|
3
ba
|
0
sqft
|
built
1990
2819 S Quinn St, Chicago, IL 60608
$-1,148
Cash flow
-9.3%
Cash-on-Cash Return
3.5%
Cap rate
0.5%
Rent to Value Ratio
Active
$334,999
2
bds
|
2
ba
|
1,200
sqft
|
built
2003
1525 S Sangamon St, Chicago, IL 60608
$-778
Cash flow
-12.1%
Cash-on-Cash Return
2.9%
Cap rate
0.8%
Rent to Value Ratio
Active
$325,000
3
bds
|
2
ba
|
0
sqft
|
built
1888
3338 S Bell Ave, Chicago, IL 60608
$-908
Cash flow
-14.6%
Cash-on-Cash Return
2.3%
Cap rate
0.4%
Rent to Value Ratio
Active
$430,000
3
bds
|
2
ba
|
1,033
sqft
|
built
1966
2327 W 21st St, Chicago, IL 60608
$-875
Cash flow
-10.6%
Cash-on-Cash Return
3.2%
Cap rate
0.6%
Rent to Value Ratio
Active
$910,000
3
bds
|
4
ba
|
2,884
sqft
|
built
2003
909 W Village Ct, Chicago, IL 60608
$-2,620
Cash flow
-15.0%
Cash-on-Cash Return
2.2%
Cap rate
0.6%
Rent to Value Ratio
Active
$399,999
8
bds
|
4
ba
|
0
sqft
|
built
1920
1044 W 34th Pl, Chicago, IL 60608
$-1,008
Cash flow
-13.1%
Cash-on-Cash Return
2.7%
Cap rate
0.6%
Rent to Value Ratio
Active
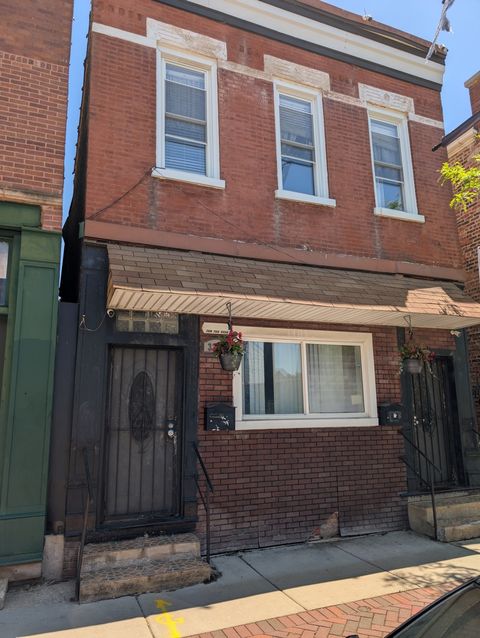
$375,000
2
bds
|
2
ba
|
1,226
sqft
|
built
1925
1110 W 15th St, Chicago, IL 60608
$-1,282
Cash flow
-17.8%
Cash-on-Cash Return
1.6%
Cap rate
0.7%
Rent to Value Ratio
Active
$395,000
9
bds
|
4
ba
|
0
sqft
|
built
1889
2227 W 21st St, Chicago, IL 60608
$-1,170
Cash flow
-15.5%
Cash-on-Cash Return
2.1%
Cap rate
0.6%
Rent to Value Ratio
Active
$499,500
4
bds
|
4
ba
|
0
sqft
|
built
1888
3233 S Morgan St, Chicago, IL 60608
$-1,603
Cash flow
-16.7%
Cash-on-Cash Return
1.8%
Cap rate
0.5%
Rent to Value Ratio
Active
$425,000
4
bds
|
2
ba
|
1,495
sqft
|
built
1902
2300 W 19th St, Chicago, IL 60608
$-470
Cash flow
-5.8%
Cash-on-Cash Return
4.4%
Cap rate
0.8%
Rent to Value Ratio
Active
$400,000
6
bds
|
2
ba
|
0
sqft
|
built
1892
1751 W 21st Pl, Chicago, IL 60608
$-1,610
Cash flow
-21.0%
Cash-on-Cash Return
0.8%
Cap rate
0.4%
Rent to Value Ratio
Active
$575,000
6
bds
|
6
ba
|
0
sqft
|
built
1890
1036 W 18th St, Chicago, IL 60608
$-2,074
Cash flow
-18.8%
Cash-on-Cash Return
1.4%
Cap rate
0.4%
Rent to Value Ratio
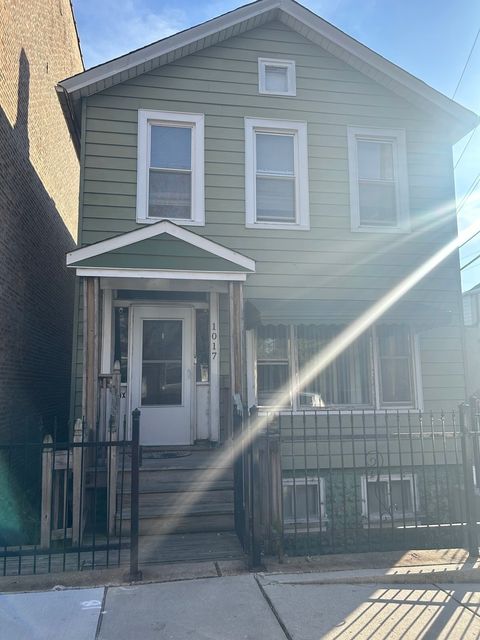
Active
$399,999
4
bds
|
3
ba
|
0
sqft
|
built
1893
1017 W 19th St, Chicago, IL 60608
$-1,375
Cash flow
-17.9%
Cash-on-Cash Return
1.6%
Cap rate
0.5%
Rent to Value Ratio
Active
$800,000
4
bds
|
3
ba
|
2,633
sqft
|
built
1897
3408 S Carpenter St, Chicago, IL 60608
$-2,877
Cash flow
-18.8%
Cash-on-Cash Return
1.4%
Cap rate
0.3%
Rent to Value Ratio
Active
$524,900
8
bds
|
3
ba
|
0
sqft
|
built
1911
2701 W 24th Pl, Chicago, IL 60608
$-1,622
Cash flow
-16.1%
Cash-on-Cash Return
2.0%
Cap rate
0.4%
Rent to Value Ratio
Active
$760,000
4
bds
|
4
ba
|
0
sqft
|
built
1891
1117 W 18th St, Chicago, IL 60608
$-2,072
Cash flow
-14.2%
Cash-on-Cash Return
2.4%
Cap rate
0.4%
Rent to Value Ratio