60633 Investment Properties for Sale
Browse homes for sale and investment properties in 60633. Refine your search by price, property type, or more.
Best cash flowing properties in 60633
Active
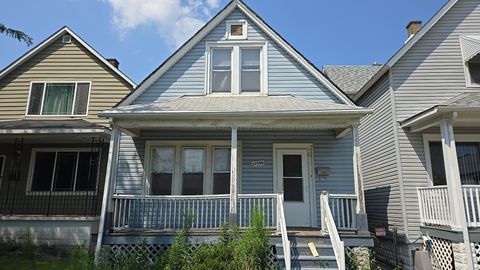
$132,000
4
bds
|
2
ba
|
1,592
sqft
|
built
1883
13550 S Burley Ave, Chicago, IL 60633
$727
Cash flow
28.7%
Cash-on-Cash Return
12.3%
Cap rate
1.5%
Rent to Value Ratio
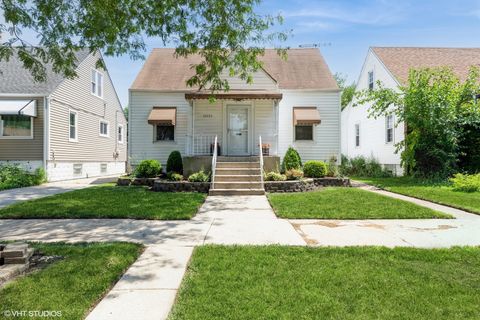
Active
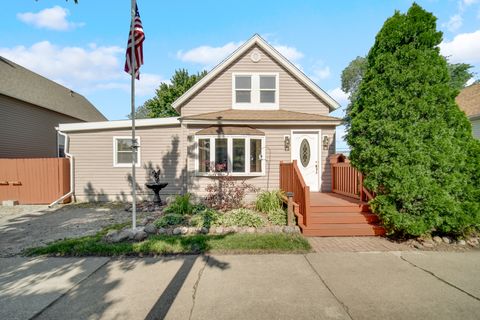
$234,900
5
bds
|
2
ba
|
2,900
sqft
|
built
1893
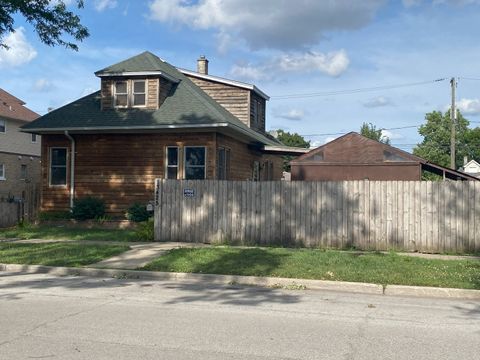
14020 S Green Bay Ave, Burnham, IL 60633
$388
Cash flow
8.6%
Cash-on-Cash Return
7.7%
Cap rate
1.2%
Rent to Value Ratio
16 out of 16 properties for sale in 60633
Limited Results Shown
Create a free account, or log in to reveal all property listings and enjoy the complete experience.
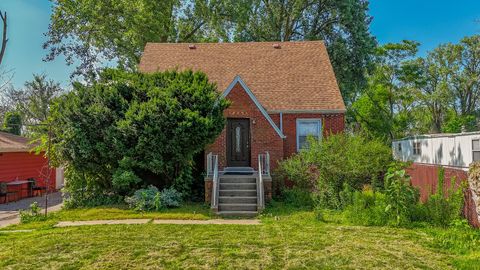
Active
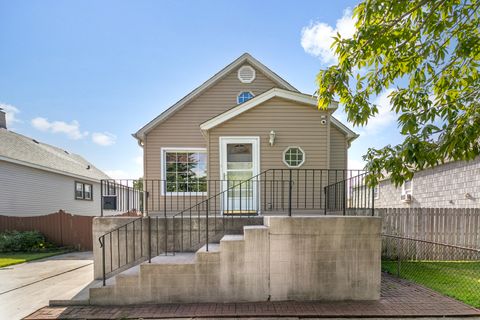
$259,900
3
bds
|
2
ba
|
1,862
sqft
|
built
1920
13448 S Avenue K, Chicago, IL 60633
$-106
Cash flow
-2.1%
Cash-on-Cash Return
5.2%
Cap rate
0.7%
Rent to Value Ratio

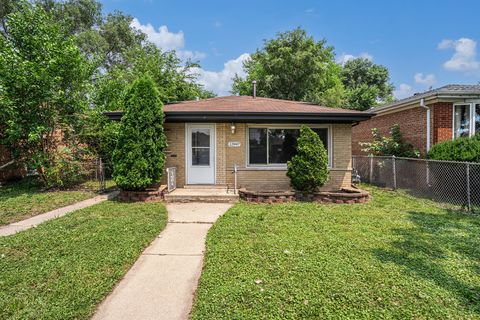
Active
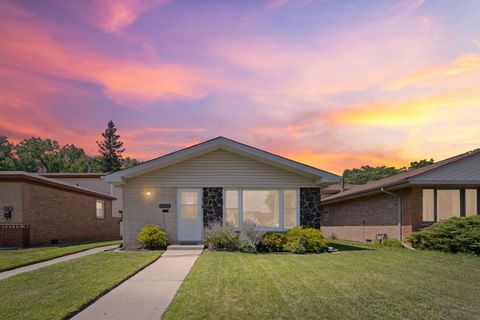
$269,900
5
bds
|
3
ba
|
2,100
sqft
|
built
1914
13341 S Avenue L, Chicago, IL 60633
$-144
Cash flow
-2.8%
Cash-on-Cash Return
5.0%
Cap rate
0.7%
Rent to Value Ratio
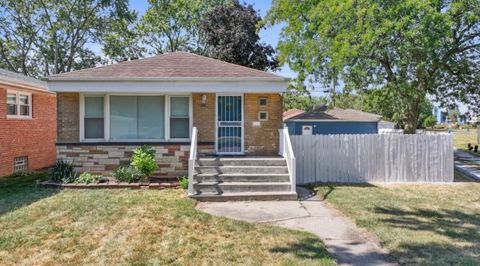
Active
$230,000
3
bds
|
2
ba
|
1,100
sqft
|
built
1971
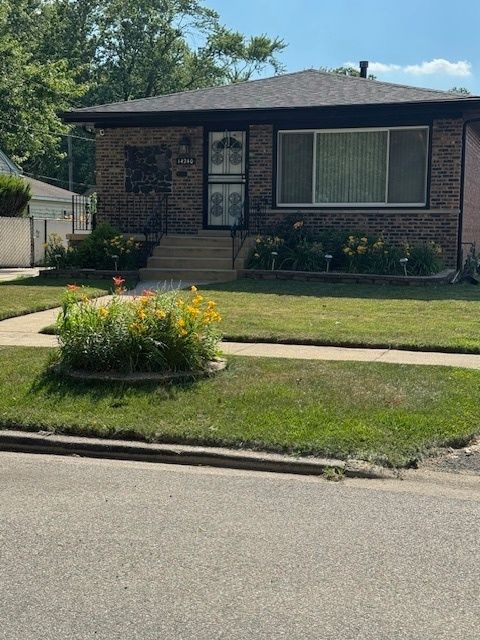
14112 S Saginaw Ave, Burnham, IL 60633
$-240
Cash flow
-5.4%
Cash-on-Cash Return
4.4%
Cap rate
0.9%
Rent to Value Ratio
Active
$229,000
4
bds
|
1
ba
|
1,365
sqft
|
built
1939
13121 S Muskegon Ave, Chicago, IL 60633
$161
Cash flow
3.7%
Cash-on-Cash Return
6.5%
Cap rate
0.9%
Rent to Value Ratio

Active
$269,000
3
bds
|
2
ba
|
1,040
sqft
|
built
1960
2739 E 127th St, Chicago, IL 60633
$-28
Cash flow
-0.5%
Cash-on-Cash Return
5.6%
Cap rate
0.7%
Rent to Value Ratio
Active
$224,900
3
bds
|
2
ba
|
939
sqft
|
built
1953
2910 E 138th Pl, Burnham, IL 60633
$-180
Cash flow
-4.2%
Cash-on-Cash Return
4.7%
Cap rate
1.0%
Rent to Value Ratio
Active
$164,900
3
bds
|
2
ba
|
1,078
sqft
|
built
1972
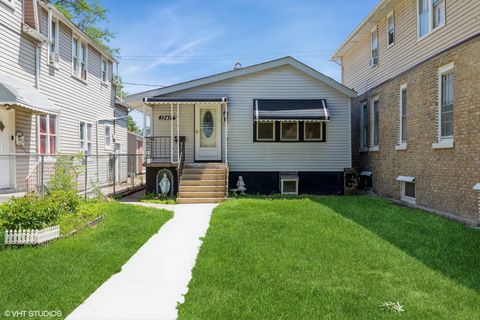
13947 S Saginaw Ave, Burnham, IL 60633
$-139
Cash flow
-4.4%
Cash-on-Cash Return
4.7%
Cap rate
1.2%
Rent to Value Ratio
Active
$215,000
3
bds
|
2
ba
|
1,074
sqft
|
built
1957
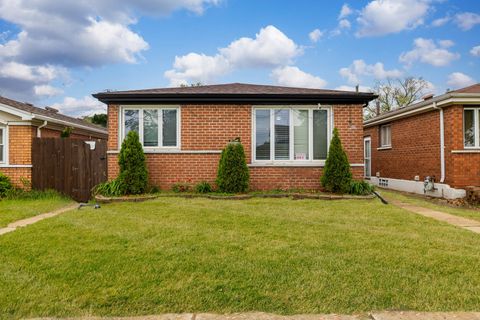
14322 S Hoxie Ave, Burnham, IL 60633
$-264
Cash flow
-6.4%
Cash-on-Cash Return
4.2%
Cap rate
1.1%
Rent to Value Ratio
Active
$209,900
3
bds
|
2
ba
|
1,091
sqft
|
built
1971
14240 S Manistee Ave, Burnham, IL 60633
$-37
Cash flow
-0.9%
Cash-on-Cash Return
5.5%
Cap rate
1.0%
Rent to Value Ratio

Active
$239,900
3
bds
|
2
ba
|
1,619
sqft
|
built
1961
12949 S Exchange Ave, Chicago, IL 60633
$57
Cash flow
1.2%
Cash-on-Cash Return
6.0%
Cap rate
0.8%
Rent to Value Ratio
Active
$289,900
4
bds
|
2
ba
|
717
sqft
|
built
1922
13425 S Avenue M, Chicago, IL 60633
$-417
Cash flow
-7.5%
Cash-on-Cash Return
4.0%
Cap rate
0.6%
Rent to Value Ratio
Active
$210,000
3
bds
|
3
ba
|
756
sqft
|
built
1888
13417 S Avenue M, Chicago, IL 60633
$74
Cash flow
1.8%
Cash-on-Cash Return
6.1%
Cap rate
0.8%
Rent to Value Ratio
Active
$240,000
3
bds
|
1
ba
|
1,066
sqft
|
built
1963
2816 E 127th St, Chicago, IL 60633
$56
Cash flow
1.2%
Cash-on-Cash Return
6.0%
Cap rate
0.8%
Rent to Value Ratio
Active
$235,000
3
bds
|
2
ba
|
0
sqft
|
built
1967
14119 S Manistee Ave, Burnham, IL 60633
$-173
Cash flow
-3.8%
Cash-on-Cash Return
4.8%
Cap rate
0.9%
Rent to Value Ratio