60638 Investment Properties for Sale
Browse homes for sale and investment properties in 60638. Refine your search by price, property type, or more.
Best cash flowing properties in 60638
Active
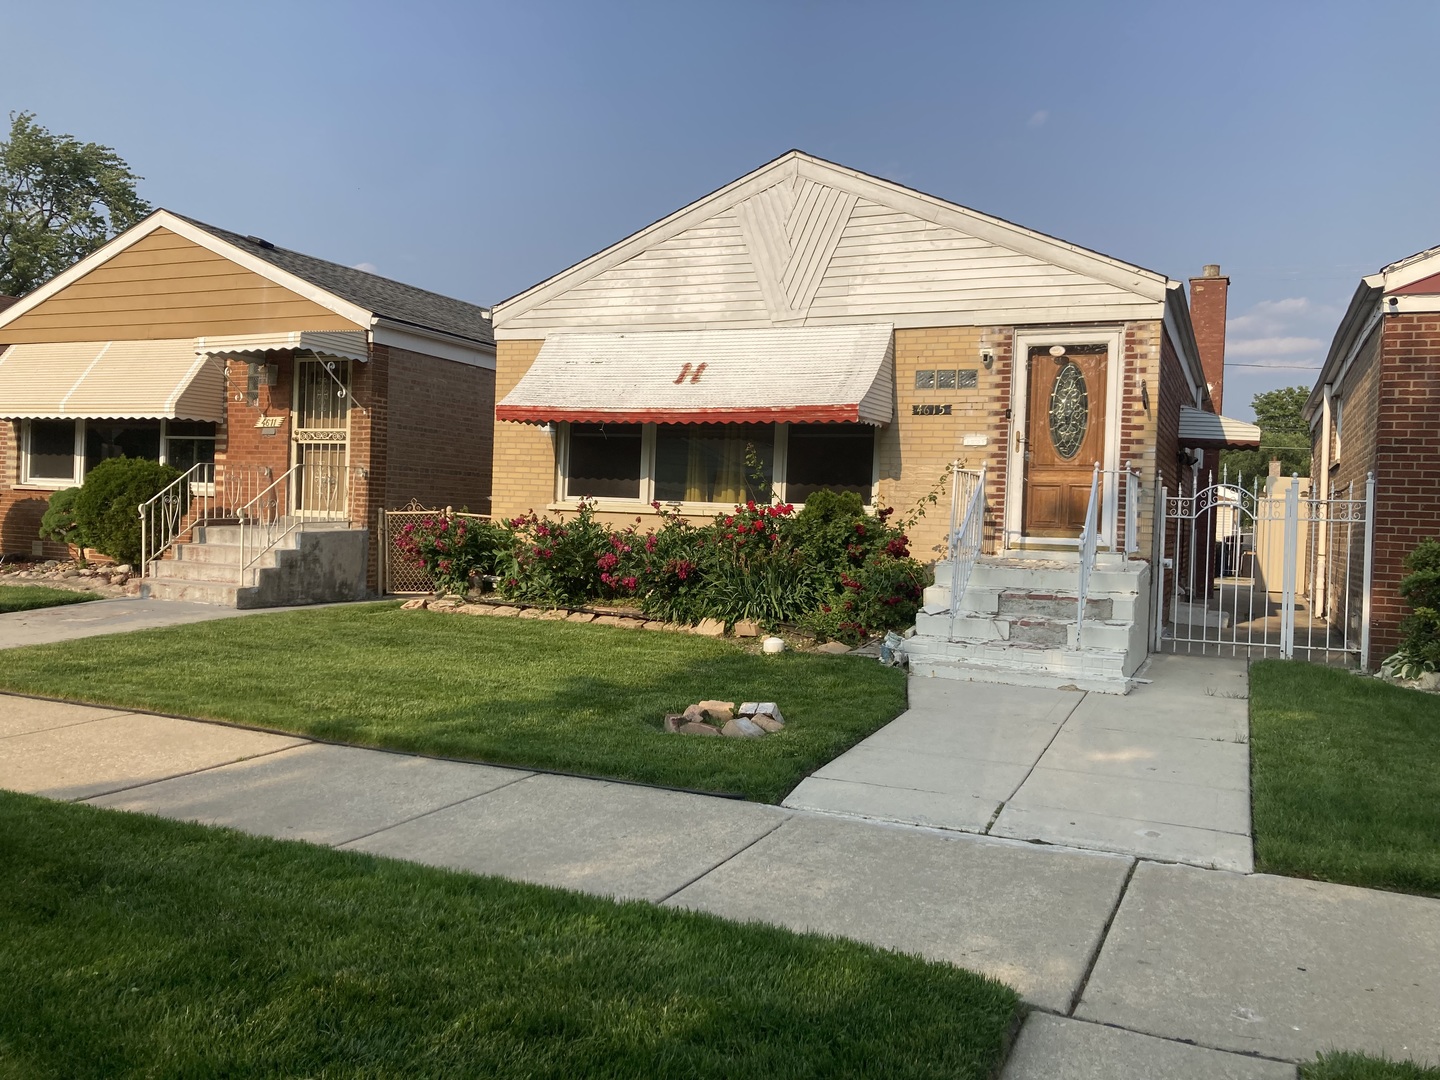
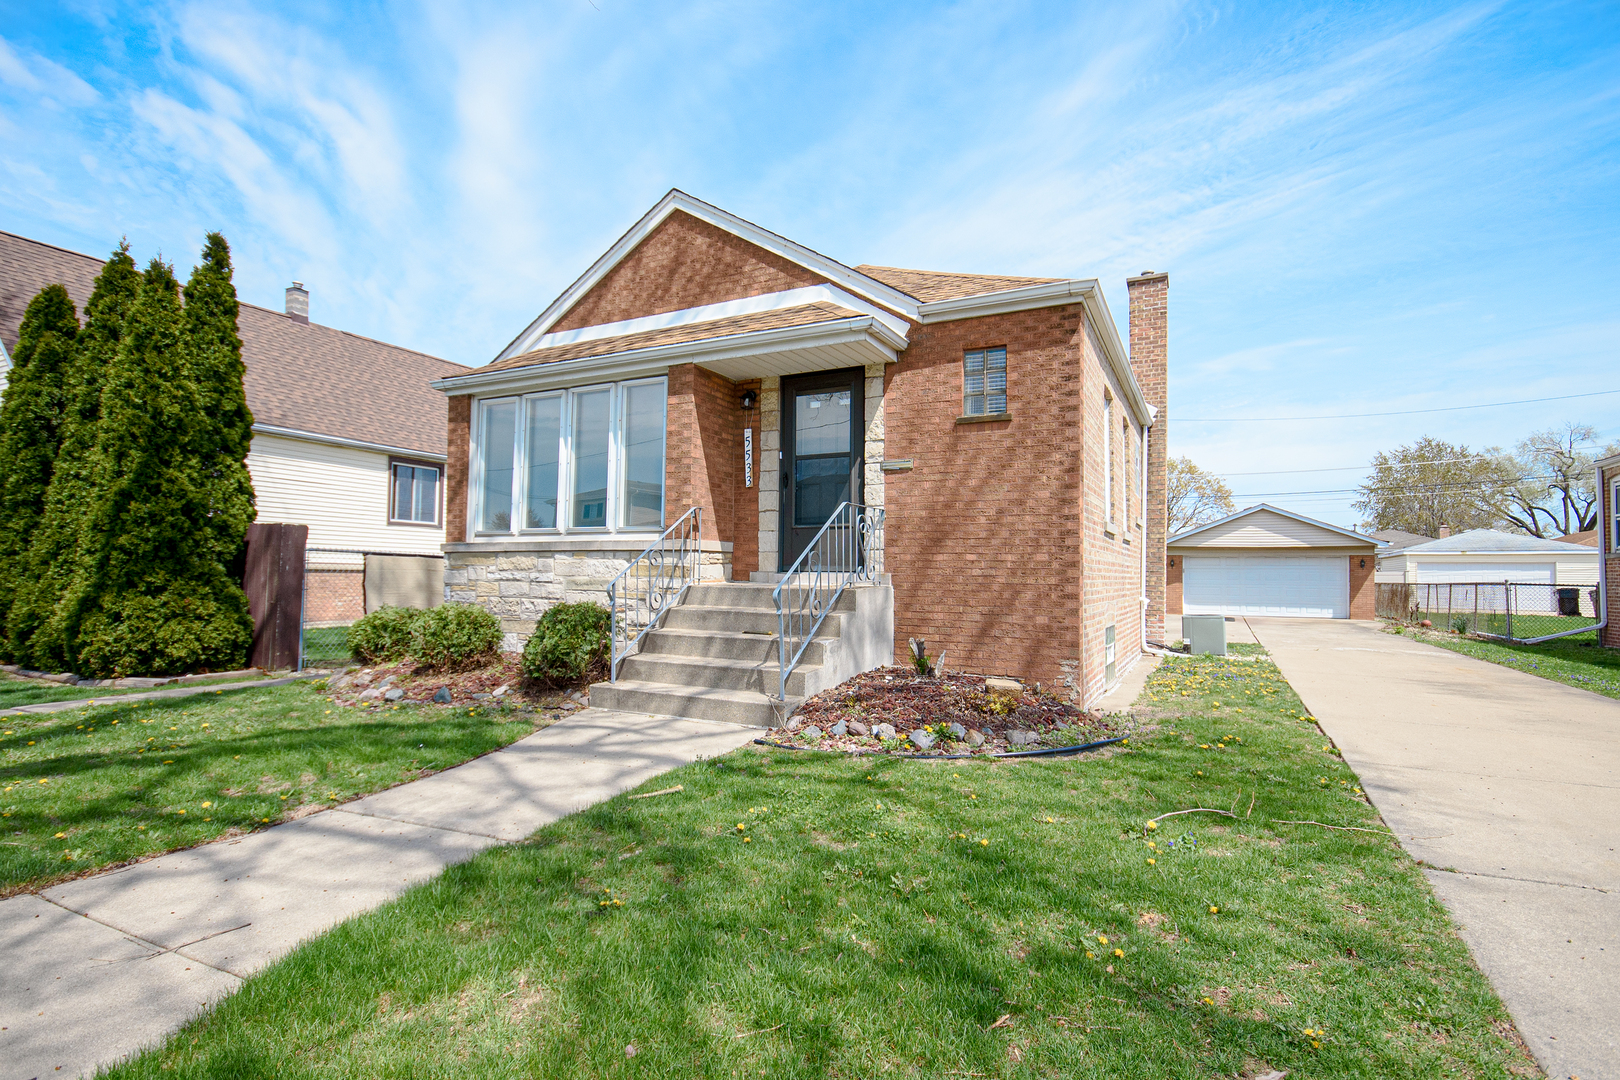
$325,000
3
bds
|
2
ba
|
2,808
sqft
|
built
1955
4615 S Lawler Ave, Chicago, IL 60638
$584
Cash flow
9.4%
Cash-on-Cash Return
7.8%
Cap rate
1.1%
Rent to Value Ratio
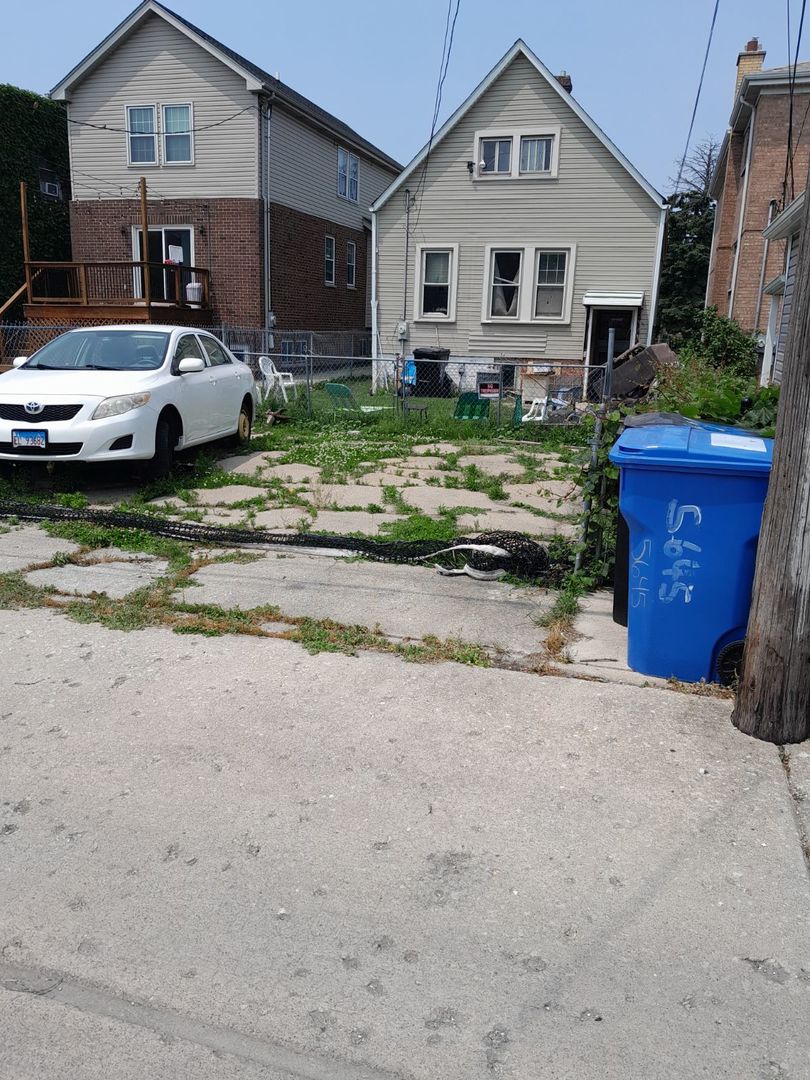
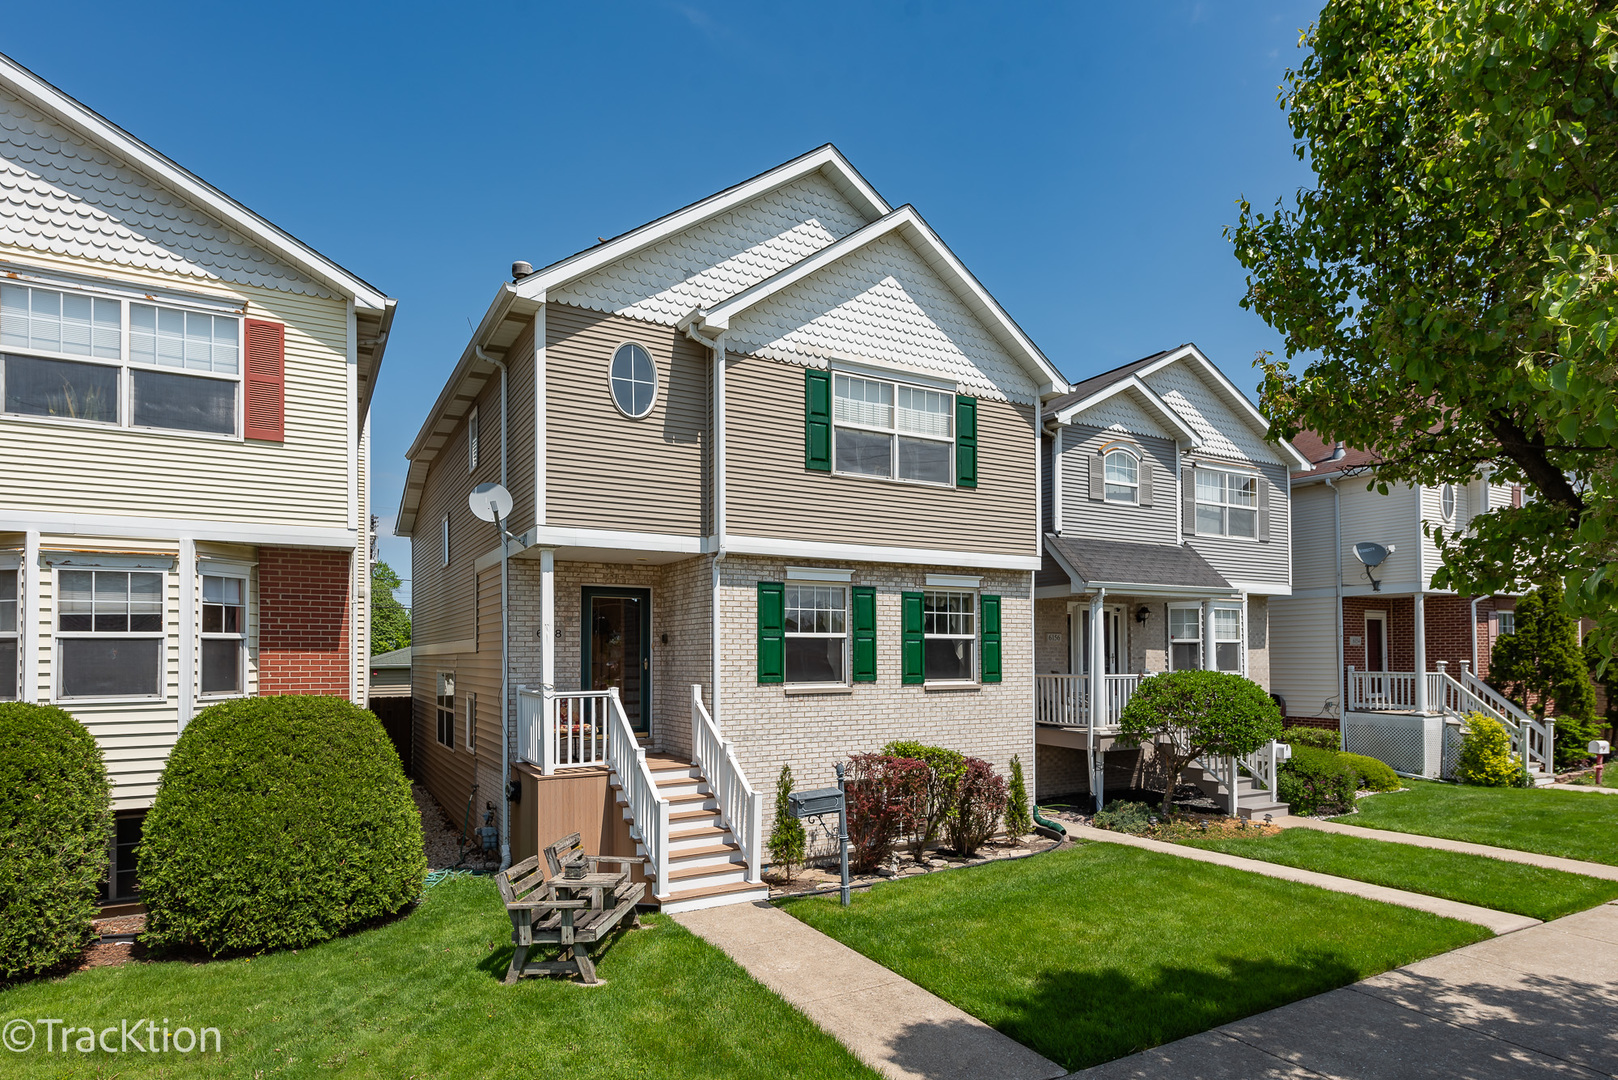
Active
$255,000
2
bds
|
3
ba
|
3,750
sqft
|
built
2004
5645 W 64th St, Chicago, IL 60638
$536
Cash flow
11.0%
Cash-on-Cash Return
8.2%
Cap rate
1.1%
Rent to Value Ratio
66 out of 71 properties for sale in 60638
Limited Results Shown
Create a free account, or log in to reveal all property listings and enjoy the complete experience.
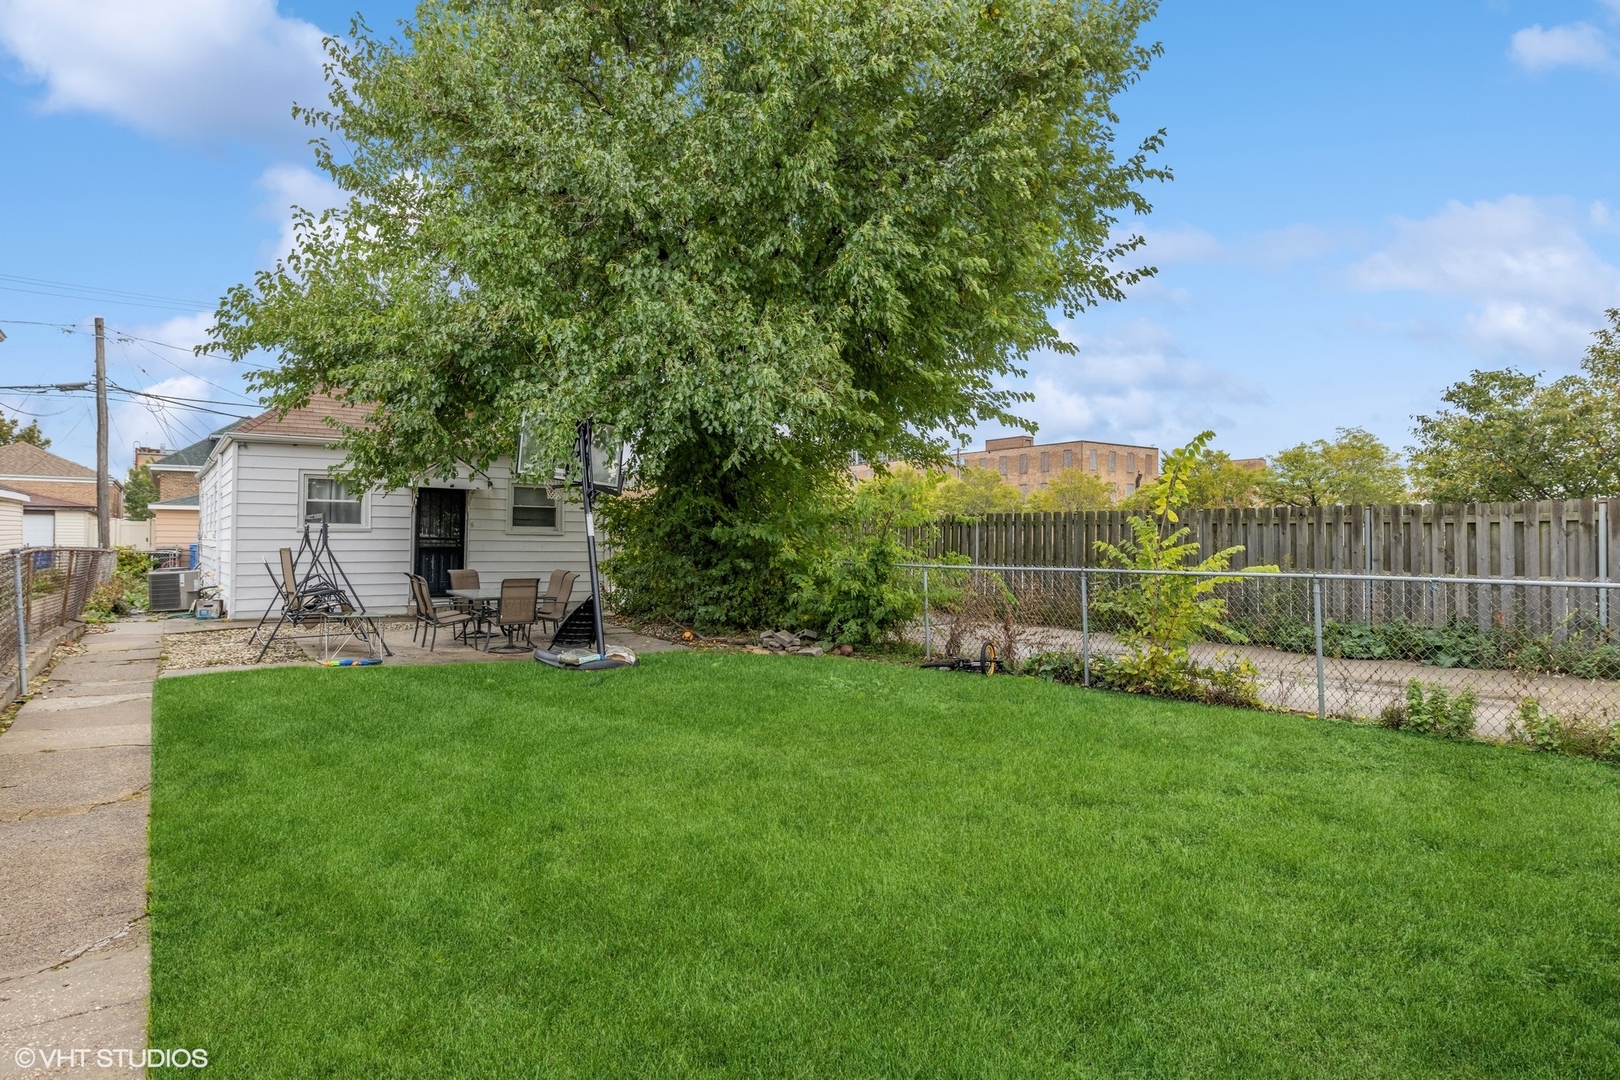
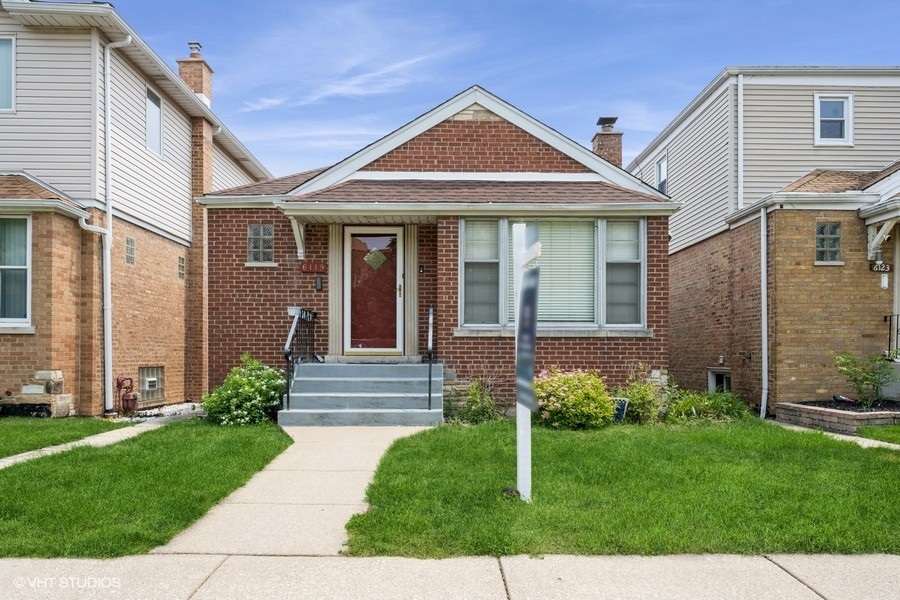
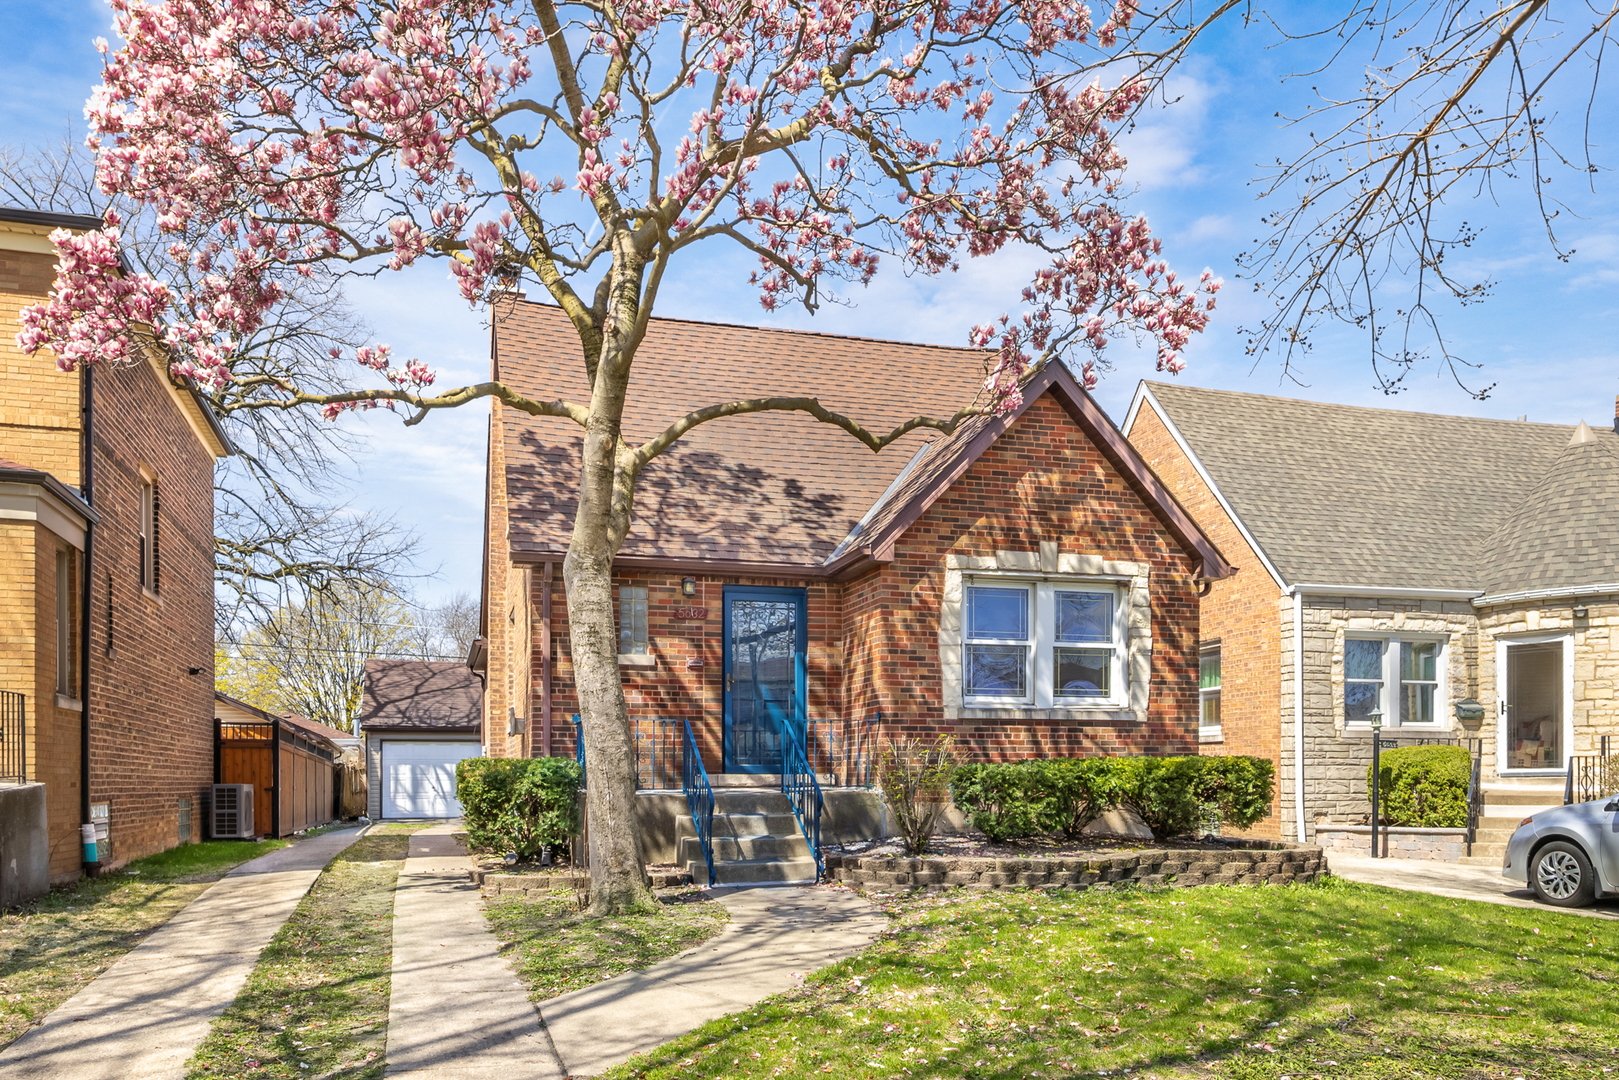
Active
$259,000
4
bds
|
1
ba
|
1,542
sqft
|
built
1919
5443 S Long Ave, Chicago, IL 60638
$7
Cash flow
0.1%
Cash-on-Cash Return
5.7%
Cap rate
0.9%
Rent to Value Ratio
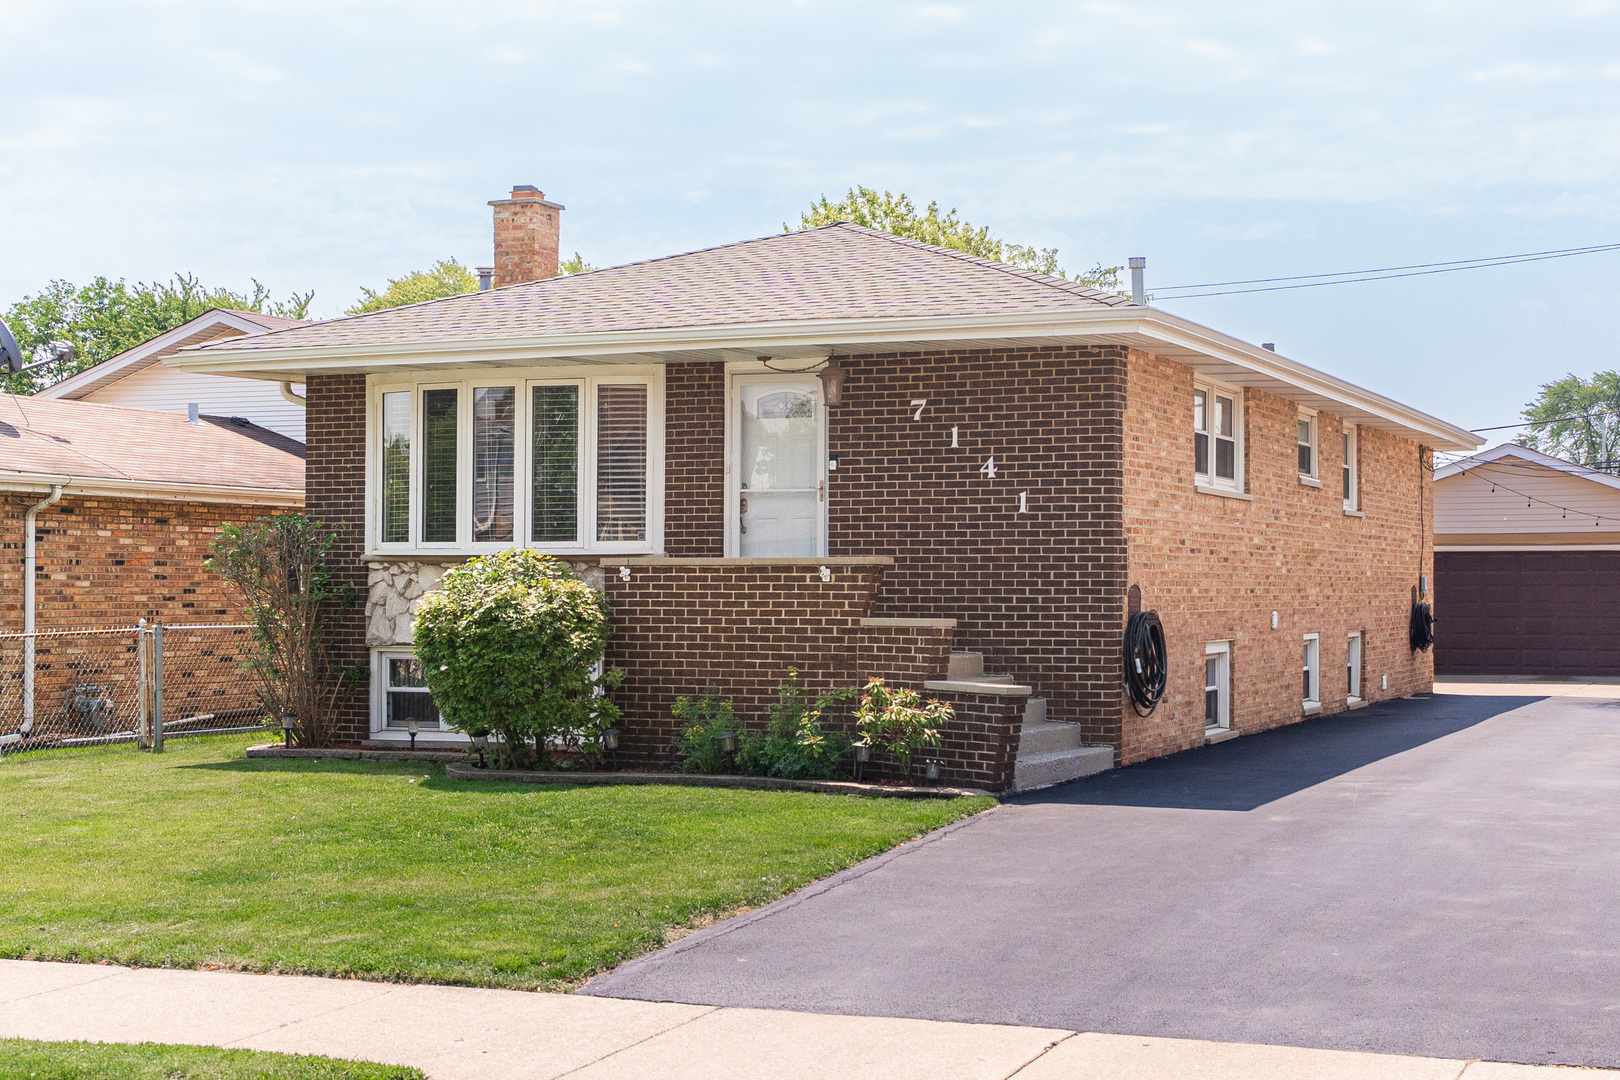
Active
$380,000
3
bds
|
2
ba
|
1,261
sqft
|
built
1978
7141 W 72nd St, Chicago, IL 60638
$-364
Cash flow
-5.0%
Cash-on-Cash Return
4.5%
Cap rate
0.7%
Rent to Value Ratio
Active
$300,000
3
bds
|
2
ba
|
1,193
sqft
|
built
1984
7043 W 73rd St, Chicago, IL 60638
$-292
Cash flow
-5.1%
Cash-on-Cash Return
4.5%
Cap rate
0.8%
Rent to Value Ratio
Active
$255,000
2
bds
|
3
ba
|
3,750
sqft
|
built
2004
5645 W 64th St, Chicago, IL 60638
$536
Cash flow
11.0%
Cash-on-Cash Return
8.2%
Cap rate
1.1%
Rent to Value Ratio
Active
$345,000
3
bds
|
1
ba
|
937
sqft
|
built
1955
5424 S Austin Ave, Chicago, IL 60638
$76
Cash flow
1.1%
Cash-on-Cash Return
5.9%
Cap rate
0.7%
Rent to Value Ratio
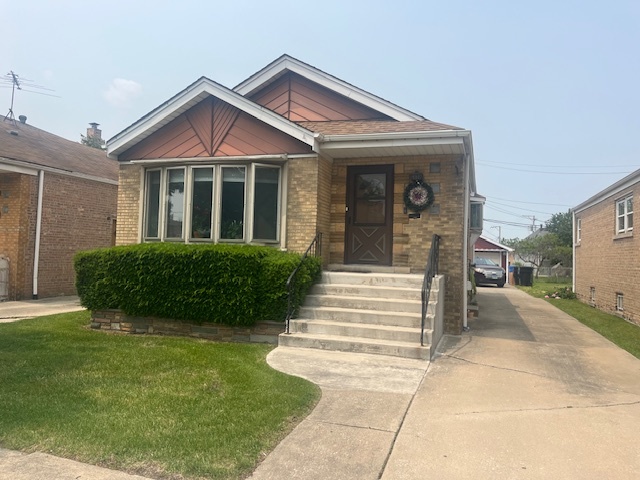
Active under contract
$245,000
2
bds
|
1
ba
|
892
sqft
|
built
1949
6119 S Melvina Ave, Chicago, IL 60638
$212
Cash flow
4.5%
Cash-on-Cash Return
6.7%
Cap rate
1.0%
Rent to Value Ratio
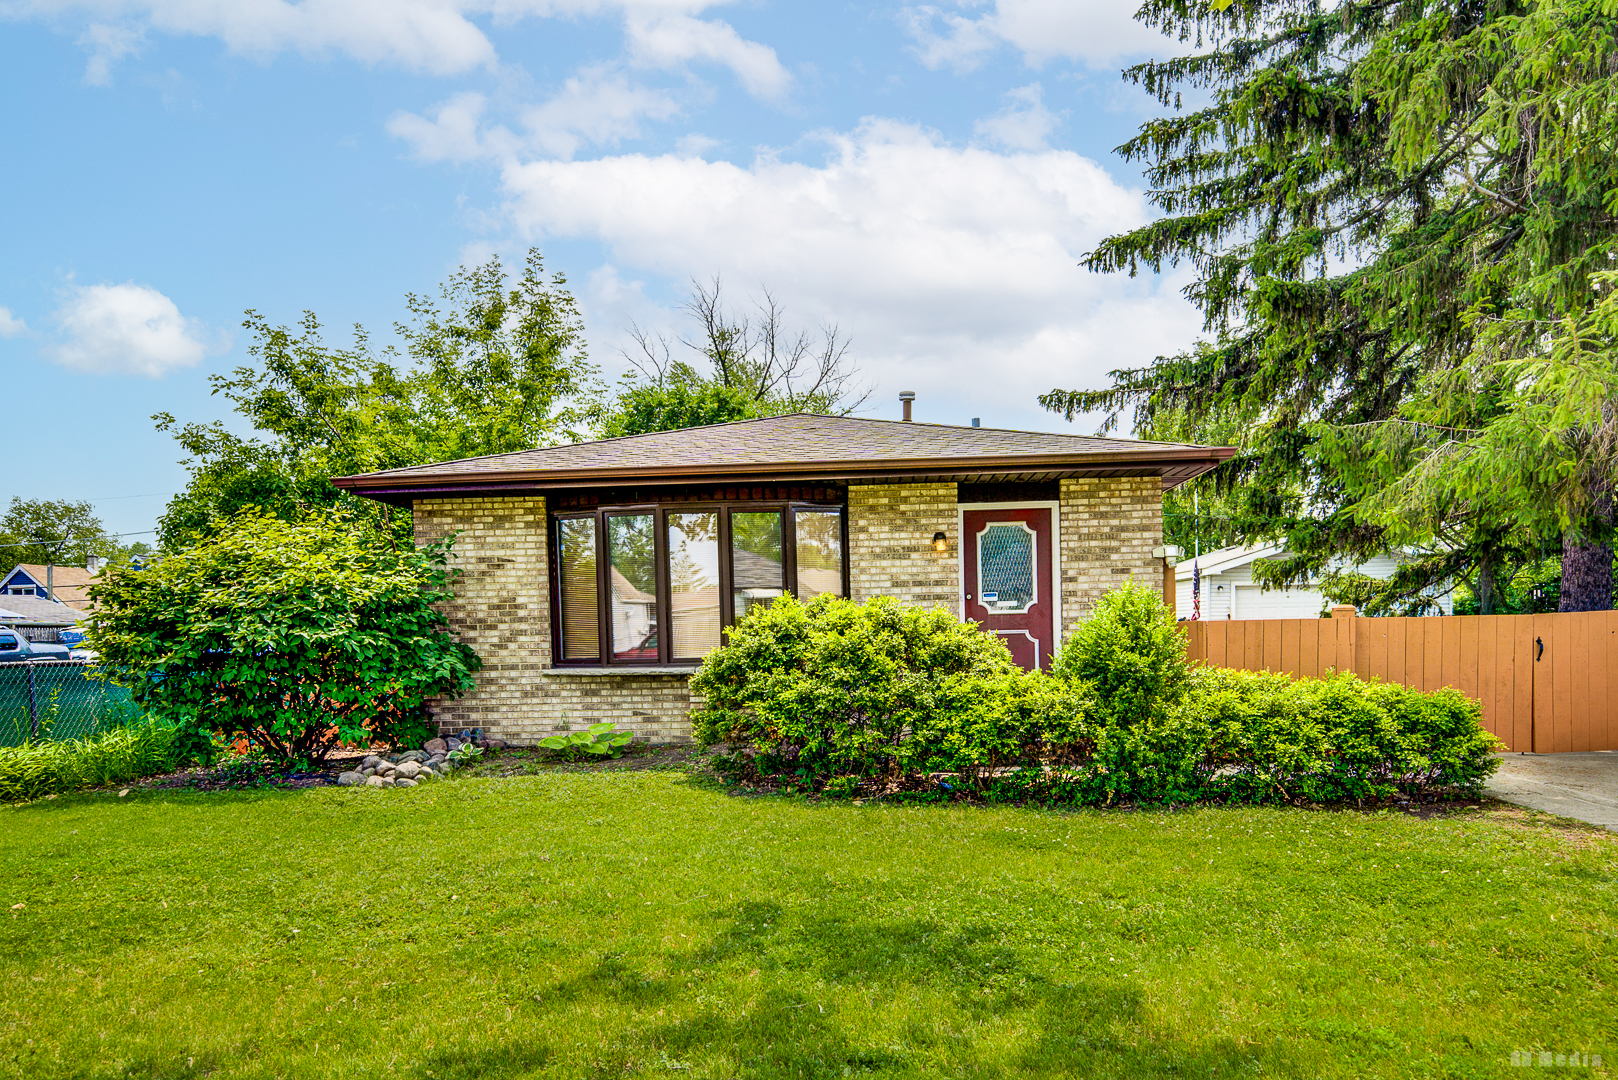
Active
$325,000
3
bds
|
2
ba
|
2,808
sqft
|
built
1955
4615 S Lawler Ave, Chicago, IL 60638
$584
Cash flow
9.4%
Cash-on-Cash Return
7.8%
Cap rate
1.1%
Rent to Value Ratio
Active
$449,000
4
bds
|
3
ba
|
1,916
sqft
|
built
1999
6158 W 60th St, Chicago, IL 60638
$-232
Cash flow
-2.7%
Cash-on-Cash Return
5.1%
Cap rate
0.8%
Rent to Value Ratio
Active
$644,750
3
bds
|
4
ba
|
2,688
sqft
|
built
1940
5443 S Rutherford Ave, Chicago, IL 60638
$-1,871
Cash flow
-15.1%
Cash-on-Cash Return
2.2%
Cap rate
0.4%
Rent to Value Ratio
Active
$399,999
3
bds
|
2
ba
|
1,008
sqft
|
built
1929
6111 S Menard Ave, Chicago, IL 60638
$-481
Cash flow
-6.3%
Cash-on-Cash Return
4.2%
Cap rate
0.6%
Rent to Value Ratio

Active
$424,900
3
bds
|
2
ba
|
1,914
sqft
|
built
1993
5209 S Narragansett Ave, Chicago, IL 60638
$-361
Cash flow
-4.4%
Cash-on-Cash Return
4.7%
Cap rate
0.7%
Rent to Value Ratio
Active
$469,900
4
bds
|
3
ba
|
2,760
sqft
|
built
1952
6037 S Mason Ave, Chicago, IL 60638
$93
Cash flow
1.0%
Cash-on-Cash Return
5.9%
Cap rate
0.9%
Rent to Value Ratio
Active
$179,900
2
bds
|
1
ba
|
900
sqft
|
built
1982
6319 W 64th Pl, Chicago, IL 60638
$-49
Cash flow
-1.4%
Cash-on-Cash Return
5.3%
Cap rate
0.9%
Rent to Value Ratio
Active
$319,999
4
bds
|
2
ba
|
1,312
sqft
|
built
1956
4918 S Luna Ave, Chicago, IL 60638
$-271
Cash flow
-4.4%
Cash-on-Cash Return
4.7%
Cap rate
0.7%
Rent to Value Ratio
Active under contract
$260,000
2
bds
|
1
ba
|
1,104
sqft
|
built
1941
4948 S Lamon Ave, Chicago, IL 60638
$229
Cash flow
4.6%
Cash-on-Cash Return
6.7%
Cap rate
1.0%
Rent to Value Ratio
Active
$444,900
4
bds
|
2
ba
|
1,382
sqft
|
built
1949
5200 S Newcastle Ave, Chicago, IL 60638
$-750
Cash flow
-8.8%
Cash-on-Cash Return
3.7%
Cap rate
0.5%
Rent to Value Ratio
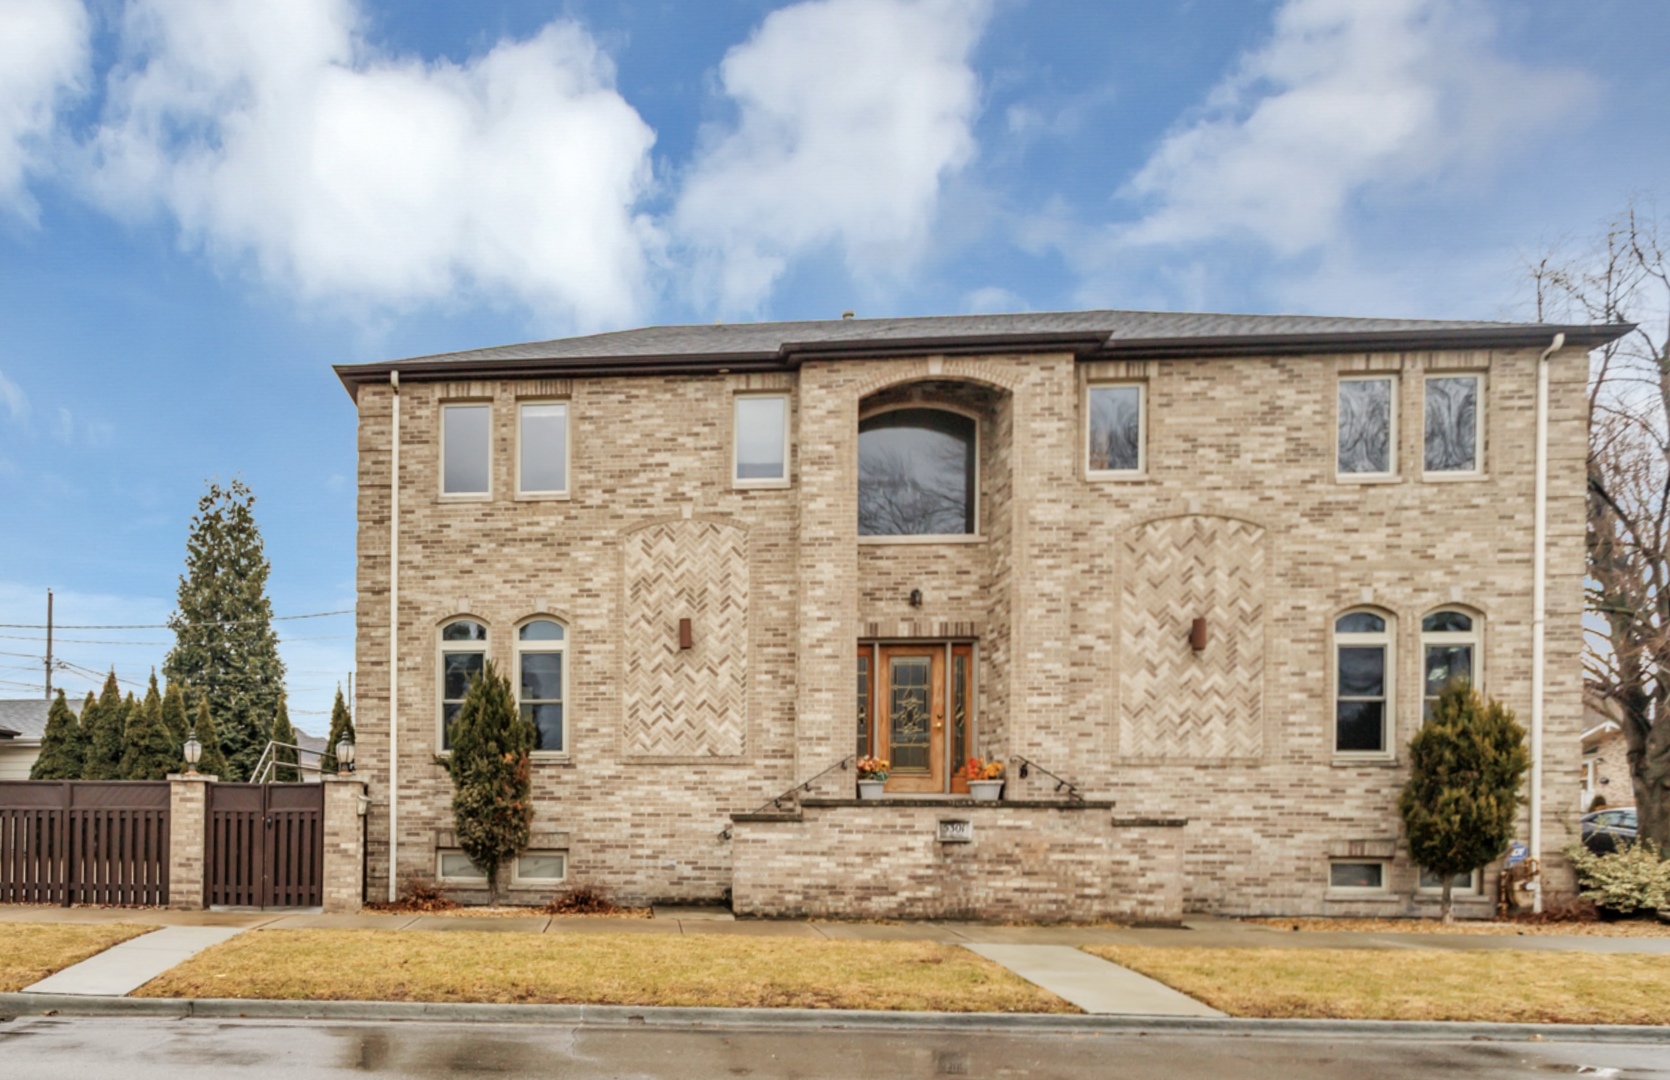
Active
$479,999
4
bds
|
2
ba
|
1,380
sqft
|
built
1953
5301 S Mc Vicker Ave, Chicago, IL 60638
$-971
Cash flow
-10.6%
Cash-on-Cash Return
3.3%
Cap rate
0.5%
Rent to Value Ratio
Active
$375,000
3
bds
|
2
ba
|
1,656
sqft
|
built
1958
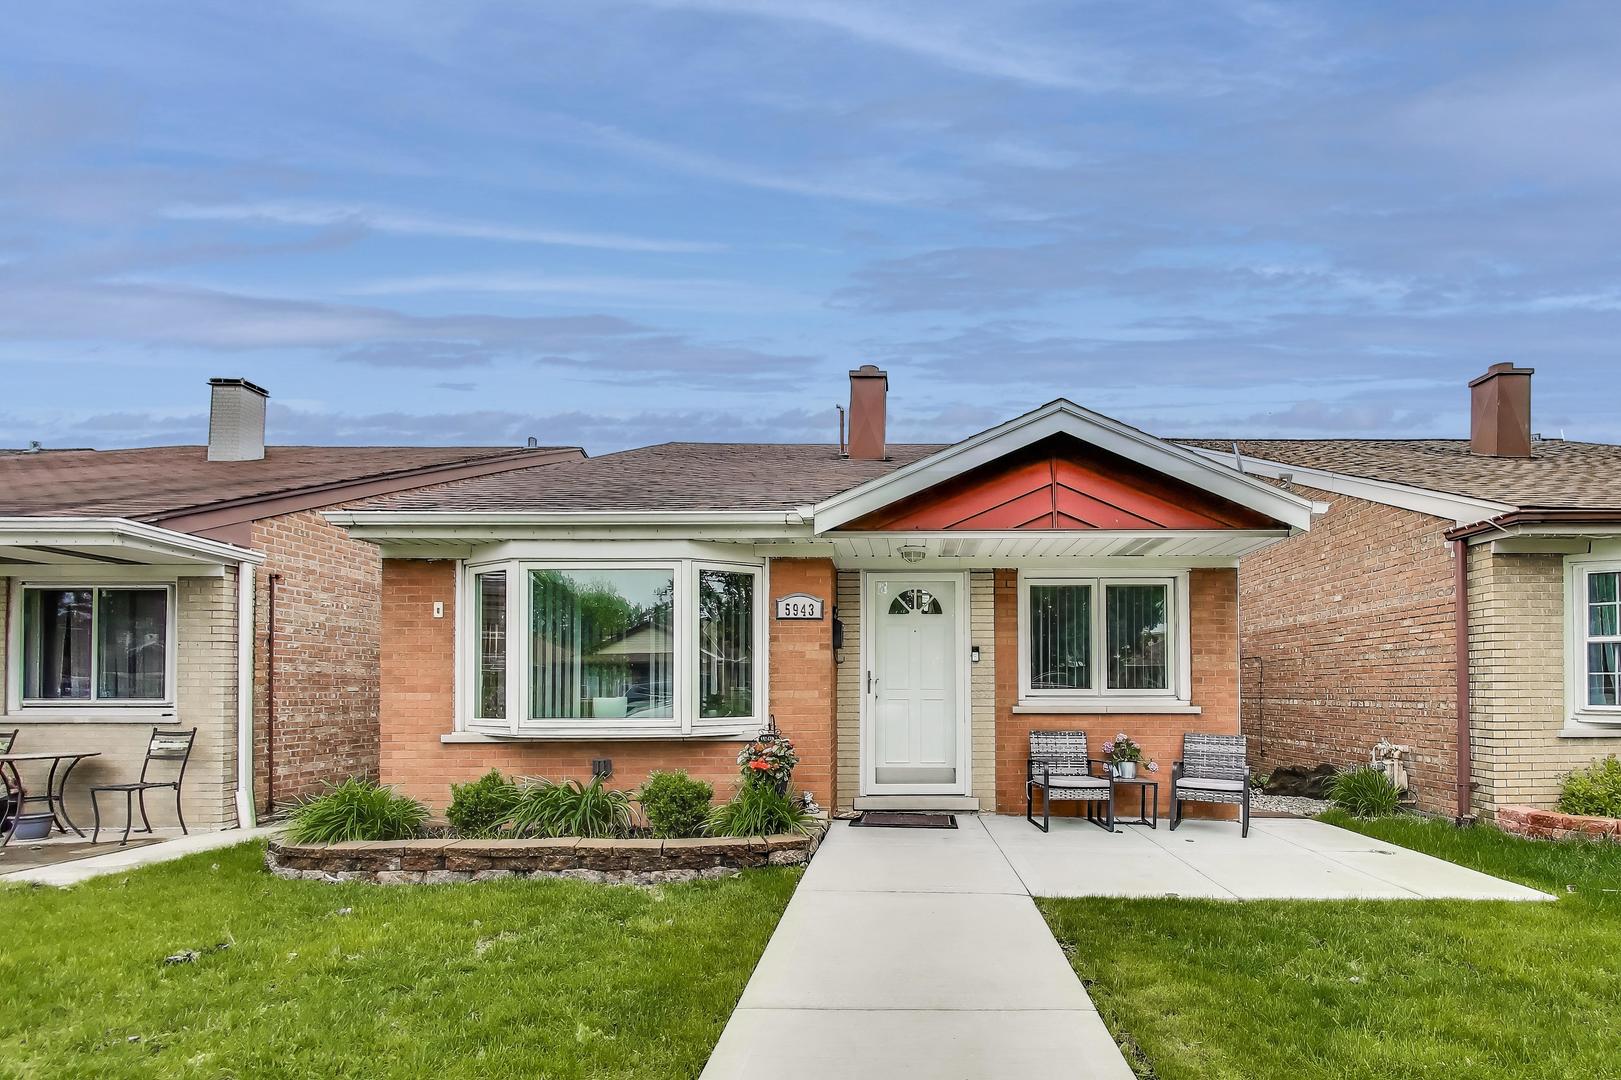
5943 S Parkside Ave, Chicago, IL 60638
$-232
Cash flow
-3.2%
Cash-on-Cash Return
4.9%
Cap rate
0.7%
Rent to Value Ratio
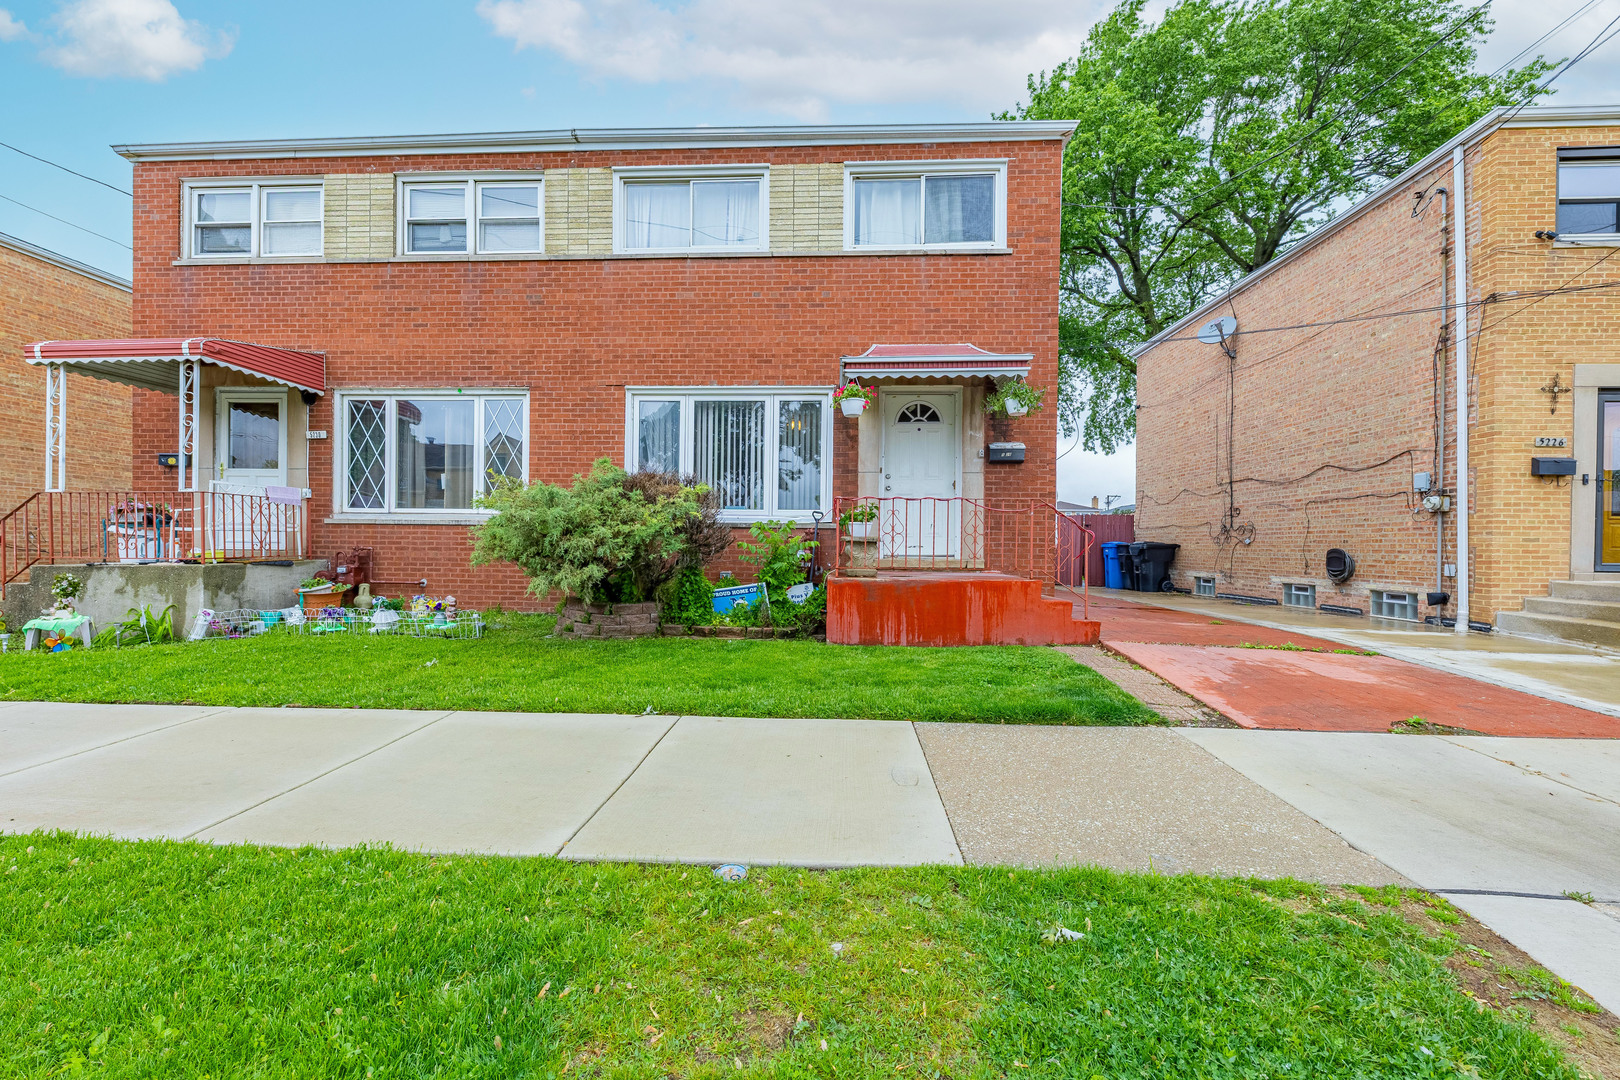
Active
$329,000
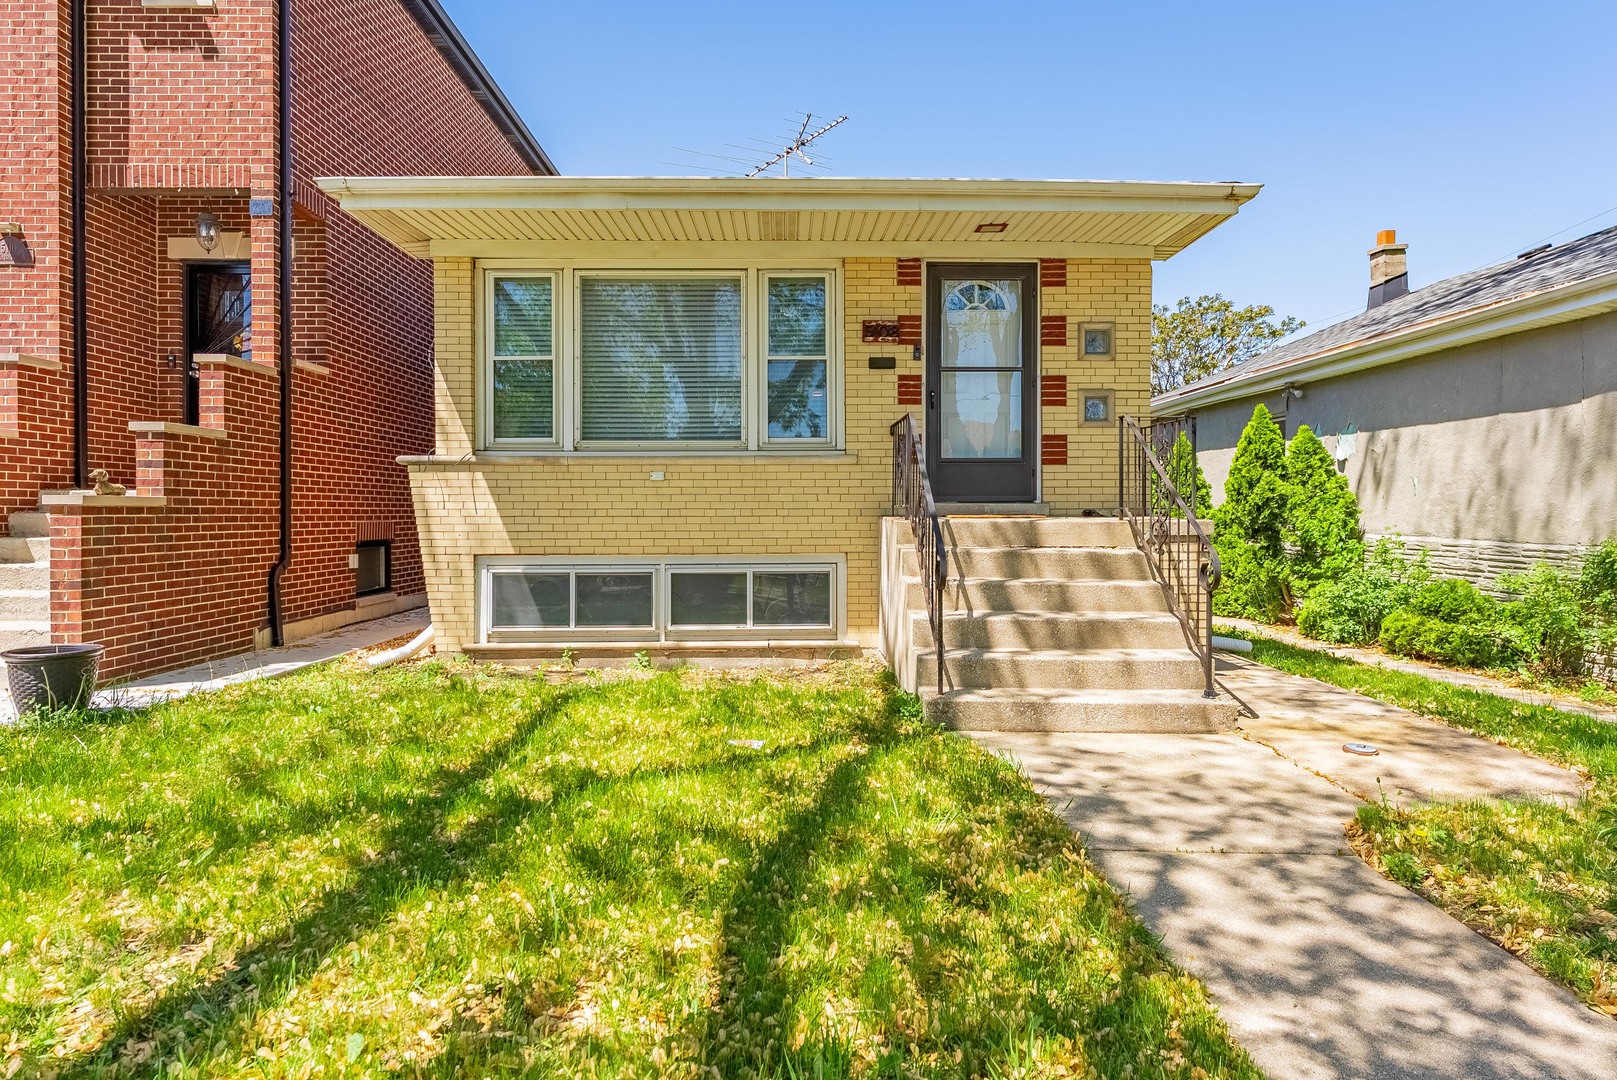
3
bds
|
2
ba
|
1,008
sqft
|
built
1957
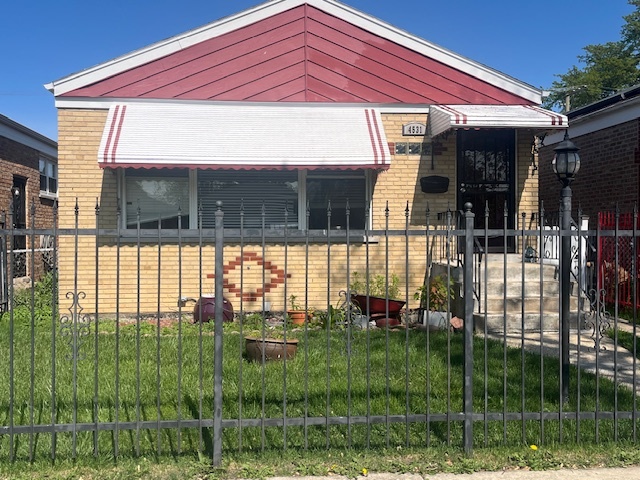
4531 S Lawler Ave, Chicago, IL 60638
$-73
Cash flow
-1.2%
Cash-on-Cash Return
5.4%
Cap rate
0.8%
Rent to Value Ratio
Active
$385,900
3
bds
|
1
ba
|
1,329
sqft
|
built
1970
6100 S Parkside Ave, Chicago, IL 60638
$-277
Cash flow
-3.7%
Cash-on-Cash Return
4.8%
Cap rate
0.6%
Rent to Value Ratio
Active
$325,000
3
bds
|
2
ba
|
1,080
sqft
|
built
1963
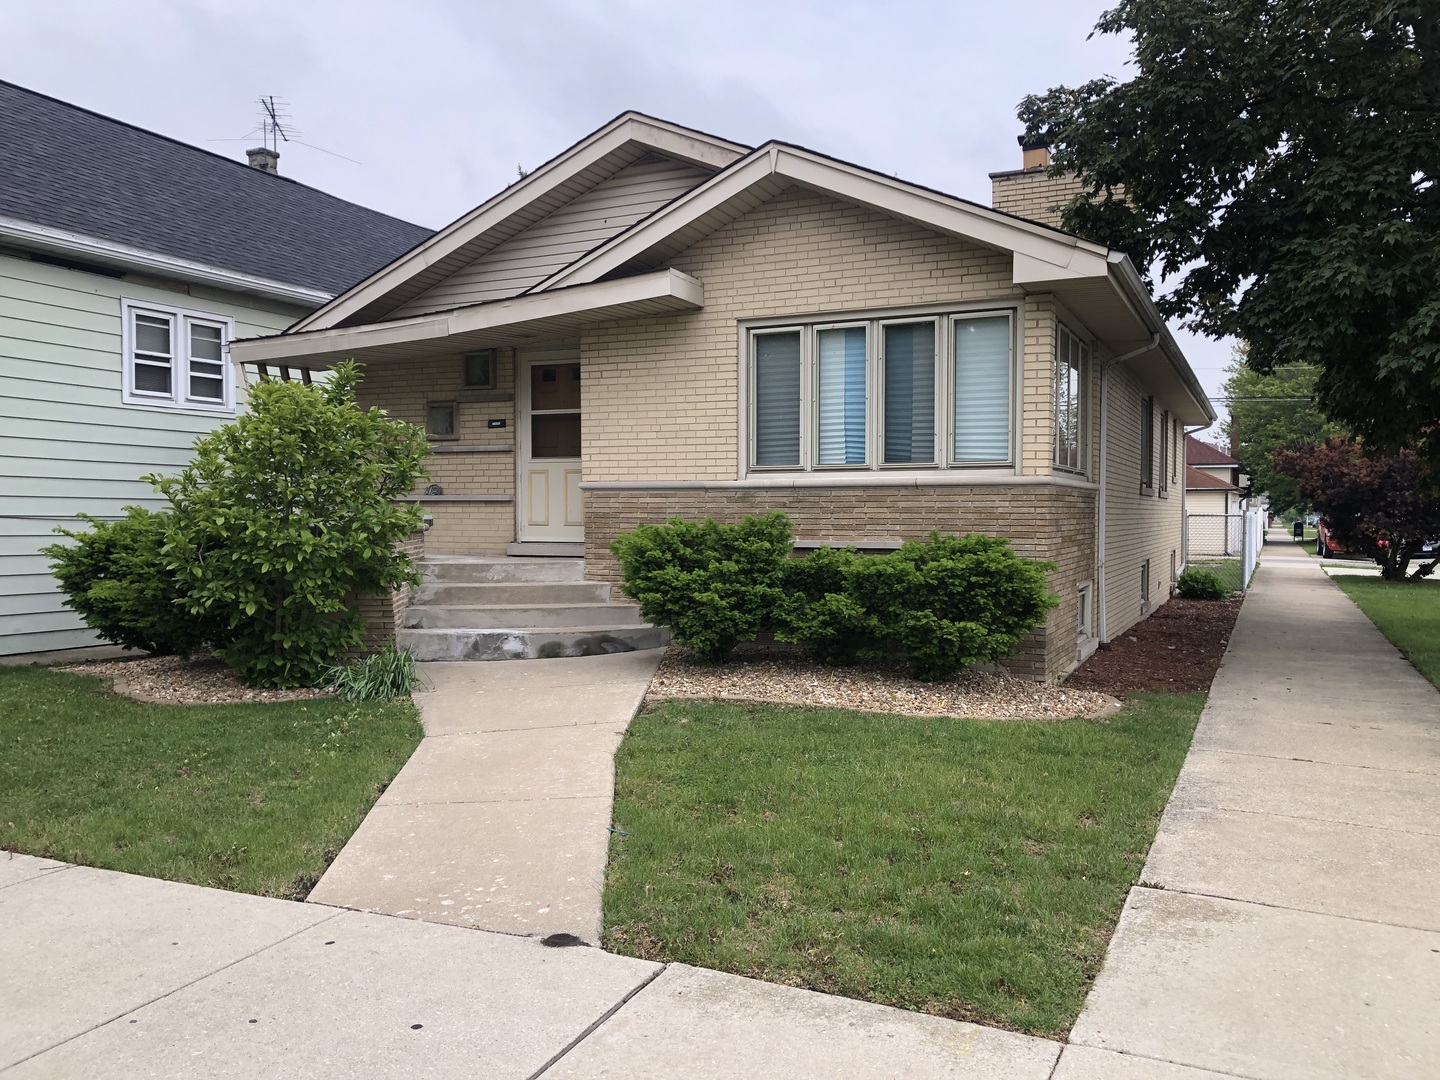
7140 W 64th St, Chicago, IL 60638
$-96
Cash flow
-1.5%
Cash-on-Cash Return
5.3%
Cap rate
0.8%
Rent to Value Ratio
Active
$470,000
3
bds
|
3
ba
|
2,100
sqft
|
built
1941
5632 S Natoma Ave, Chicago, IL 60638
$-1,038
Cash flow
-11.5%
Cash-on-Cash Return
3.0%
Cap rate
0.5%
Rent to Value Ratio
Active
$149,900
2
bds
|
1
ba
|
1,521
sqft
|
built
1923
4932 S Laramie Ave, Chicago, IL 60638
$396
Cash flow
13.8%
Cash-on-Cash Return
8.8%
Cap rate
1.3%
Rent to Value Ratio
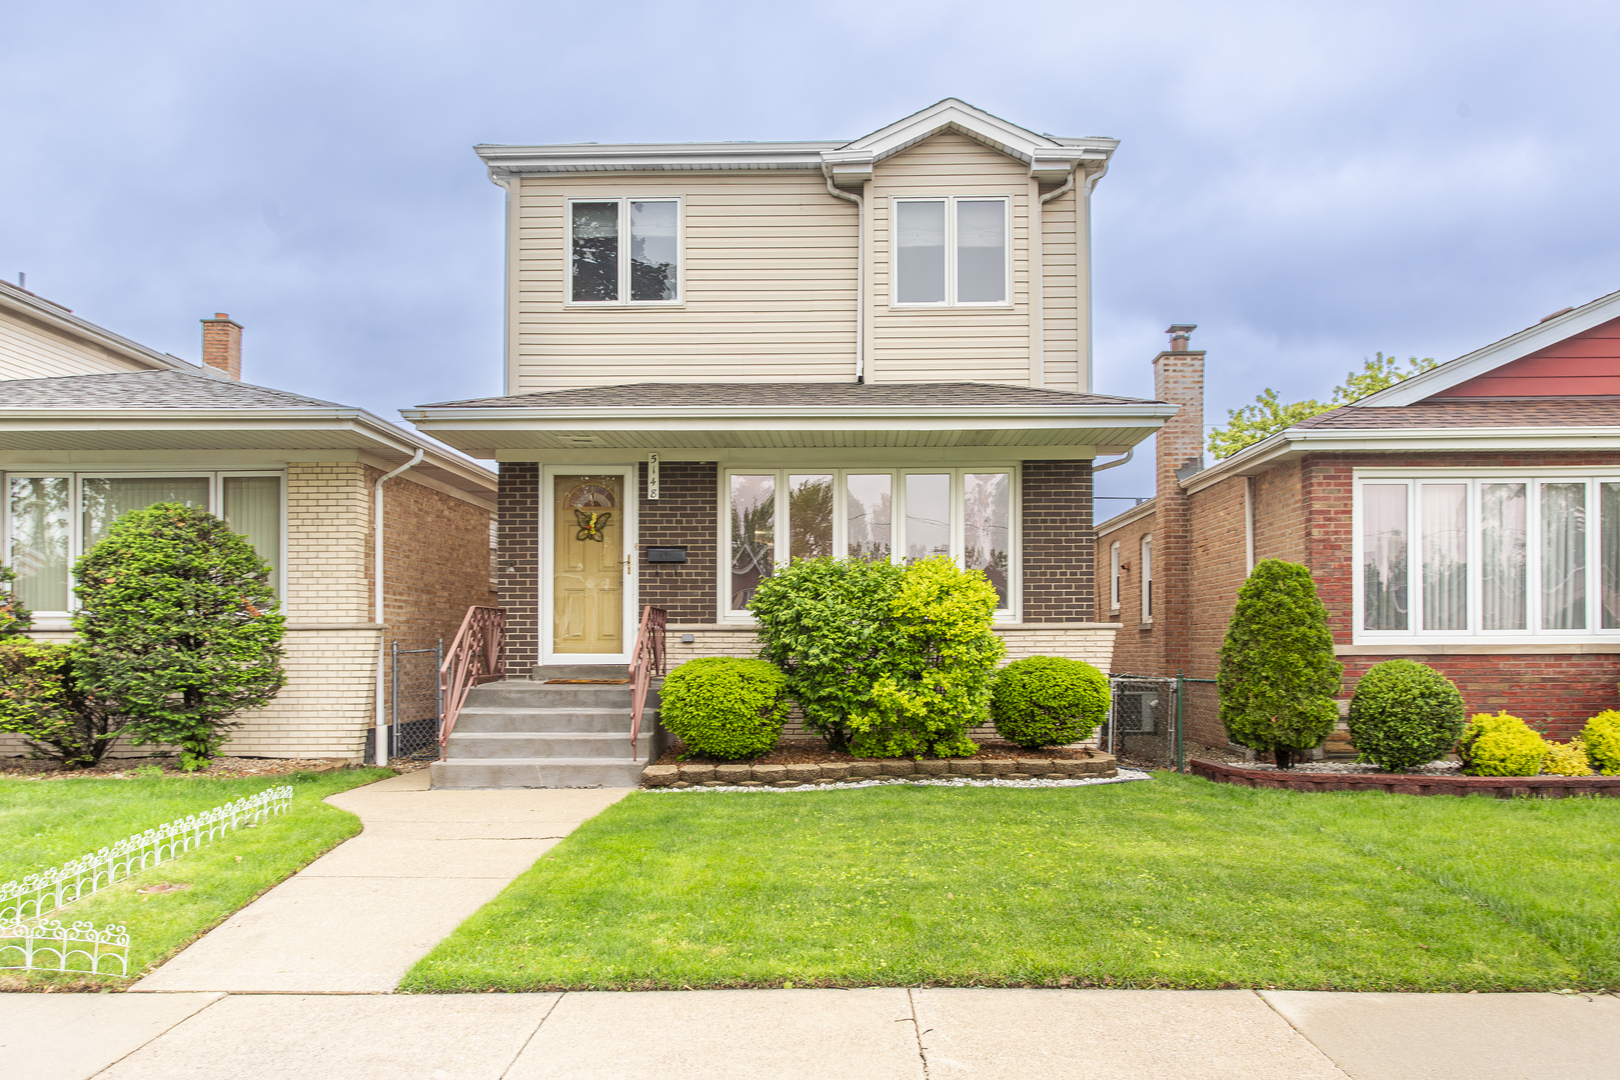
Active
$525,000
6
bds
|
3
ba
|
2,058
sqft
|
built
1966
5148 S Newland Ave, Chicago, IL 60638
$-703
Cash flow
-7.0%
Cash-on-Cash Return
4.1%
Cap rate
0.6%
Rent to Value Ratio
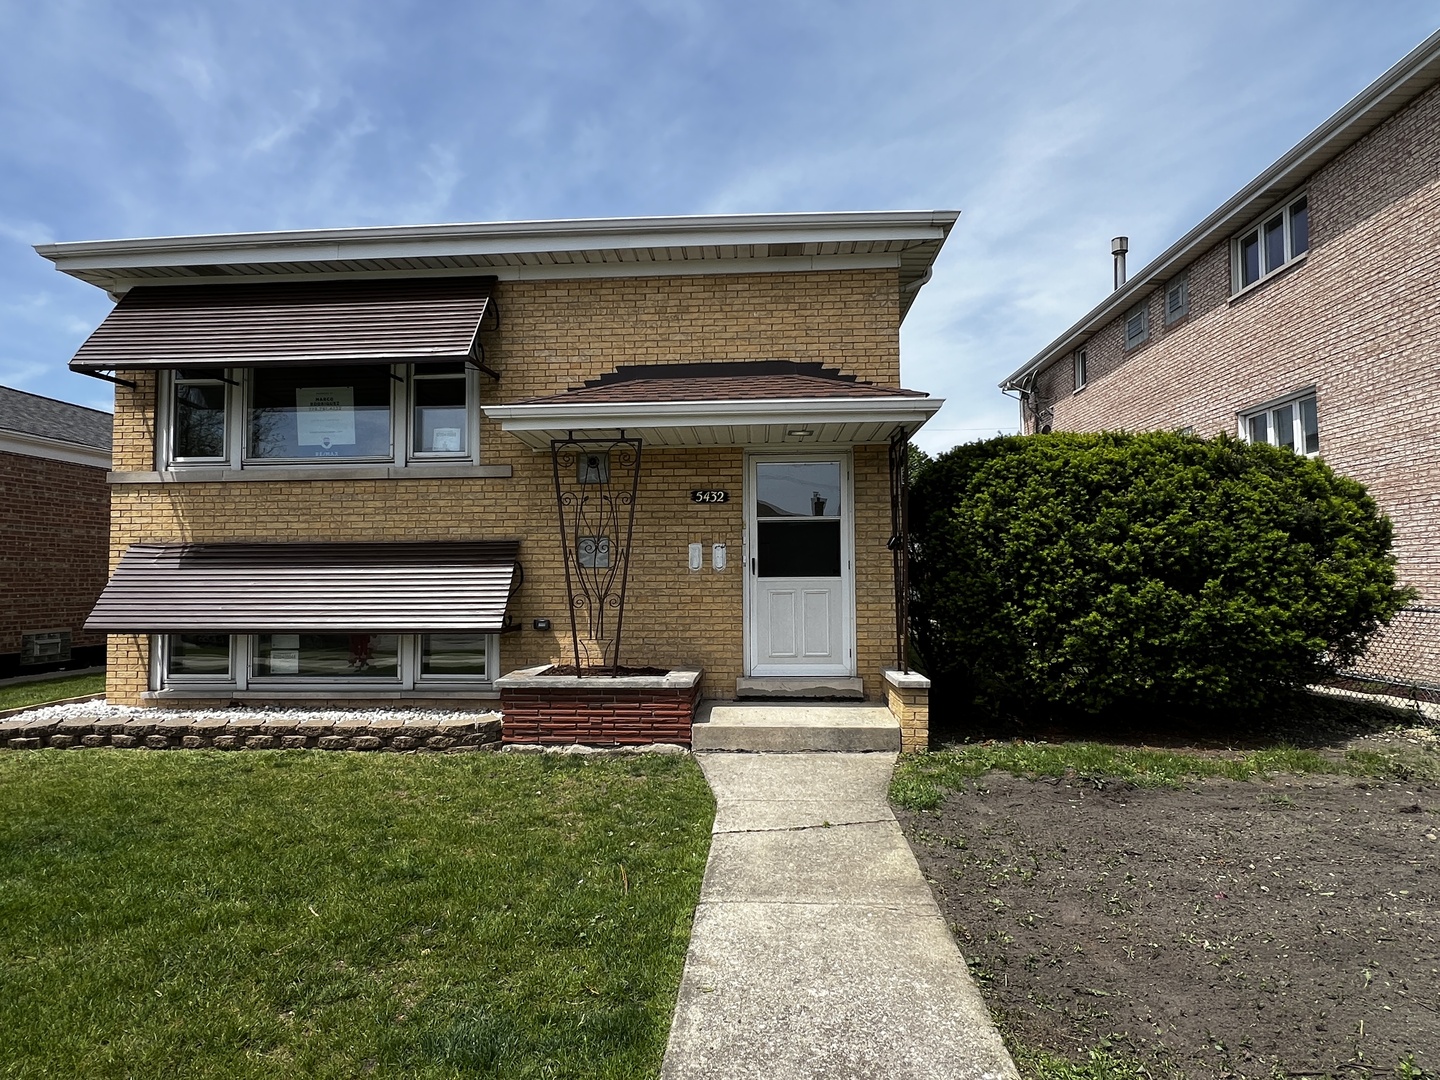
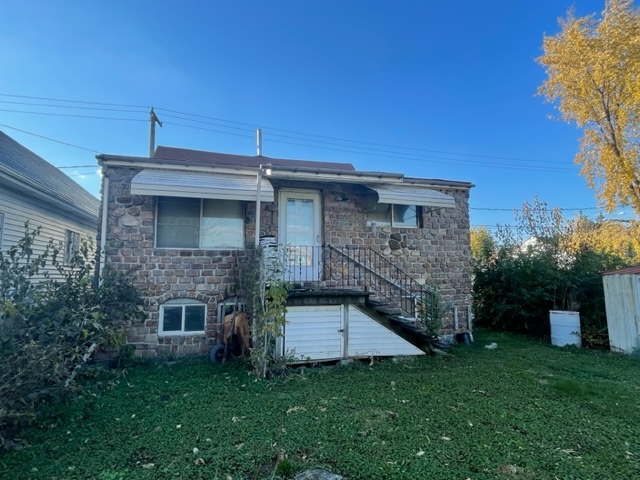
Active under contract
$499,000
5
bds
|
2
ba
|
0
sqft
|
built
1959
5432 S Long Ave, Chicago, IL 60638
$-956
Cash flow
-10.0%
Cash-on-Cash Return
3.4%
Cap rate
0.5%
Rent to Value Ratio
Active
$245,000
3
bds
|
2
ba
|
1,200
sqft
|
built
1963
5228 W 54th St, Chicago, IL 60638
$-3
Cash flow
-0.1%
Cash-on-Cash Return
5.7%
Cap rate
0.8%
Rent to Value Ratio
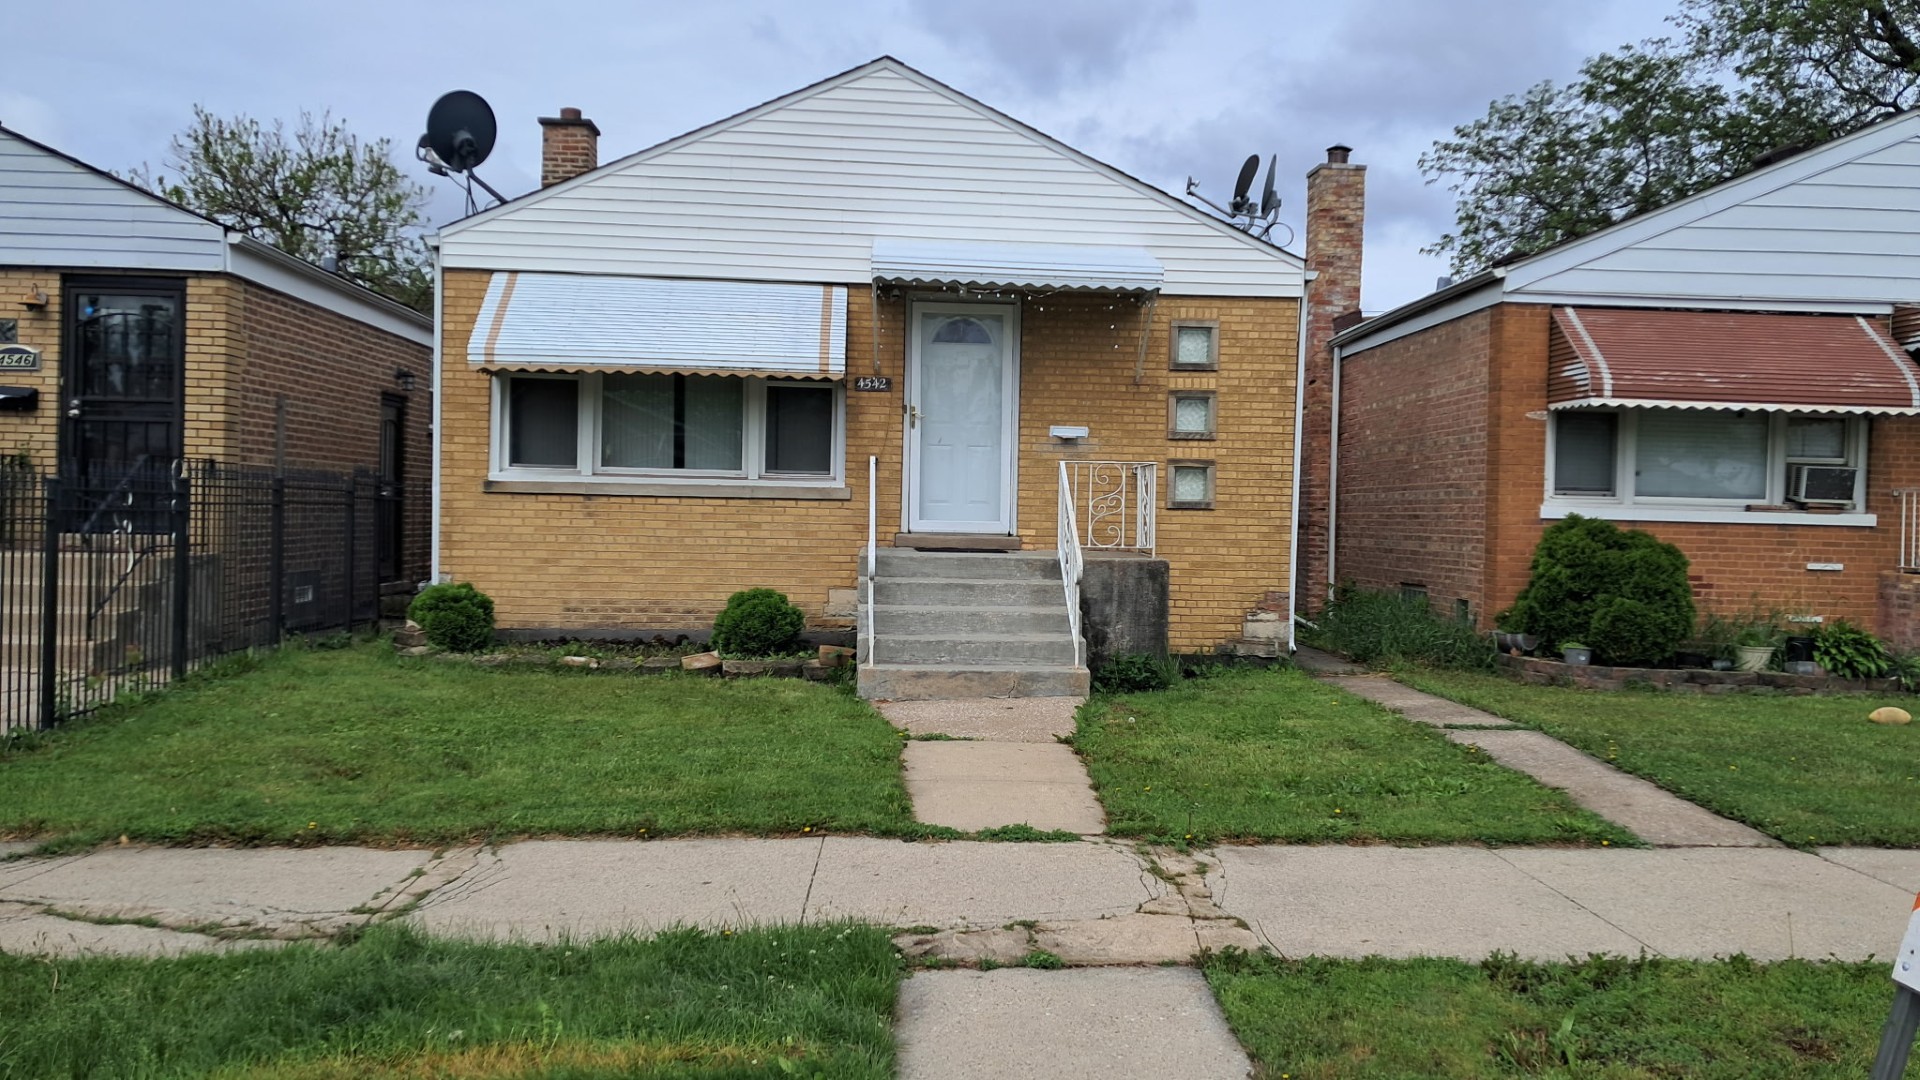
Active
$279,900
3
bds
|
1
ba
|
936
sqft
|
built
1969
4542 S Lamon Ave, Chicago, IL 60638
$-53
Cash flow
-1.0%
Cash-on-Cash Return
5.5%
Cap rate
0.8%
Rent to Value Ratio
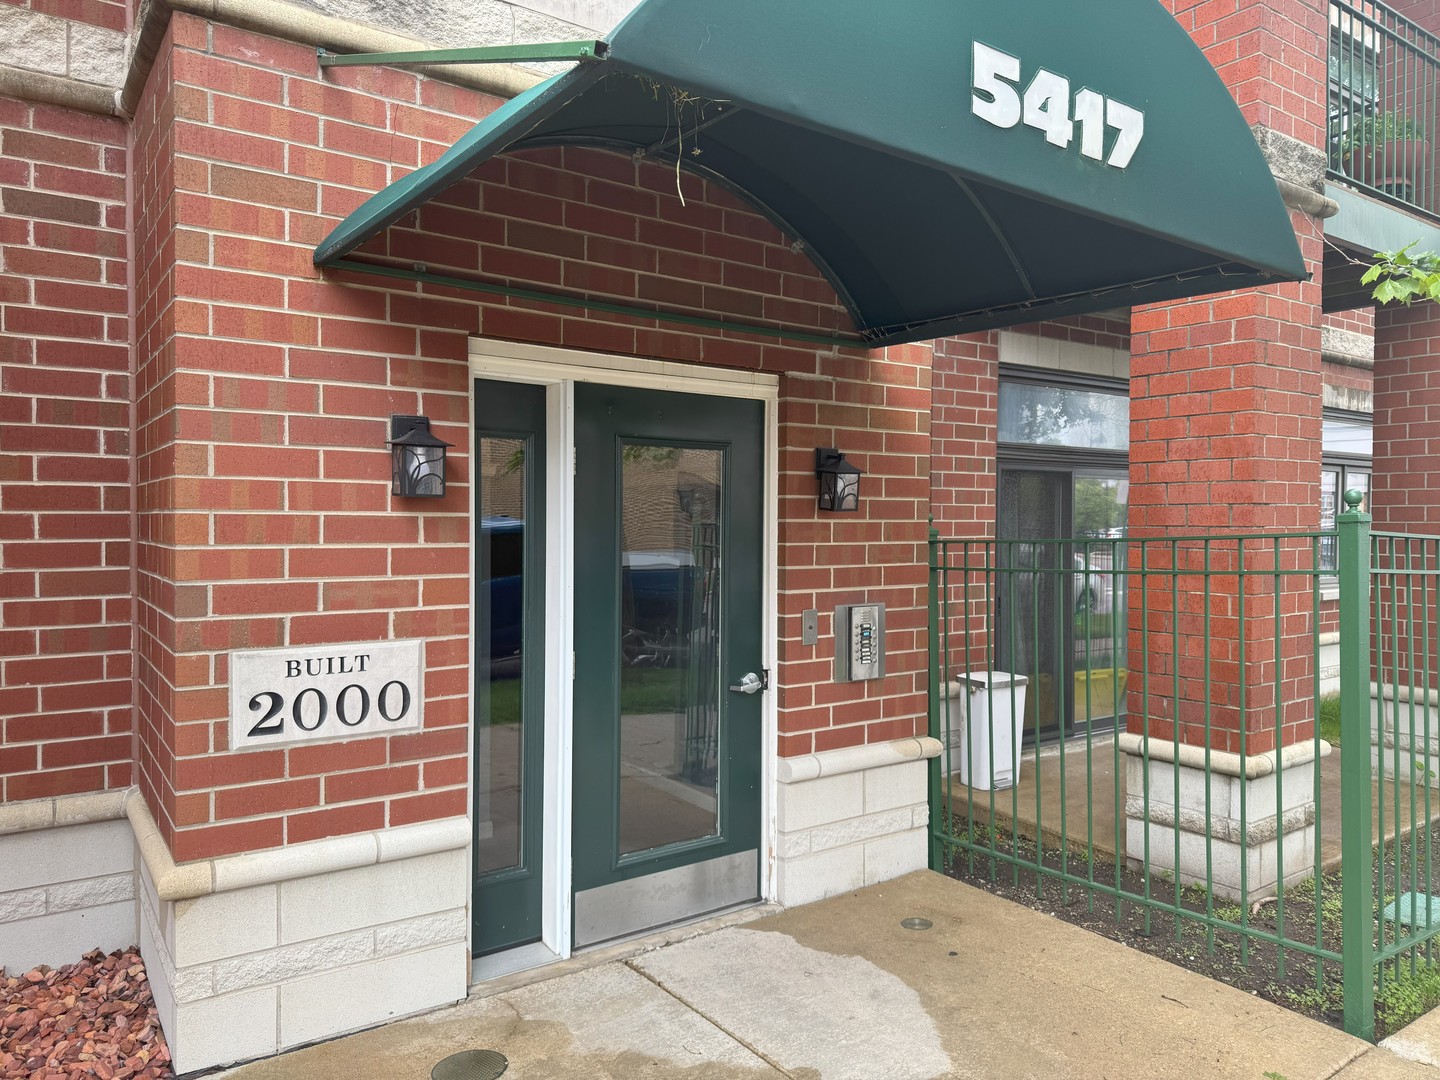
Active under contract
$259,900
2
bds
|
2
ba
|
950
sqft
|
built
2000
5417 S Melvina Ave, Chicago, IL 60638
$-482
Cash flow
-9.7%
Cash-on-Cash Return
3.5%
Cap rate
0.7%
Rent to Value Ratio
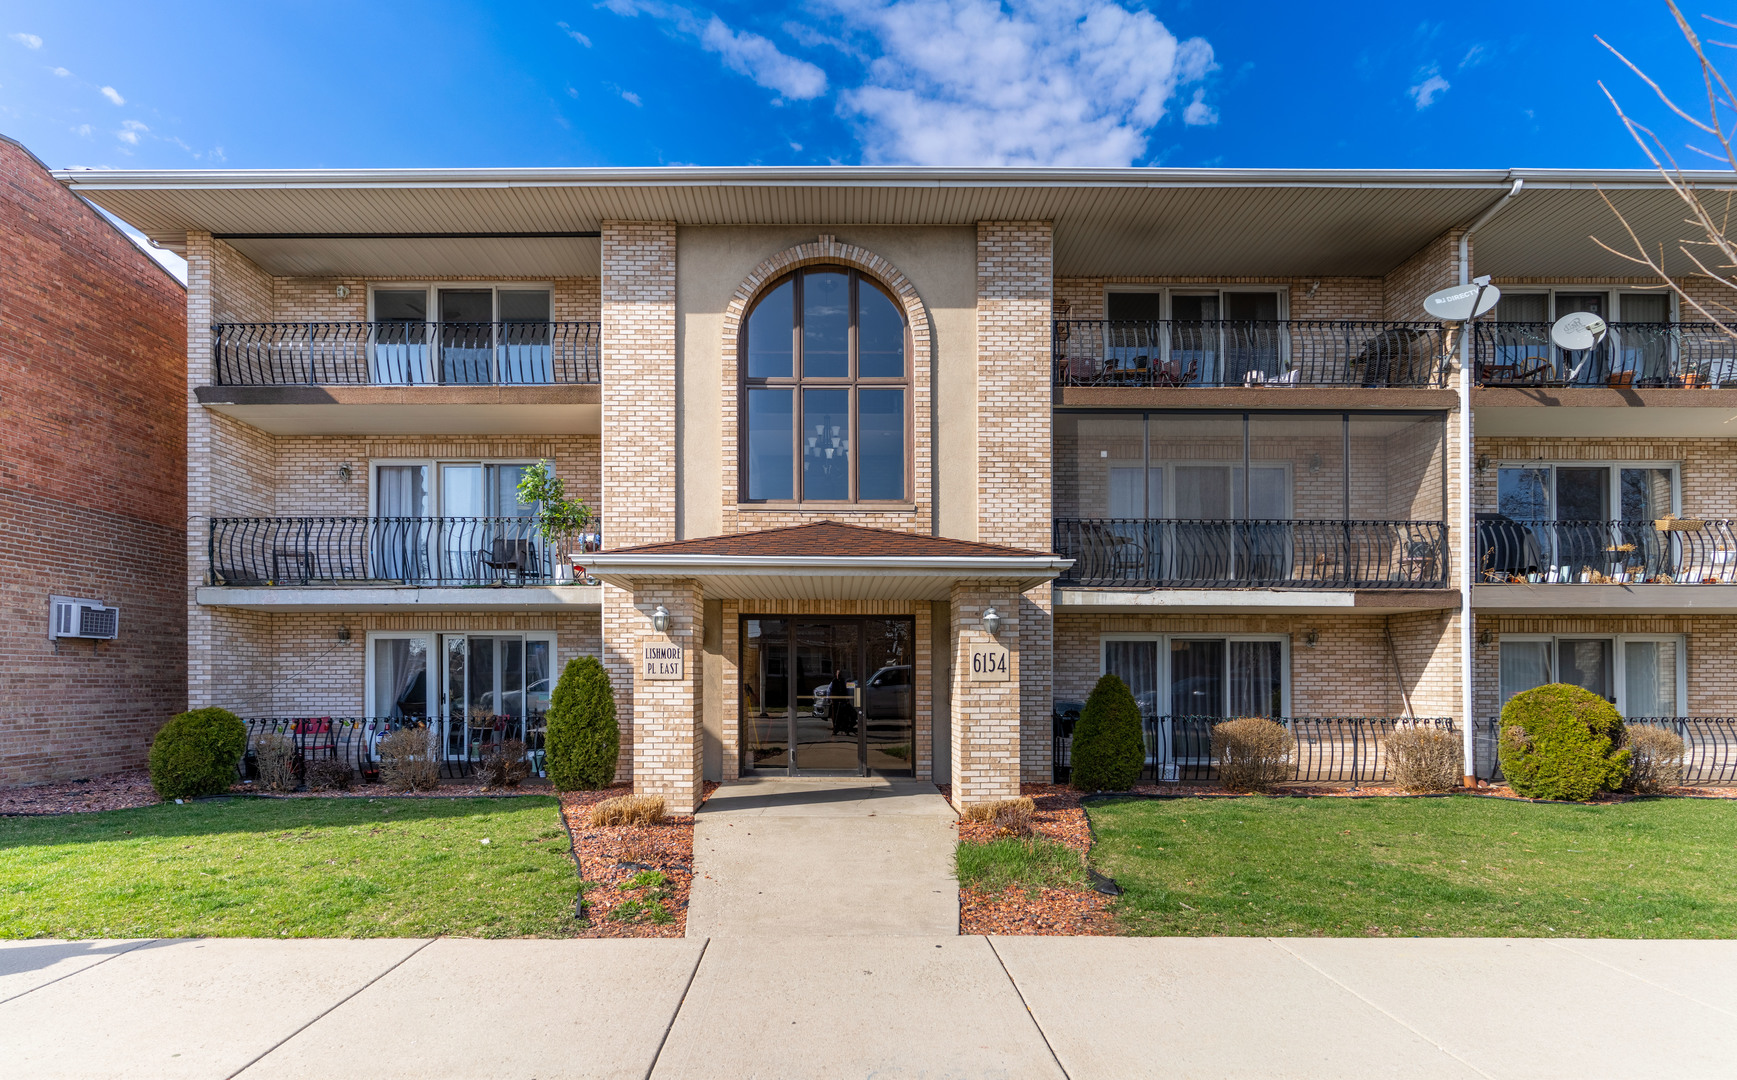
Active
$225,000
2
bds
|
2
ba
|
1,000
sqft
|
built
1996
6154 W 63rd St, Chicago, IL 60638
$-428
Cash flow
-9.9%
Cash-on-Cash Return
3.4%
Cap rate
0.8%
Rent to Value Ratio

Active
$499,900
3
bds
|
3
ba
|
3,163
sqft
|
built
1958
5743 W 63rd Pl, Chicago, IL 60638
$-354
Cash flow
-3.7%
Cash-on-Cash Return
4.8%
Cap rate
0.7%
Rent to Value Ratio
Active
$370,000
3
bds
|
1
ba
|
1,315
sqft
|
built
1962
5108 S Massasoit Ave, Chicago, IL 60638
$-290
Cash flow
-4.1%
Cash-on-Cash Return
4.7%
Cap rate
0.7%
Rent to Value Ratio
Active
$429,900
5
bds
|
3
ba
|
3,016
sqft
|
built
1957
4604 S Leamington Ave, Chicago, IL 60638
$334
Cash flow
4.1%
Cash-on-Cash Return
6.6%
Cap rate
0.9%
Rent to Value Ratio
Active
$369,900
3
bds
|
2
ba
|
1,100
sqft
|
built
1958
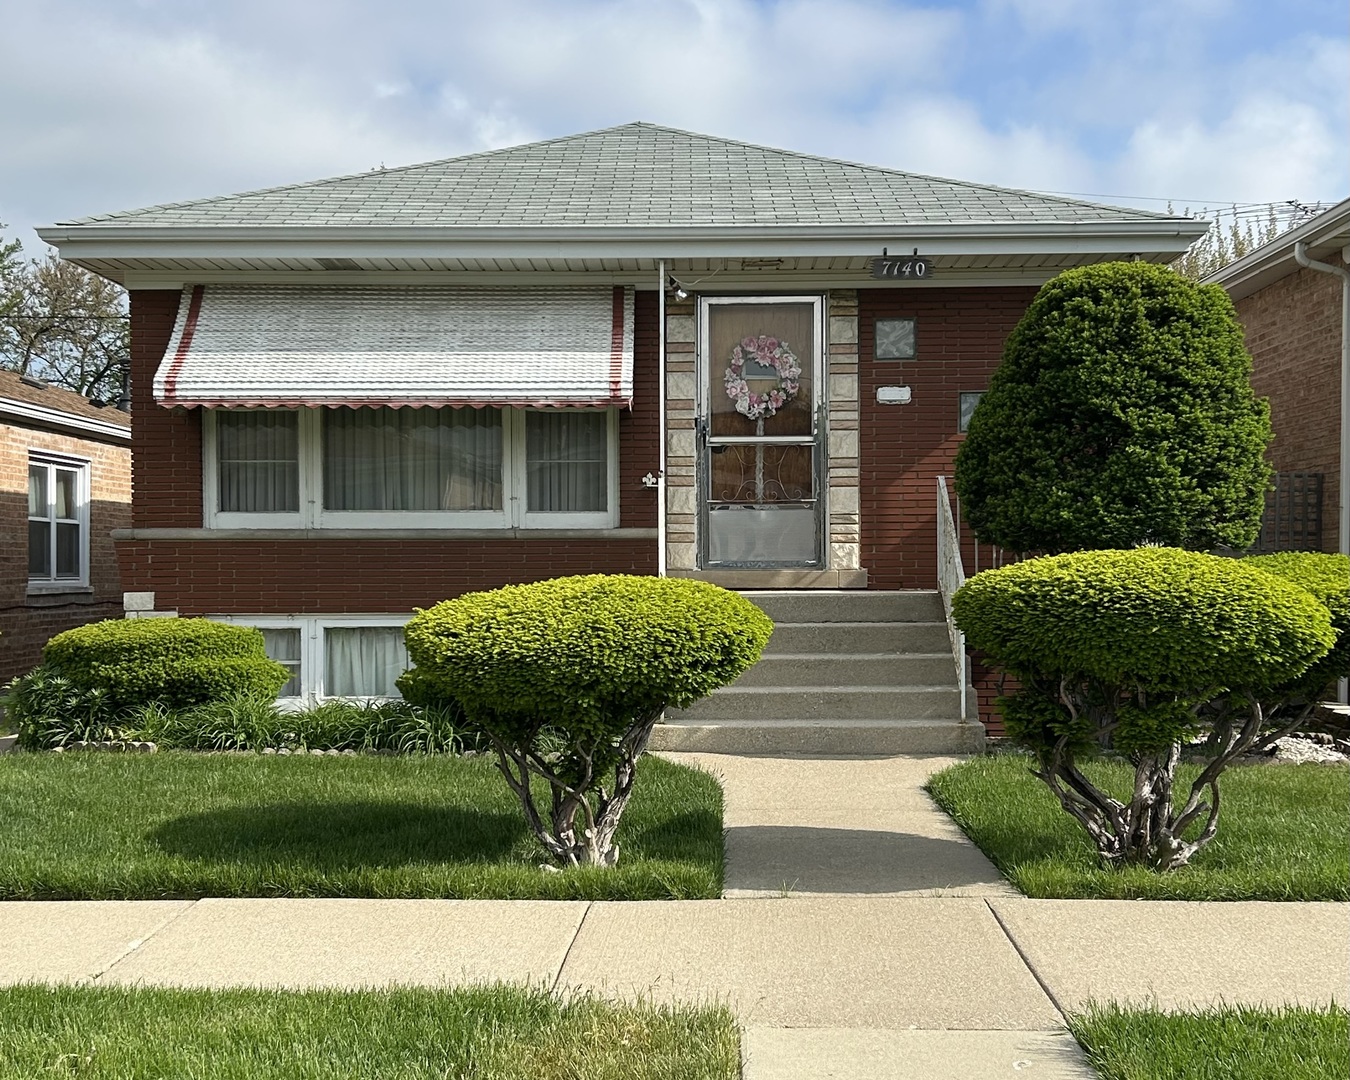
6436 S Lamon Ave, Chicago, IL 60638
$-62
Cash flow
-0.9%
Cash-on-Cash Return
5.5%
Cap rate
0.8%
Rent to Value Ratio
Active
$650,000
4
bds
|
5
ba
|
2,664
sqft
|
built
2003
5301 S Mobile Ave, Chicago, IL 60638
$-1,209
Cash flow
-9.7%
Cash-on-Cash Return
3.4%
Cap rate
0.6%
Rent to Value Ratio
Active
$379,988
2
bds
|
2
ba
|
1,000
sqft
|
built
1951
5533 S Menard Ave, Chicago, IL 60638
$-618
Cash flow
-8.5%
Cash-on-Cash Return
3.7%
Cap rate
0.6%
Rent to Value Ratio
Active
$375,000
4
bds
|
4
ba
|
1,985
sqft
|
built
1919
6238 S Massasoit Ave, Chicago, IL 60638
$-308
Cash flow
-4.3%
Cash-on-Cash Return
4.7%
Cap rate
0.7%
Rent to Value Ratio
Active
$449,000
4
bds
|
3
ba
|
0
sqft
|
built
1920
5237 S Long Ave, Chicago, IL 60638
$-340
Cash flow
-4.0%
Cash-on-Cash Return
4.8%
Cap rate
0.7%
Rent to Value Ratio
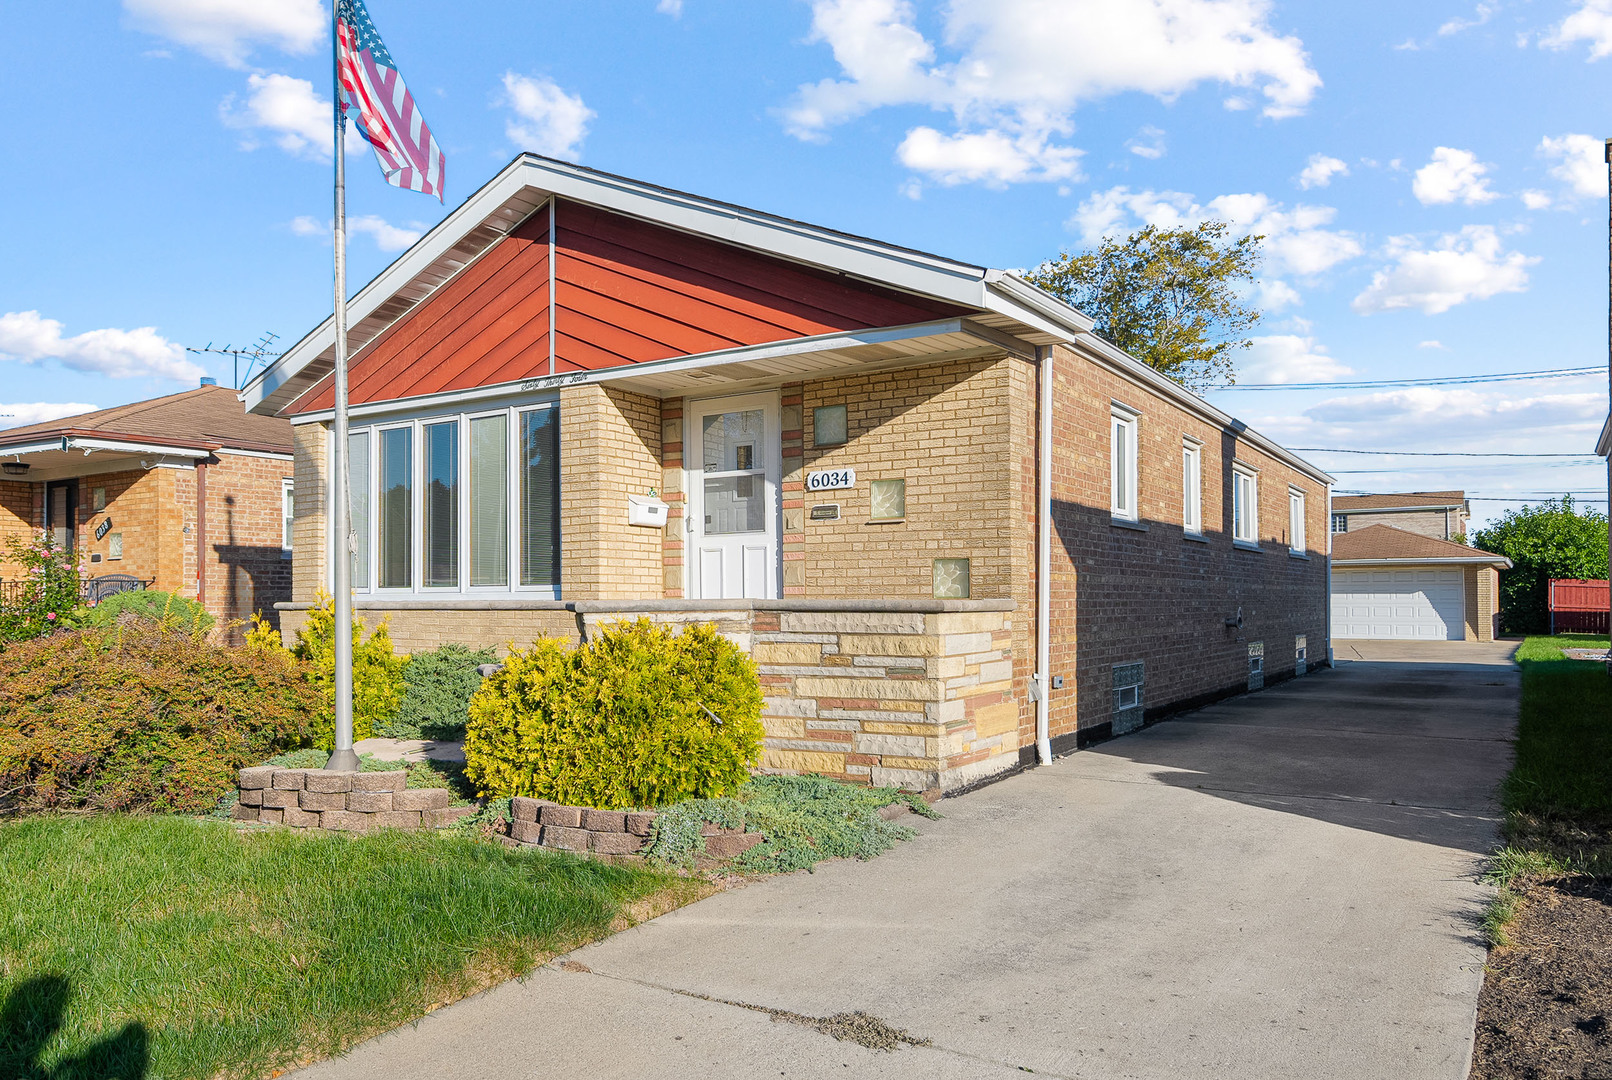
Active
$479,000
3
bds
|
2
ba
|
2,400
sqft
|
built
1959
6034 W 60th St, Chicago, IL 60638
$179
Cash flow
1.9%
Cash-on-Cash Return
6.1%
Cap rate
0.8%
Rent to Value Ratio
Active
$604,999
9
bds
|
4
ba
|
0
sqft
|
built
1913
5300 S Parkside Ave, Chicago, IL 60638
$-1,702
Cash flow
-14.7%
Cash-on-Cash Return
2.3%
Cap rate
0.4%
Rent to Value Ratio

Active under contract
$355,000
4
bds
|
2
ba
|
1,400
sqft
|
built
1954
6041 S Mc Vicker Ave, Chicago, IL 60638
$-423
Cash flow
-6.2%
Cash-on-Cash Return
4.2%
Cap rate
0.6%
Rent to Value Ratio