60647 Investment Properties for Sale
Browse homes for sale and investment properties in 60647. Refine your search by price, property type, or more.
Best cash flowing properties in 60647
Active
$140,000
1
bds
|
1
ba
|
0
sqft
|
built
1928
3604 W Dickens Ave, Chicago, IL 60647
$-99
Cash flow
-3.7%
Cash-on-Cash Return
5.4%
Cap rate
1.0%
Rent to Value Ratio

Active
$349,900
3
bds
|
1
ba
|
1,200
sqft
|
built
1911
2118 W North Ave, Chicago, IL 60647
$-448
Cash flow
-6.7%
Cash-on-Cash Return
4.1%
Cap rate
0.7%
Rent to Value Ratio
26 out of 33 properties for sale in 60647
Limited Results Shown
Create a free account, or log in to reveal all property listings and enjoy the complete experience.
Active
$725,000
2
bds
|
2
ba
|
0
sqft
|
built
2015
2125 N Mozart St, Chicago, IL 60647
$-1,704
Cash flow
-12.3%
Cash-on-Cash Return
3.4%
Cap rate
0.6%
Rent to Value Ratio
Active
$775,000
3
bds
|
3
ba
|
0
sqft
|
built
2015
3004 W Lyndale St, Chicago, IL 60647
$-2,171
Cash flow
-14.6%
Cash-on-Cash Return
2.9%
Cap rate
0.6%
Rent to Value Ratio
Active
$365,000
1
bds
|
1
ba
|
979
sqft
|
built
2002
1740 N Maplewood Ave, Chicago, IL 60647
$-976
Cash flow
-14.0%
Cash-on-Cash Return
3.1%
Cap rate
0.8%
Rent to Value Ratio
Active
$350,000
2
bds
|
2
ba
|
0
sqft
|
built
1929
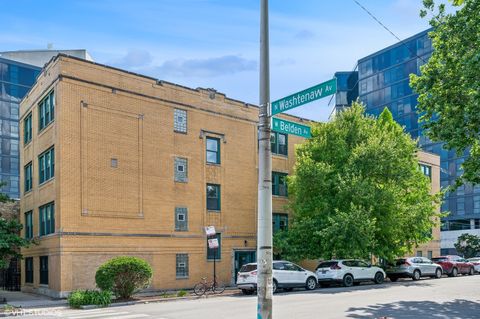
2709 W Belden Ave, Chicago, IL 60647
$-823
Cash flow
-12.3%
Cash-on-Cash Return
3.4%
Cap rate
0.8%
Rent to Value Ratio
Active
$949,500
3
bds
|
3
ba
|
2,200
sqft
|
built
2007
2047 N Leavitt St, Chicago, IL 60647
$-3,012
Cash flow
-16.6%
Cash-on-Cash Return
2.5%
Cap rate
0.5%
Rent to Value Ratio
Active
$349,900
3
bds
|
1
ba
|
1,200
sqft
|
built
1911
2118 W North Ave, Chicago, IL 60647
$-448
Cash flow
-6.7%
Cash-on-Cash Return
4.1%
Cap rate
0.7%
Rent to Value Ratio
Active
$360,000
3
bds
|
2
ba
|
1,500
sqft
|
built
1922
3707 W Altgeld St, Chicago, IL 60647
$-867
Cash flow
-12.6%
Cash-on-Cash Return
3.4%
Cap rate
0.7%
Rent to Value Ratio
Active
$995,000
3
bds
|
2
ba
|
2,669
sqft
|
built
1890
2035 W Charleston St, Chicago, IL 60647
$-4,309
Cash flow
-22.6%
Cash-on-Cash Return
1.1%
Cap rate
0.4%
Rent to Value Ratio
Active
$650,000
3
bds
|
3
ba
|
2,200
sqft
|
built
2005
1825 N Winnebago Ave, Chicago, IL 60647
$-1,835
Cash flow
-14.7%
Cash-on-Cash Return
2.9%
Cap rate
0.7%
Rent to Value Ratio
Active
$140,000
1
bds
|
1
ba
|
0
sqft
|
built
1928
3604 W Dickens Ave, Chicago, IL 60647
$-99
Cash flow
-3.7%
Cash-on-Cash Return
5.4%
Cap rate
1.0%
Rent to Value Ratio

Active
$510,000
2
bds
|
3
ba
|
0
sqft
|
built
1901
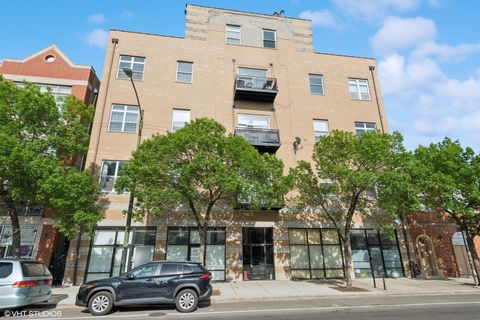
2150 W North Ave, Chicago, IL 60647
$-1,099
Cash flow
-11.2%
Cash-on-Cash Return
3.1%
Cap rate
0.6%
Rent to Value Ratio
Active
$712,500
3
bds
|
2
ba
|
1,836
sqft
|
built
2006
2140 W North Ave, Chicago, IL 60647
$-1,492
Cash flow
-10.9%
Cash-on-Cash Return
3.2%
Cap rate
0.6%
Rent to Value Ratio

Active
$399,900
2
bds
|
2
ba
|
1,074
sqft
|
built
1934
1847 N Kedzie Ave, Chicago, IL 60647
$-856
Cash flow
-11.2%
Cash-on-Cash Return
3.1%
Cap rate
0.6%
Rent to Value Ratio

Active
$249,900
1
bds
|
1
ba
|
596
sqft
|
built
1890
2233 W Shakespeare Ave, Chicago, IL 60647
$-559
Cash flow
-11.7%
Cash-on-Cash Return
3.0%
Cap rate
0.7%
Rent to Value Ratio
Active
$475,000
2
bds
|
2
ba
|
1,329
sqft
|
built
2007
3021 W Armitage Ave, Chicago, IL 60647
$-1,274
Cash flow
-14.0%
Cash-on-Cash Return
2.5%
Cap rate
0.7%
Rent to Value Ratio
Active
$824,900
2
bds
|
2
ba
|
0
sqft
|
built
2020
2237 N Hoyne Ave, Chicago, IL 60647
$-2,309
Cash flow
-14.6%
Cash-on-Cash Return
2.3%
Cap rate
0.5%
Rent to Value Ratio
Active
$799,900
3
bds
|
3
ba
|
0
sqft
|
built
2002
2330 W Armitage Ave, Chicago, IL 60647
$-1,923
Cash flow
-12.5%
Cash-on-Cash Return
2.8%
Cap rate
0.6%
Rent to Value Ratio
Active
$499,000
2
bds
|
2
ba
|
1,305
sqft
|
built
2009
2712 N Artesian Ave, Chicago, IL 60647
$-748
Cash flow
-7.8%
Cash-on-Cash Return
3.9%
Cap rate
0.7%
Rent to Value Ratio
Active
$575,000
3
bds
|
2
ba
|
0
sqft
|
built
2014
2624 W Armitage Ave, Chicago, IL 60647
$-1,382
Cash flow
-12.5%
Cash-on-Cash Return
2.8%
Cap rate
0.6%
Rent to Value Ratio
Active
$300,000
1
bds
|
1
ba
|
0
sqft
|
built
2007
2612 W Diversey Ave, Chicago, IL 60647
$-556
Cash flow
-9.7%
Cash-on-Cash Return
3.5%
Cap rate
0.8%
Rent to Value Ratio
Active
$600,000
2
bds
|
2
ba
|
0
sqft
|
built
2000
1625 N Western Ave, Chicago, IL 60647
$-1,880
Cash flow
-16.3%
Cash-on-Cash Return
1.9%
Cap rate
0.5%
Rent to Value Ratio
Active
$274,000
1
bds
|
1
ba
|
800
sqft
|
built
2004
2720 W Cortland St, Chicago, IL 60647
$-506
Cash flow
-9.6%
Cash-on-Cash Return
3.5%
Cap rate
0.7%
Rent to Value Ratio
Active
$635,000
3
bds
|
2
ba
|
1,800
sqft
|
built
1926
2222 W Diversey Ave, Chicago, IL 60647
$-798
Cash flow
-6.6%
Cash-on-Cash Return
4.2%
Cap rate
0.8%
Rent to Value Ratio
Active
$675,000
3
bds
|
2
ba
|
2,000
sqft
|
built
2015
2413 W Fullerton Ave, Chicago, IL 60647
$-985
Cash flow
-7.6%
Cash-on-Cash Return
3.9%
Cap rate
0.7%
Rent to Value Ratio
Active
$315,000
2
bds
|
2
ba
|
1,274
sqft
|
built
1917
1949 N Whipple St, Chicago, IL 60647
$-449
Cash flow
-7.4%
Cash-on-Cash Return
4.0%
Cap rate
0.9%
Rent to Value Ratio
Active
$255,000
2
bds
|
2
ba
|
1,200
sqft
|
built
1948
1939 N Sawyer Ave, Chicago, IL 60647
$-578
Cash flow
-11.8%
Cash-on-Cash Return
3.0%
Cap rate
0.8%
Rent to Value Ratio