63031 Investment Properties for Sale
Browse homes for sale and investment properties in 63031. Refine your search by price, property type, or more.
Best cash flowing properties in 63031
Active
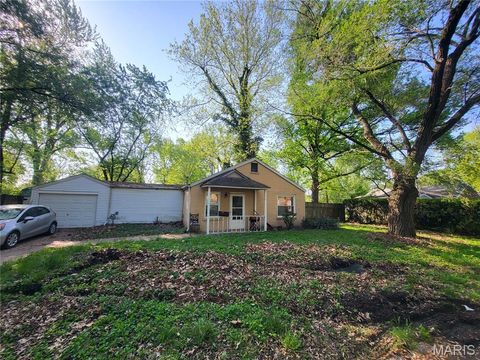
$75,000
3
bds
|
2
ba
|
1,328
sqft
|
built
1947
6 Charlotte Dr, Florissant, MO 63031
$568
Cash flow
39.5%
Cash-on-Cash Return
14.8%
Cap rate
2.1%
Rent to Value Ratio

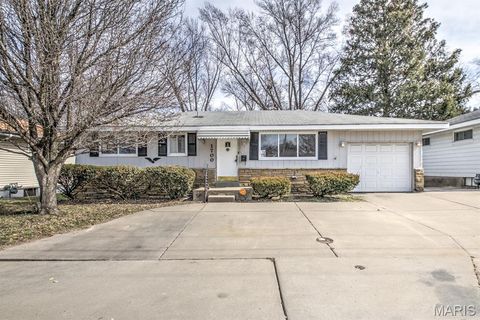
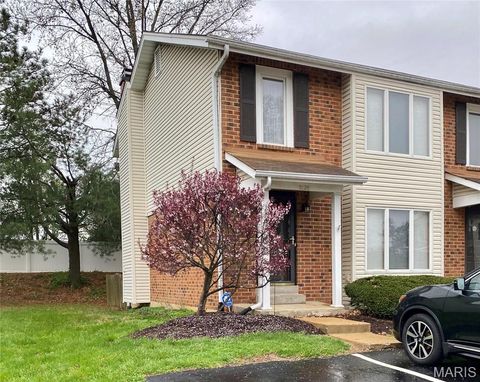
Active
$131,000
3
bds
|
1
ba
|
864
sqft
|
built
1954
150 Saint Daniel Ln, Florissant, MO 63031
$343
Cash flow
13.7%
Cash-on-Cash Return
8.8%
Cap rate
1.2%
Rent to Value Ratio
16 out of 58 properties for sale in 63031
Limited Results Shown
Create a free account, or log in to reveal all property listings and enjoy the complete experience.
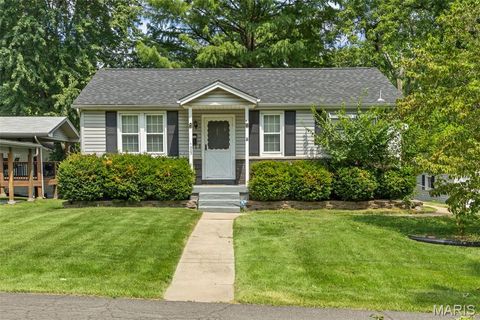
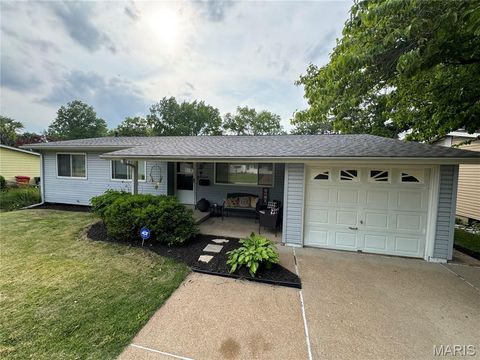
Active
$155,000
3
bds
|
2
ba
|
912
sqft
|
built
1960
1090 Howdershell Rd, Florissant, MO 63031
$77
Cash flow
2.6%
Cash-on-Cash Return
6.3%
Cap rate
1.0%
Rent to Value Ratio
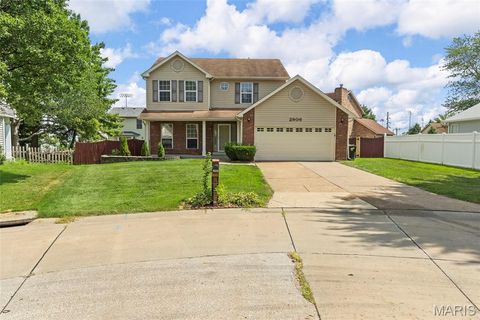
Active
$300,000
4
bds
|
4
ba
|
1,977
sqft
|
built
1989
2906 Russet Ct, Florissant, MO 63031
$-254
Cash flow
-4.4%
Cash-on-Cash Return
4.7%
Cap rate
0.7%
Rent to Value Ratio
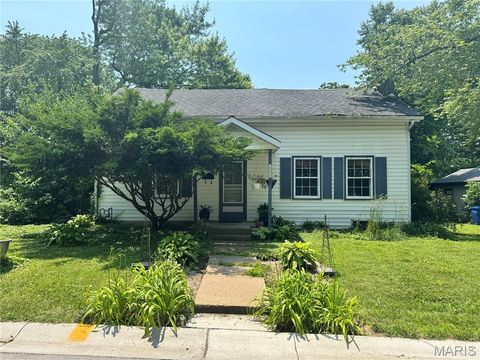
Active
$169,000
2
bds
|
2
ba
|
972
sqft
|
built
1950
1023 Saint Denis St, Florissant, MO 63031
$245
Cash flow
7.6%
Cash-on-Cash Return
7.4%
Cap rate
1.1%
Rent to Value Ratio
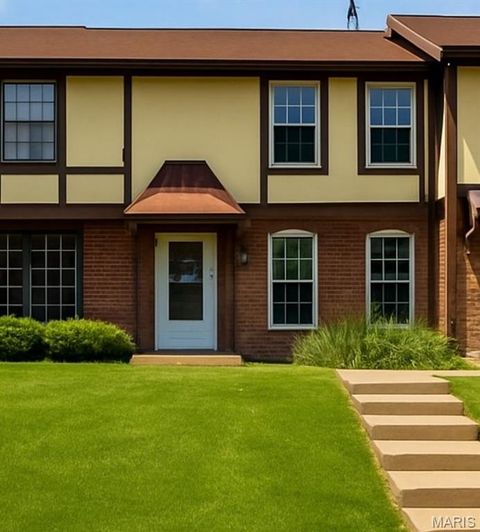
Active
$129,950
2
bds
|
2
ba
|
962
sqft
|
built
1956
1700 Patterson Rd, Florissant, MO 63031
$321
Cash flow
12.9%
Cash-on-Cash Return
8.6%
Cap rate
1.2%
Rent to Value Ratio
Active
$175,000
3
bds
|
1
ba
|
1,264
sqft
|
built
1956
840 La Crosse Dr, Florissant, MO 63031
$106
Cash flow
3.2%
Cash-on-Cash Return
6.4%
Cap rate
0.9%
Rent to Value Ratio
Active
$200,000
3
bds
|
1
ba
|
1,588
sqft
|
built
1939
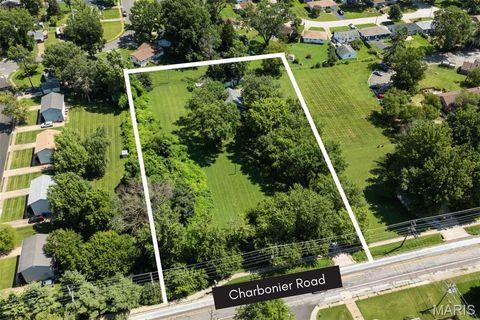
1625 Charbonier Rd, Florissant, MO 63031
$10
Cash flow
0.3%
Cash-on-Cash Return
5.7%
Cap rate
0.9%
Rent to Value Ratio
Active
$165,000
2
bds
|
1
ba
|
864
sqft
|
built
1947
14 Saint Martha Ct, Florissant, MO 63031
$189
Cash flow
6.0%
Cash-on-Cash Return
7.1%
Cap rate
1.0%
Rent to Value Ratio
Active
$126,900
2
bds
|
1
ba
|
791
sqft
|
built
1950
1210 Saint Richard Dr, Florissant, MO 63031
$310
Cash flow
12.7%
Cash-on-Cash Return
8.6%
Cap rate
1.2%
Rent to Value Ratio
Active
$106,000
2
bds
|
2
ba
|
1,298
sqft
|
built
1986
2128 Friendship Ct, Florissant, MO 63031
$100
Cash flow
4.9%
Cash-on-Cash Return
6.8%
Cap rate
1.3%
Rent to Value Ratio
Active
$204,900
3
bds
|
2
ba
|
1,078
sqft
|
built
1963
2455 S Park Ln, Florissant, MO 63031
$67
Cash flow
1.7%
Cash-on-Cash Return
6.1%
Cap rate
0.9%
Rent to Value Ratio
Active
$105,000
1
bds
|
1
ba
|
0
sqft
|
built
1900
1290 Saint Louis St, Florissant, MO 63031
$324
Cash flow
16.1%
Cash-on-Cash Return
9.4%
Cap rate
1.3%
Rent to Value Ratio
Active
$239,000
3
bds
|
2
ba
|
1,161
sqft
|
built
1968
2186 Aristocrat Dr, Florissant, MO 63031
$-359
Cash flow
-7.8%
Cash-on-Cash Return
3.9%
Cap rate
0.6%
Rent to Value Ratio
Active
$114,900
3
bds
|
2
ba
|
1,900
sqft
|
built
1974
619 Rosetta Dr, Florissant, MO 63031
$-50
Cash flow
-2.3%
Cash-on-Cash Return
5.2%
Cap rate
1.2%
Rent to Value Ratio
Active
$290,000
4
bds
|
3
ba
|
1,432
sqft
|
built
1988
549 Rancho Ln, Florissant, MO 63031
$-35
Cash flow
-0.6%
Cash-on-Cash Return
5.5%
Cap rate
0.8%
Rent to Value Ratio