70125 Investment Properties for Sale
Browse homes for sale and investment properties in 70125. Refine your search by price, property type, or more.
Best cash flowing properties in 70125

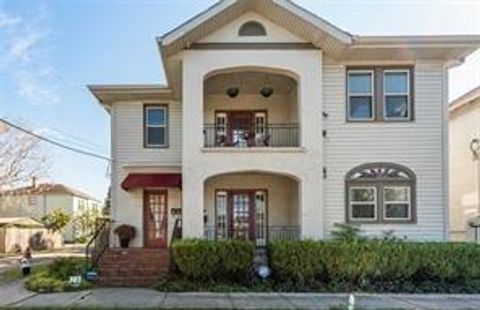
Active
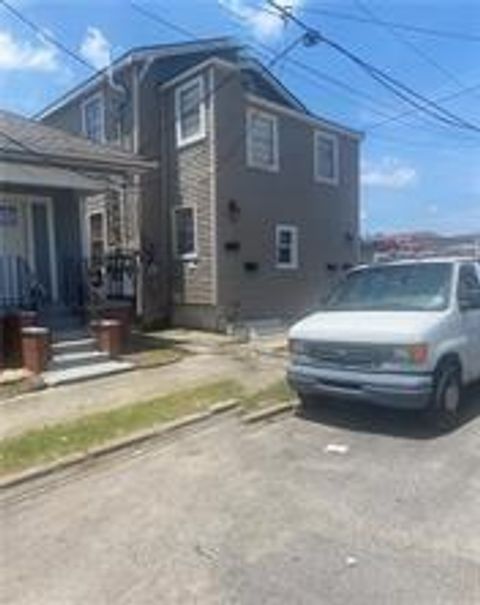
$235,000
4
bds
|
0
ba
|
1,590
sqft
|
built
1920
3309 4th St, New Orleans, LA 70125
$-8
Cash flow
-0.2%
Cash-on-Cash Return
5.6%
Cap rate
0.7%
Rent to Value Ratio

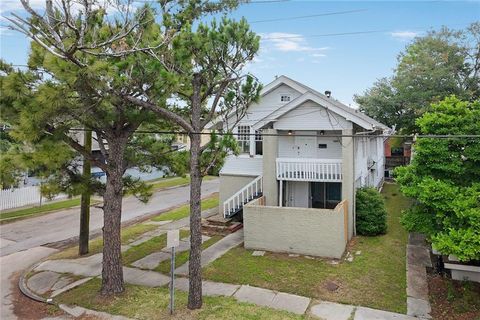
Active
$249,000
4
bds
|
0
ba
|
1,605
sqft
|
built
1920
3717 S Johnson St, New Orleans, LA 70125
$-74
Cash flow
-1.6%
Cash-on-Cash Return
5.3%
Cap rate
0.6%
Rent to Value Ratio
13 out of 46 properties for sale in 70125
Limited Results Shown
Create a free account, or log in to reveal all property listings and enjoy the complete experience.
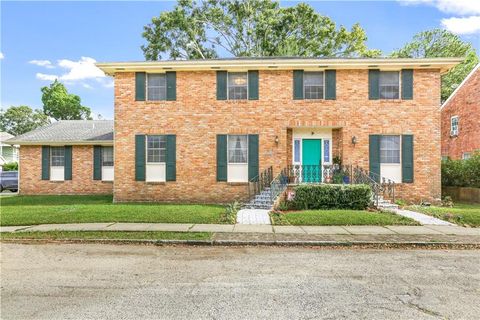
Active
$450,000
4
bds
|
0
ba
|
2,100
sqft
|
built
1939
3929 Octavia St, New Orleans, LA 70125
$-888
Cash flow
-10.3%
Cash-on-Cash Return
3.3%
Cap rate
0.4%
Rent to Value Ratio

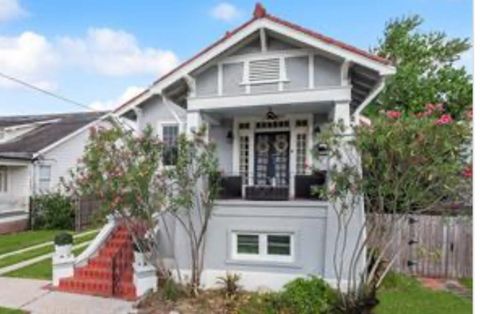
Active
$499,000
6
bds
|
0
ba
|
3,522
sqft
|
built
1933
5524 S Galvez St, New Orleans, LA 70125
$-636
Cash flow
-6.6%
Cash-on-Cash Return
4.1%
Cap rate
0.5%
Rent to Value Ratio
Active
$249,000
4
bds
|
0
ba
|
1,605
sqft
|
built
1920
3717 S Johnson St, New Orleans, LA 70125
$-74
Cash flow
-1.6%
Cash-on-Cash Return
5.3%
Cap rate
0.6%
Rent to Value Ratio

Active
$600,000
6
bds
|
0
ba
|
3,593
sqft
|
built
1933
7018 S Claiborne Ave, New Orleans, LA 70125
$-2,149
Cash flow
-18.7%
Cash-on-Cash Return
1.4%
Cap rate
0.2%
Rent to Value Ratio
Active
$235,000
4
bds
|
0
ba
|
1,590
sqft
|
built
1920
3309 4th St, New Orleans, LA 70125
$-8
Cash flow
-0.2%
Cash-on-Cash Return
5.6%
Cap rate
0.7%
Rent to Value Ratio
Active
$499,000
5
bds
|
0
ba
|
2,500
sqft
|
built
1942
3031 Jena St, New Orleans, LA 70125
$-774
Cash flow
-8.1%
Cash-on-Cash Return
3.8%
Cap rate
0.5%
Rent to Value Ratio
Active
$425,000
6
bds
|
0
ba
|
3,276
sqft
|
built
1950
3025 Jefferson Ave, New Orleans, LA 70125
$-631
Cash flow
-7.7%
Cash-on-Cash Return
3.9%
Cap rate
0.5%
Rent to Value Ratio
Active
$647,000
5
bds
|
0
ba
|
3,236
sqft
|
built
1933
3015 Nashville Ave, New Orleans, LA 70125
$-371
Cash flow
-3.0%
Cash-on-Cash Return
5.0%
Cap rate
0.6%
Rent to Value Ratio
Active
$369,000
9
bds
|
0
ba
|
3,358
sqft
|
built
2007
4116 Thalia St, New Orleans, LA 70125
$-642
Cash flow
-9.1%
Cash-on-Cash Return
3.6%
Cap rate
0.4%
Rent to Value Ratio
Active
$339,000
6
bds
|
0
ba
|
2,584
sqft
|
built
1920
3909 4th St, New Orleans, LA 70125
$-638
Cash flow
-9.8%
Cash-on-Cash Return
3.4%
Cap rate
0.4%
Rent to Value Ratio
Active
$375,000
6
bds
|
0
ba
|
3,000
sqft
|
built
2018
3111 Louisiana Avenue Pkwy, New Orleans, LA 70125
$-257
Cash flow
-3.6%
Cash-on-Cash Return
4.9%
Cap rate
0.6%
Rent to Value Ratio
Active
$615,000
8
bds
|
0
ba
|
3,908
sqft
|
built
1970
2933 Pine St, New Orleans, LA 70125
$-1,944
Cash flow
-16.5%
Cash-on-Cash Return
1.9%
Cap rate
0.2%
Rent to Value Ratio

Active
$425,000
6
bds
|
0
ba
|
4,074
sqft
|
built
1985
3231 Milan St, New Orleans, LA 70125
$-907
Cash flow
-11.1%
Cash-on-Cash Return
3.1%
Cap rate
0.4%
Rent to Value Ratio