70360 Investment Properties for Sale
Browse homes for sale and investment properties in 70360. Refine your search by price, property type, or more.
Best cash flowing properties in 70360
Active
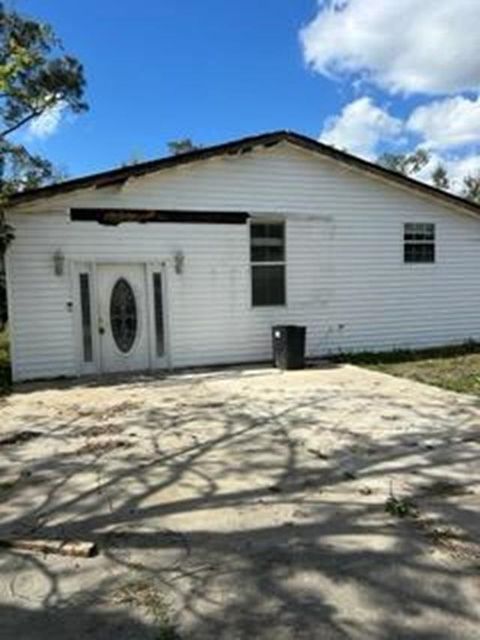
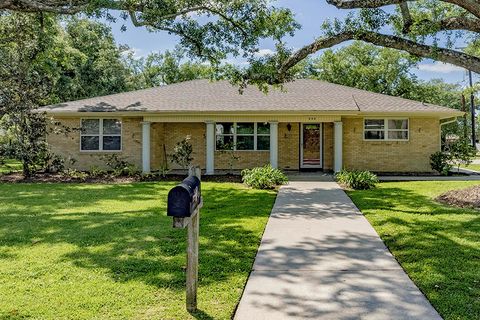
$60,000
3
bds
|
2
ba
|
1,842
sqft
|
built
2000
419 Hanson Dr, Houma, LA 70360
$966
Cash flow
18.8%
Cash-on-Cash Return
19.3%
Cap rate
2.3%
Rent to Value Ratio
Active
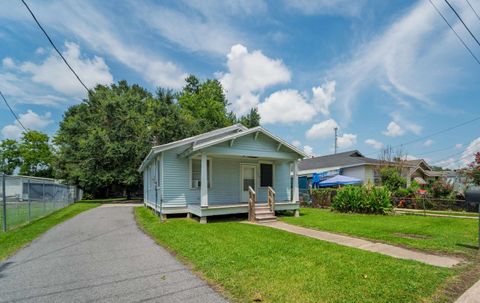
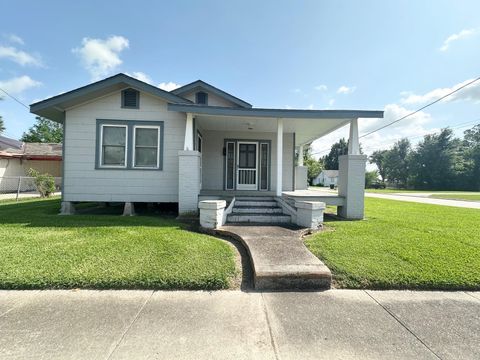
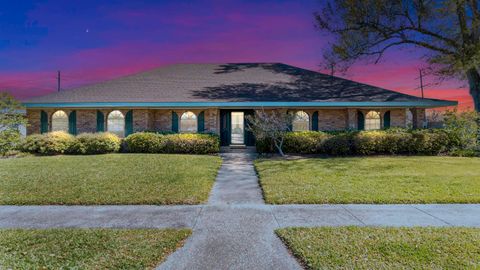
$79,000
3
bds
|
1
ba
|
937
sqft
|
built
1956
1318 Lafayette St, Houma, LA 70360
$592
Cash flow
39.1%
Cash-on-Cash Return
14.7%
Cap rate
1.8%
Rent to Value Ratio
111 out of 126 properties for sale in 70360
Limited Results Shown
Create a free account, or log in to reveal all property listings and enjoy the complete experience.
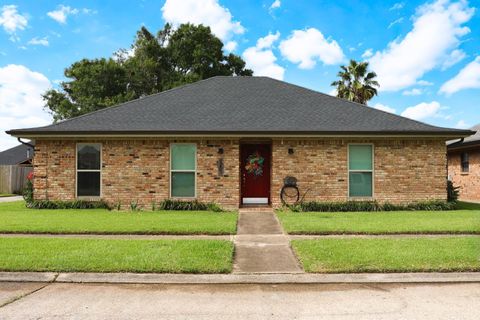
Active
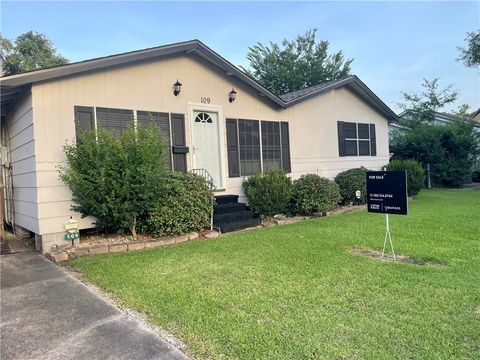
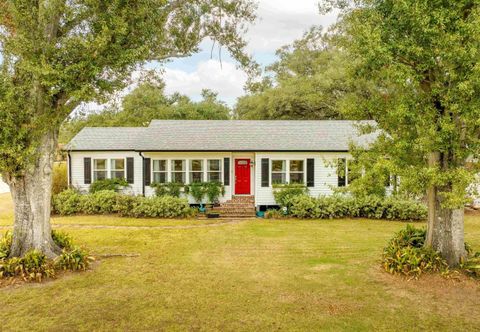
$145,000
3
bds
|
1
ba
|
1,132
sqft
|
built
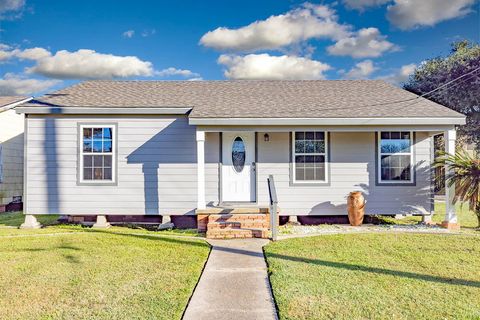
1957
109 Rosewood Dr, Houma, LA 70360
$211
Cash flow
7.6%
Cash-on-Cash Return
7.4%
Cap rate
0.9%
Rent to Value Ratio

Active
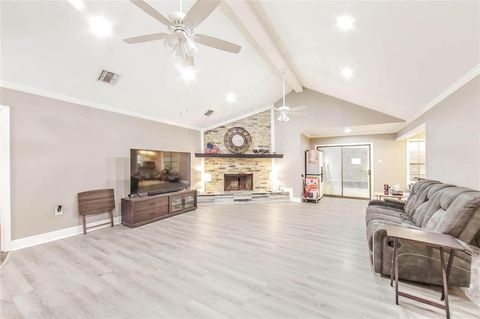
$279,000
5
bds
|
3
ba
|
2,710
sqft
|
built
1957
11 Austin Dr, Houma, LA 70360
$129
Cash flow
2.4%
Cash-on-Cash Return
6.2%
Cap rate
0.8%
Rent to Value Ratio
Active
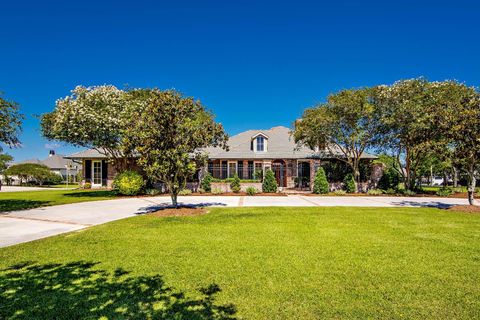
$325,000
5
bds
|
4
ba
|
2,511
sqft
|
built
1984
208 Chantilly Dr, Houma, LA 70360
$-434
Cash flow
-7.0%
Cash-on-Cash Return
4.1%
Cap rate
0.5%
Rent to Value Ratio
Active
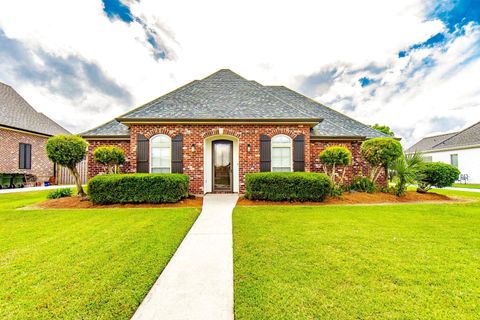
$340,000
3
bds
|
2
ba
|
1,801
sqft
|
built
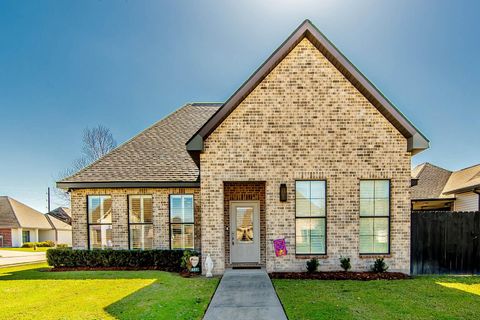
2015
327 Shelby Claire Dr, Houma, LA 70360
$-229
Cash flow
-3.5%
Cash-on-Cash Return
4.9%
Cap rate
0.6%
Rent to Value Ratio
Active
$584,500
5
bds
|
4
ba
|
3,305
sqft
|
built
2014
256 Riverwood Dr, Houma, LA 70360
$-1,179
Cash flow
-10.5%
Cash-on-Cash Return
3.3%
Cap rate
0.4%
Rent to Value Ratio
Active
$170,000
3
bds
|
2
ba
|
1,516
sqft
|
built
1969
101 Windham Dr, Houma, LA 70360
$300
Cash flow
9.2%
Cash-on-Cash Return
7.8%
Cap rate
0.9%
Rent to Value Ratio
Active
$3,400,000
4
bds
|
7
ba
|
8,841
sqft
|
built
2014
1 Glen Oaks Dr, Houma, LA 70360
$-14,448
Cash flow
-22.2%
Cash-on-Cash Return
0.6%
Cap rate
0.1%
Rent to Value Ratio

Active
$169,500
4
bds
|
2
ba
|
1,601
sqft
|
built
1958
901 Liberty St, Houma, LA 70360
$164
Cash flow
5.0%
Cash-on-Cash Return
6.8%
Cap rate
0.8%
Rent to Value Ratio
Active
$258,000
3
bds
|
2
ba
|
2,021
sqft
|
built
1979
214 Lake Crescent Cir, Houma, LA 70360
$-117
Cash flow
-2.4%
Cash-on-Cash Return
5.1%
Cap rate
0.6%
Rent to Value Ratio
Active
$718,000
3
bds
|
3
ba
|
2,796
sqft
|
built
2007
133 Rue St Rachel, Houma, LA 70360
$-1,880
Cash flow
-13.7%
Cash-on-Cash Return
2.5%
Cap rate
0.3%
Rent to Value Ratio
Active
$750,000
4
bds
|
4
ba
|
3,720
sqft
|
built
1832
629 Verret St, Houma, LA 70360
$-1,824
Cash flow
-12.7%
Cash-on-Cash Return
2.8%
Cap rate
0.3%
Rent to Value Ratio
Active
$699,000
5
bds
|
4
ba
|
3,634
sqft
|
built
1916
631 Verret St, Houma, LA 70360
$-1,376
Cash flow
-10.3%
Cash-on-Cash Return
3.3%
Cap rate
0.4%
Rent to Value Ratio
Active
$169,900
3
bds
|
1
ba
|
1,290
sqft
|
built
1975
312 South St, Houma, LA 70360
$162
Cash flow
5.0%
Cash-on-Cash Return
6.8%
Cap rate
0.8%
Rent to Value Ratio
Active
$1,597,000
4
bds
|
4
ba
|
5,455
sqft
|
built
1980
3807 Highway 311, Houma, LA 70360
$-5,832
Cash flow
-19.1%
Cash-on-Cash Return
1.3%
Cap rate
0.2%
Rent to Value Ratio
Active
$750,000
4
bds
|
4
ba
|
4,182
sqft
|
built
1973
3902 Southdown Mandalay Rd, Houma, LA 70360
$-1,962
Cash flow
-13.6%
Cash-on-Cash Return
2.5%
Cap rate
0.3%
Rent to Value Ratio
Active
$625,000
6
bds
|
4
ba
|
5,604
sqft
|
built
1984
120 Whitfield Ct, Houma, LA 70360
$-1,854
Cash flow
-15.5%
Cash-on-Cash Return
2.1%
Cap rate
0.3%
Rent to Value Ratio
Active
$1,179,500
4
bds
|
6
ba
|
3,850
sqft
|
built
2006
114 Bocage Dr, Houma, LA 70360
$-2,284
Cash flow
-10.1%
Cash-on-Cash Return
3.4%
Cap rate
0.4%
Rent to Value Ratio
Active
$399,000
4
bds
|
2
ba
|
2,633
sqft
|
built
1940
512 Buena Vista Blvd, Houma, LA 70360
$-577
Cash flow
-7.5%
Cash-on-Cash Return
3.9%
Cap rate
0.5%
Rent to Value Ratio
Active
$149,500
3
bds
|
2
ba
|
1,413
sqft
|
built
1950
1300 Honduras St, Houma, LA 70360
$259
Cash flow
9.0%
Cash-on-Cash Return
7.8%
Cap rate
0.9%
Rent to Value Ratio
Active
$649,900
3
bds
|
4
ba
|
2,371
sqft
|
built
2010
256 Tulip Dr, Houma, LA 70360
$-1,558
Cash flow
-12.5%
Cash-on-Cash Return
2.8%
Cap rate
0.3%
Rent to Value Ratio
Active
$300,000
4
bds
|
3
ba
|
1,863
sqft
|
built
2009
155 Camille St, Houma, LA 70360
$-40
Cash flow
-0.7%
Cash-on-Cash Return
5.5%
Cap rate
0.7%
Rent to Value Ratio
Active
$459,000
6
bds
|
4
ba
|
2,554
sqft
|
built
1996
113 Nottingham Trl, Houma, LA 70360
$-792
Cash flow
-9.0%
Cash-on-Cash Return
3.6%
Cap rate
0.4%
Rent to Value Ratio
Active
$1,650,000
5
bds
|
9
ba
|
9,441
sqft
|
built
1982
444 Oak Alley Dr, Houma, LA 70360
$-4,387
Cash flow
-13.9%
Cash-on-Cash Return
2.5%
Cap rate
0.3%
Rent to Value Ratio
Active
$524,000
3
bds
|
2
ba
|
1,841
sqft
|
built
2018
201 Rue Christe, Houma, LA 70360
$-962
Cash flow
-9.6%
Cash-on-Cash Return
3.5%
Cap rate
0.4%
Rent to Value Ratio
Active
$359,000
3
bds
|
2
ba
|
2,049
sqft
|
built
1998
103 Aubrey Dr, Houma, LA 70360
$-526
Cash flow
-7.6%
Cash-on-Cash Return
3.9%
Cap rate
0.5%
Rent to Value Ratio
Active
$882,000
5
bds
|
4
ba
|
3,076
sqft
|
built
2014
338 Tulip Dr, Houma, LA 70360
$-2,449
Cash flow
-14.5%
Cash-on-Cash Return
2.3%
Cap rate
0.3%
Rent to Value Ratio
Active
$204,900
4
bds
|
2
ba
|
2,040
sqft
|
built
1964
202 Dale St, Houma, LA 70360
$65
Cash flow
1.7%
Cash-on-Cash Return
6.1%
Cap rate
0.7%
Rent to Value Ratio
Active
$435,000
3
bds
|
3
ba
|
2,368
sqft
|
built
2012
324 Inglewood Way, Houma, LA 70360
$-334
Cash flow
-4.0%
Cash-on-Cash Return
4.8%
Cap rate
0.6%
Rent to Value Ratio
Active
$330,000
4
bds
|
3
ba
|
2,448
sqft
|
built
2003
135 Autumn Dr, Houma, LA 70360
$-44
Cash flow
-0.7%
Cash-on-Cash Return
5.5%
Cap rate
0.7%
Rent to Value Ratio
Active
$299,000
3
bds
|
3
ba
|
2,646
sqft
|
built
1958
600 Buena Vista Blvd, Houma, LA 70360
$-173
Cash flow
-3.0%
Cash-on-Cash Return
5.0%
Cap rate
0.6%
Rent to Value Ratio
Active
$350,000
4
bds
|
3
ba
|
3,224
sqft
|
built
1979
505 Corpus Christi Dr, Houma, LA 70360
$-138
Cash flow
-2.1%
Cash-on-Cash Return
5.2%
Cap rate
0.6%
Rent to Value Ratio
Active
$239,900
3
bds
|
2
ba
|
1,754
sqft
|
built
1986
507 Wellington Dr, Houma, LA 70360
$-31
Cash flow
-0.7%
Cash-on-Cash Return
5.5%
Cap rate
0.7%
Rent to Value Ratio
Active
$479,000
4
bds
|
3
ba
|
3,045
sqft
|
built
1965
105 General Lee St, Houma, LA 70360
$-542
Cash flow
-5.9%
Cash-on-Cash Return
4.3%
Cap rate
0.5%
Rent to Value Ratio
Active
$229,900
3
bds
|
2
ba
|
2,064
sqft
|
built
1979
302 N Moss Dr, Houma, LA 70360
$154
Cash flow
3.5%
Cash-on-Cash Return
6.5%
Cap rate
0.8%
Rent to Value Ratio
Active
$1,200,000
4
bds
|
4
ba
|
4,801
sqft
|
built
1950
1231 Bayou Black Dr, Houma, LA 70360
$-4,092
Cash flow
-17.8%
Cash-on-Cash Return
1.6%
Cap rate
0.2%
Rent to Value Ratio
Active
$339,900
4
bds
|
2
ba
|
2,094
sqft
|
built
1990
411 Valhi Blvd, Houma, LA 70360
$-367
Cash flow
-5.6%
Cash-on-Cash Return
4.4%
Cap rate
0.5%
Rent to Value Ratio
Active
$125,000
2
bds
|
1
ba
|
1,235
sqft
|
built
1981
1403 Honduras St, Houma, LA 70360
$374
Cash flow
15.6%
Cash-on-Cash Return
9.3%
Cap rate
1.1%
Rent to Value Ratio
Active
$330,000
3
bds
|
2
ba
|
1,870
sqft
|
built
2005
220 Viola St, Houma, LA 70360
$-182
Cash flow
-2.9%
Cash-on-Cash Return
5.0%
Cap rate
0.6%
Rent to Value Ratio