70815 Investment Properties for Sale
Browse homes for sale and investment properties in 70815. Refine your search by price, property type, or more.
Best cash flowing properties in 70815
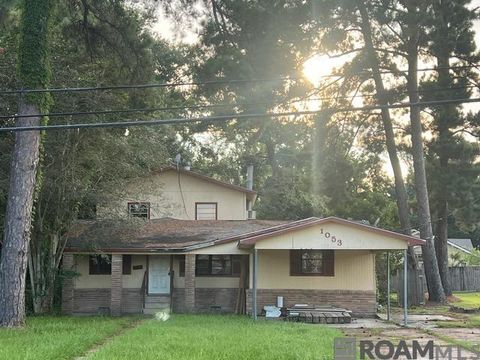
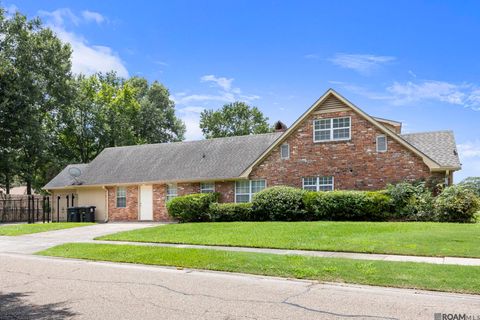
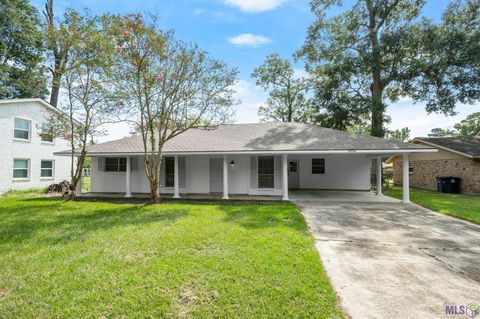
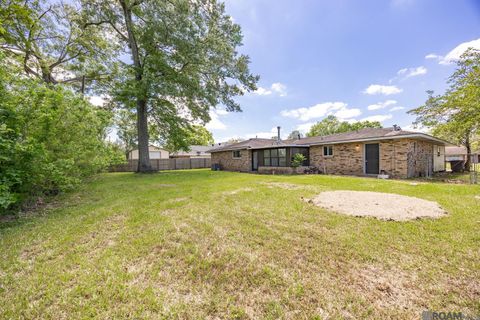
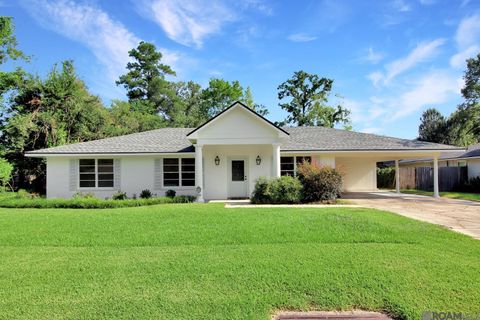
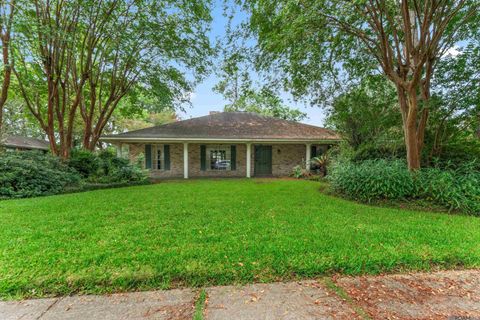
Active
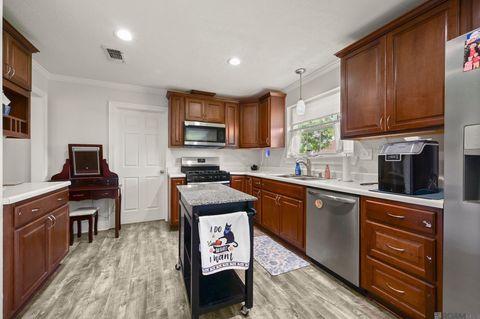
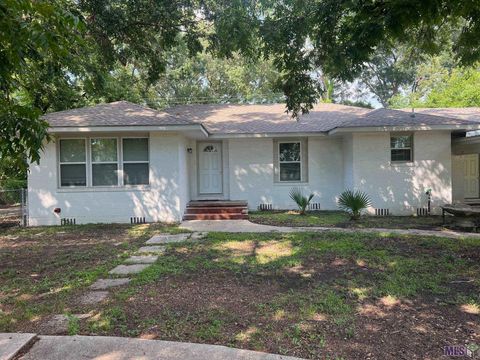
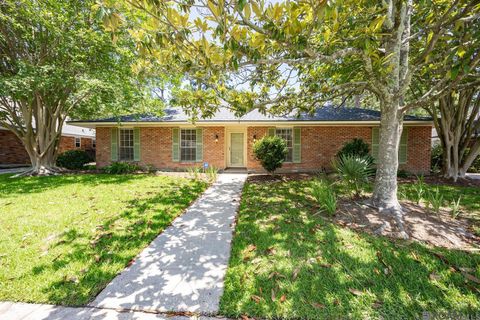
$94,900
4
bds
|
3
ba
|
2,392
sqft
|
built
1955
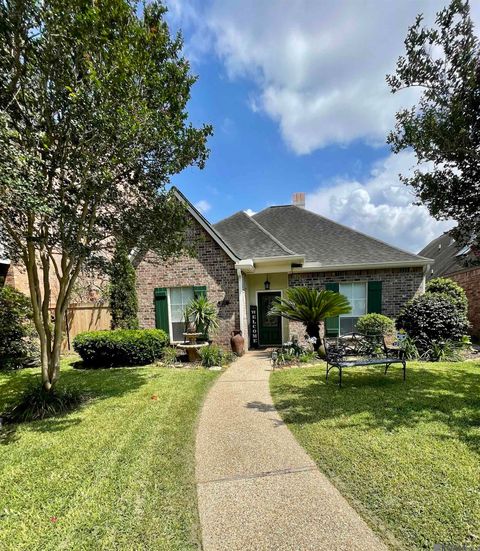
1053 Green Oak Dr, Baton Rouge, LA 70815
$793
Cash flow
43.6%
Cash-on-Cash Return
15.7%
Cap rate
1.9%
Rent to Value Ratio
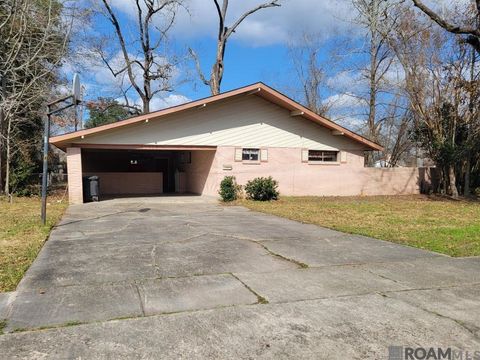
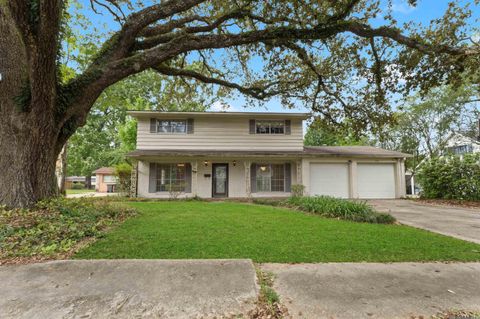
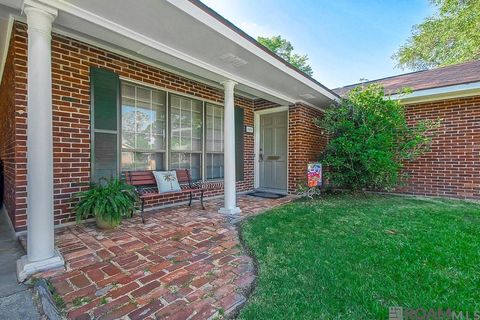
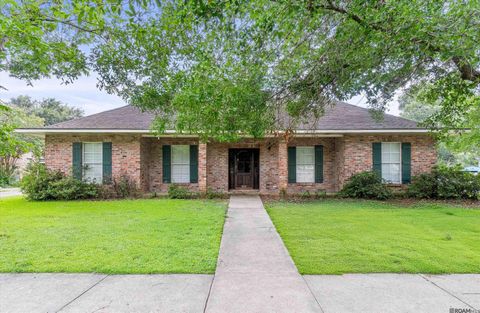
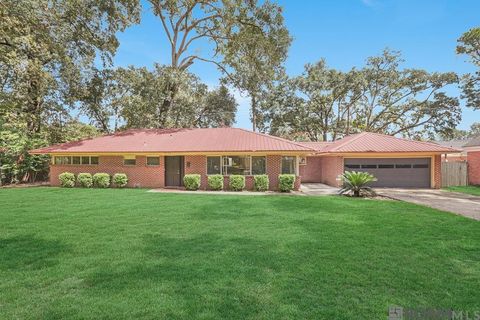
Active
$169,000
3
bds
|
2
ba
|
1,684
sqft
|
built
1966
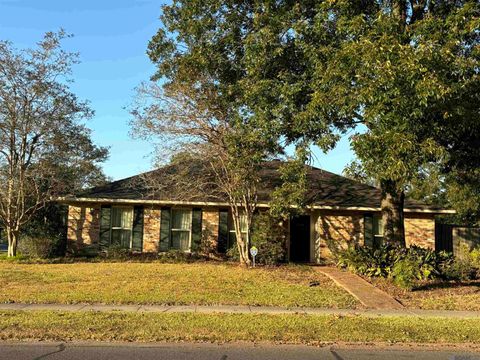
11775 Parkwood Dr, Baton Rouge, LA 70815
$438
Cash flow
13.5%
Cash-on-Cash Return
8.8%
Cap rate
1.1%
Rent to Value Ratio
46 out of 51 properties for sale in 70815
Limited Results Shown
Create a free account, or log in to reveal all property listings and enjoy the complete experience.
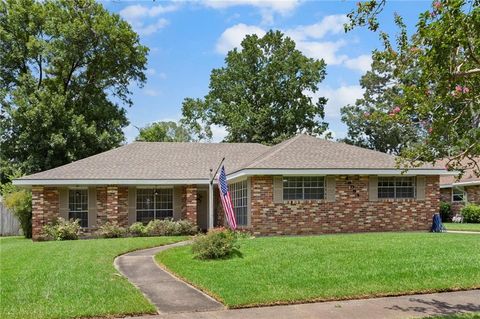
Active
$244,000
4
bds
|
2
ba
|
2,073
sqft
|
built
1967
12651 Parnell Ave, Baton Rouge, LA 70815
$85
Cash flow
1.8%
Cash-on-Cash Return
6.1%
Cap rate
0.7%
Rent to Value Ratio
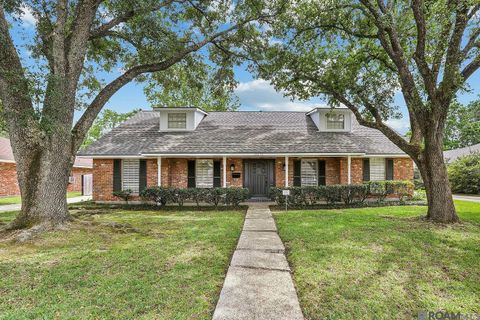
Active
$379,900
4
bds
|
3
ba
|
2,926
sqft
|
built
1973
10656 Rondo Ave, Baton Rouge, LA 70815
$-418
Cash flow
-5.7%
Cash-on-Cash Return
4.4%
Cap rate
0.5%
Rent to Value Ratio
Active
$269,900
3
bds
|
2
ba
|
1,844
sqft
|
built
1999
12032 Beauverde Ct, Baton Rouge, LA 70815
$82
Cash flow
1.6%
Cash-on-Cash Return
6.0%
Cap rate
0.7%
Rent to Value Ratio
Active
$275,000
4
bds
|
3
ba
|
2,637
sqft
|
built
1973
13343 E Parnell Ave, Baton Rouge, LA 70815
$424
Cash flow
8.0%
Cash-on-Cash Return
7.5%
Cap rate
0.9%
Rent to Value Ratio
Active
$259,900
4
bds
|
2
ba
|
2,525
sqft
|
built
1967
12511 E Robin Hood Dr, Baton Rouge, LA 70815
$288
Cash flow
5.8%
Cash-on-Cash Return
7.0%
Cap rate
0.8%
Rent to Value Ratio
Active
$475,000
4
bds
|
4
ba
|
4,415
sqft
|
built
1965
9555 Goodwood Blvd, Baton Rouge, LA 70815
$-523
Cash flow
-5.7%
Cash-on-Cash Return
4.4%
Cap rate
0.5%
Rent to Value Ratio
Active
$242,000
4
bds
|
2
ba
|
2,086
sqft
|
built
1970
9978 W Tams Dr, Baton Rouge, LA 70815
$166
Cash flow
3.6%
Cash-on-Cash Return
6.5%
Cap rate
0.8%
Rent to Value Ratio
Active
$289,000
4
bds
|
3
ba
|
2,419
sqft
|
built
1965
379 Wilton Dr, Baton Rouge, LA 70815
$12
Cash flow
0.2%
Cash-on-Cash Return
5.7%
Cap rate
0.7%
Rent to Value Ratio
Active
$190,000
3
bds
|
2
ba
|
1,340
sqft
|
built
1971
2148 Oak Knoll Dr, Baton Rouge, LA 70815
$205
Cash flow
5.6%
Cash-on-Cash Return
7.0%
Cap rate
0.8%
Rent to Value Ratio
Active
$219,000
5
bds
|
3
ba
|
2,195
sqft
|
built
1965
1347 Sherwood Forest Blvd, Baton Rouge, LA 70815
$-70
Cash flow
-1.7%
Cash-on-Cash Return
5.3%
Cap rate
0.6%
Rent to Value Ratio
Active
$389,000
5
bds
|
3
ba
|
3,200
sqft
|
built
1960
12384 Goodwood Blvd, Baton Rouge, LA 70815
$-116
Cash flow
-1.6%
Cash-on-Cash Return
5.3%
Cap rate
0.6%
Rent to Value Ratio
Active
$299,500
4
bds
|
2
ba
|
2,506
sqft
|
built
1977
1124 Sharp Rd, Baton Rouge, LA 70815
$-382
Cash flow
-6.7%
Cash-on-Cash Return
4.1%
Cap rate
0.5%
Rent to Value Ratio
Active
$220,000
3
bds
|
3
ba
|
1,972
sqft
|
built
1972
346 Wilton Dr, Baton Rouge, LA 70815
$201
Cash flow
4.8%
Cash-on-Cash Return
6.8%
Cap rate
0.8%
Rent to Value Ratio
Active
$248,000
3
bds
|
2
ba
|
2,000
sqft
|
built
1963
10431 Goodwood Blvd, Baton Rouge, LA 70815
$206
Cash flow
4.3%
Cash-on-Cash Return
6.7%
Cap rate
0.8%
Rent to Value Ratio
Active
$214,900
3
bds
|
2
ba
|
1,725
sqft
|
built
1955
8763 Airline Hwy, Baton Rouge, LA 70815
$156
Cash flow
3.8%
Cash-on-Cash Return
6.6%
Cap rate
0.8%
Rent to Value Ratio
Active
$189,900
3
bds
|
3
ba
|
1,622
sqft
|
built
1975
1340 Hermosa Dr, Baton Rouge, LA 70815
$205
Cash flow
5.6%
Cash-on-Cash Return
7.0%
Cap rate
0.8%
Rent to Value Ratio
Active
$245,000
3
bds
|
2
ba
|
1,908
sqft
|
built
1957
9434 W Van Pl, Baton Rouge, LA 70815
$-193
Cash flow
-4.1%
Cash-on-Cash Return
4.7%
Cap rate
0.6%
Rent to Value Ratio
Active
$238,900
4
bds
|
2
ba
|
2,395
sqft
|
built
1964
1165 S Tinley Dr, Baton Rouge, LA 70815
$249
Cash flow
5.4%
Cash-on-Cash Return
6.9%
Cap rate
0.8%
Rent to Value Ratio
Active
$224,800
3
bds
|
2
ba
|
1,406
sqft
|
built
1964
10724 Mollylea Dr, Baton Rouge, LA 70815
$178
Cash flow
4.1%
Cash-on-Cash Return
6.6%
Cap rate
0.8%
Rent to Value Ratio
Active
$238,900
3
bds
|
2
ba
|
2,090
sqft
|
built
1963
388 Wingate Dr, Baton Rouge, LA 70815
$111
Cash flow
2.4%
Cash-on-Cash Return
6.2%
Cap rate
0.8%
Rent to Value Ratio
Active
$339,900
4
bds
|
3
ba
|
2,874
sqft
|
built
1977
12679 E Sheraton Ave, Baton Rouge, LA 70815
$116
Cash flow
1.8%
Cash-on-Cash Return
6.1%
Cap rate
0.7%
Rent to Value Ratio
Active
$338,000
4
bds
|
3
ba
|
2,484
sqft
|
built
1973
13212 Avants Ave, Baton Rouge, LA 70815
$-82
Cash flow
-1.3%
Cash-on-Cash Return
5.4%
Cap rate
0.7%
Rent to Value Ratio
Active
$369,500
5
bds
|
3
ba
|
2,950
sqft
|
built
1974
1233 Ashbourne Dr, Baton Rouge, LA 70815
$45
Cash flow
0.6%
Cash-on-Cash Return
5.8%
Cap rate
0.7%
Rent to Value Ratio
Active
$220,000
bds
|
0
ba
|
2,281
sqft
|
built
12549 Lorna Ave, Baton Rouge, LA 70815
$-144
Cash flow
-3.4%
Cash-on-Cash Return
4.9%
Cap rate
0.6%
Rent to Value Ratio
Active
$210,000
4
bds
|
2
ba
|
1,600
sqft
|
built
1975
9370 W Tams Dr, Baton Rouge, LA 70815
$110
Cash flow
2.7%
Cash-on-Cash Return
6.3%
Cap rate
0.8%
Rent to Value Ratio
Active
$187,000
3
bds
|
2
ba
|
1,335
sqft
|
built
1980
2135 Vickers Dr, Baton Rouge, LA 70815
$219
Cash flow
6.1%
Cash-on-Cash Return
7.1%
Cap rate
0.9%
Rent to Value Ratio
Active
$309,900
3
bds
|
2
ba
|
2,198
sqft
|
built
1964
9525 Southmoor Dr, Baton Rouge, LA 70815
$51
Cash flow
0.9%
Cash-on-Cash Return
5.9%
Cap rate
0.7%
Rent to Value Ratio
Active
$315,000
3
bds
|
3
ba
|
2,001
sqft
|
built
2002
1706 Foxton Ct, Baton Rouge, LA 70815
$209
Cash flow
3.5%
Cash-on-Cash Return
6.5%
Cap rate
0.8%
Rent to Value Ratio
Active
$295,000
4
bds
|
3
ba
|
2,610
sqft
|
built
1993
822 Woodcliff Dr, Baton Rouge, LA 70815
$122
Cash flow
2.2%
Cash-on-Cash Return
6.2%
Cap rate
0.7%
Rent to Value Ratio
Active
$325,000
5
bds
|
4
ba
|
3,028
sqft
|
built
1972
10588 Goodwood Blvd, Baton Rouge, LA 70815
$187
Cash flow
3.0%
Cash-on-Cash Return
6.4%
Cap rate
0.8%
Rent to Value Ratio
Active
$265,000
4
bds
|
3
ba
|
2,087
sqft
|
built
1973
13243 Avants Ave, Baton Rouge, LA 70815
$333
Cash flow
6.6%
Cash-on-Cash Return
7.2%
Cap rate
0.9%
Rent to Value Ratio
Active
$199,500
3
bds
|
2
ba
|
1,843
sqft
|
built
1955
635 Marilyn Dr, Baton Rouge, LA 70815
$296
Cash flow
7.7%
Cash-on-Cash Return
7.5%
Cap rate
0.9%
Rent to Value Ratio
Active
$269,900
3
bds
|
2
ba
|
1,932
sqft
|
built
1960
437 Cora Dr, Baton Rouge, LA 70815
$100
Cash flow
1.9%
Cash-on-Cash Return
6.1%
Cap rate
0.7%
Rent to Value Ratio
Active
$245,900
3
bds
|
2
ba
|
2,466
sqft
|
built
1958
11666 Parkwood Dr, Baton Rouge, LA 70815
$283
Cash flow
6.0%
Cash-on-Cash Return
7.1%
Cap rate
0.9%
Rent to Value Ratio
Active
$224,900
4
bds
|
3
ba
|
2,464
sqft
|
built
1968
12424 E Sheraton Ave, Baton Rouge, LA 70815
$316
Cash flow
7.3%
Cash-on-Cash Return
7.4%
Cap rate
0.9%
Rent to Value Ratio
Active
$210,000
3
bds
|
2
ba
|
1,685
sqft
|
built
1963
9155 S Parkview Dr, Baton Rouge, LA 70815
$248
Cash flow
6.2%
Cash-on-Cash Return
7.1%
Cap rate
0.9%
Rent to Value Ratio
Active
$315,000
3
bds
|
2
ba
|
2,030
sqft
|
built
2000
1715 Foxton Ct, Baton Rouge, LA 70815
$-132
Cash flow
-2.2%
Cash-on-Cash Return
5.2%
Cap rate
0.6%
Rent to Value Ratio
Active
$225,000
3
bds
|
2
ba
|
1,773
sqft
|
built
1974
12764 Archery Dr, Baton Rouge, LA 70815
$177
Cash flow
4.1%
Cash-on-Cash Return
6.6%
Cap rate
0.8%
Rent to Value Ratio