70820 Investment Properties for Sale
Browse homes for sale and investment properties in 70820. Refine your search by price, property type, or more.
Best cash flowing properties in 70820

Active
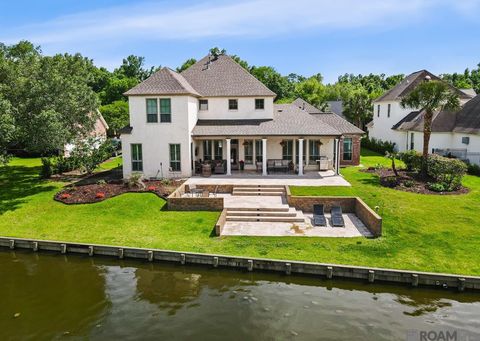
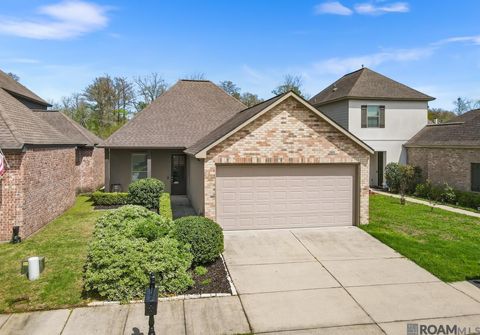
$939,500
4
bds
|
3
ba
|
3,656
sqft
|
built
2022
2757 Chenal Ct, Baton Rouge, LA 70820
$974
Cash flow
5.4%
Cash-on-Cash Return
6.9%
Cap rate
0.9%
Rent to Value Ratio

Active
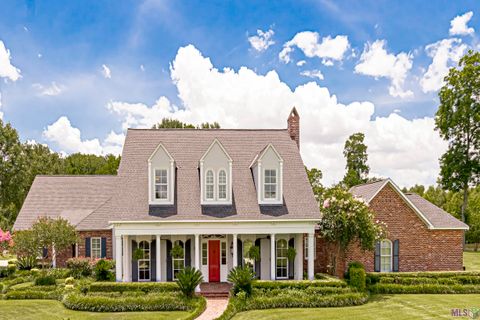
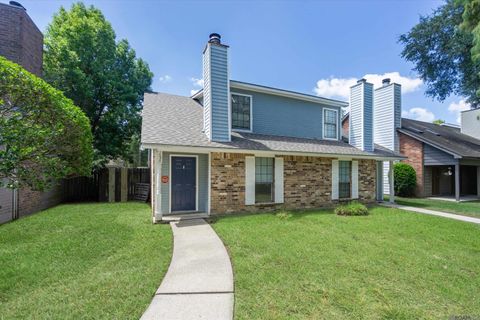
$389,000
4
bds
|
3
ba
|
3,810
sqft
|
built
1984
6011 Riverbend Blvd, Baton Rouge, LA 70820
$635
Cash flow
8.5%
Cash-on-Cash Return
7.6%
Cap rate
0.9%
Rent to Value Ratio
50 out of 94 properties for sale in 70820
Limited Results Shown
Create a free account, or log in to reveal all property listings and enjoy the complete experience.
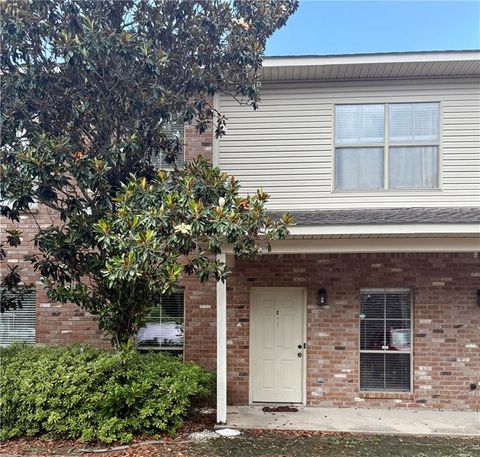
Active
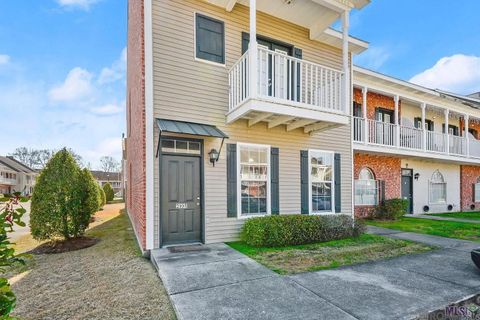
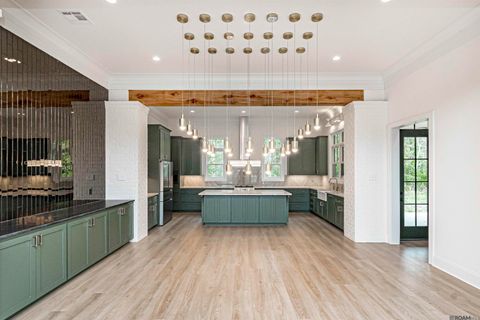
$129,000
2
bds
|
2
ba
|
1,100
sqft
|
built
2008
818 Meadow Bend Dr, Baton Rouge, LA 70820
$224
Cash flow
9.1%
Cash-on-Cash Return
8.3%
Cap rate
1.0%
Rent to Value Ratio
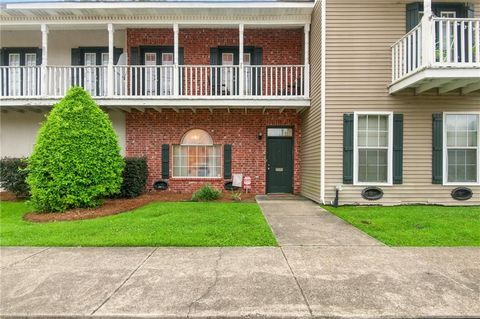
Active
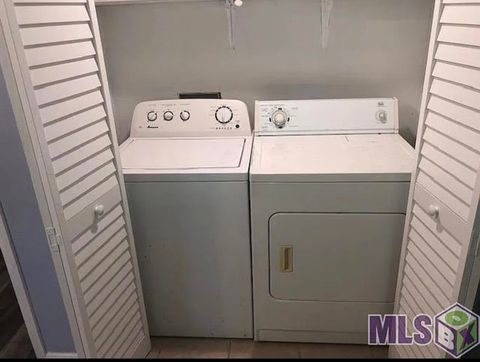
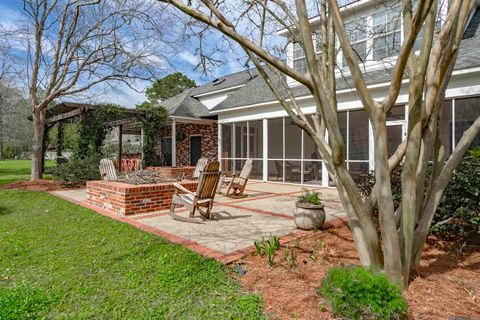
$179,000
2
bds
|
3
ba
|
1,374
sqft
|
built
2004
5191 Arlington Ct, Baton Rouge, LA 70820
$25
Cash flow
0.7%
Cash-on-Cash Return
6.4%
Cap rate
0.8%
Rent to Value Ratio
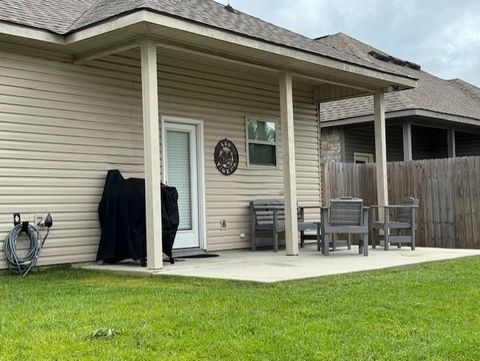
Active
$328,900
4
bds
|
3
ba
|
1,833
sqft
|
built
2021
7248 Kenilworth Crossing Ave, Baton Rouge, LA 70820
$331
Cash flow
5.3%
Cash-on-Cash Return
6.9%
Cap rate
0.9%
Rent to Value Ratio
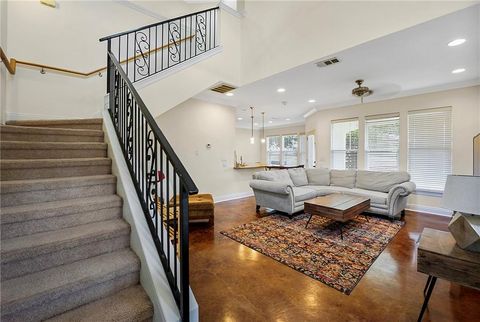
Active
$267,000
3
bds
|
4
ba
|
1,901
sqft
|
built
2008
8000 Stonelake Village Ave, Baton Rouge, LA 70820
$185
Cash flow
3.6%
Cash-on-Cash Return
6.5%
Cap rate
0.8%
Rent to Value Ratio
Active
$193,500
3
bds
|
2
ba
|
1,554
sqft
|
built
2004
4441 Burbank Dr, Baton Rouge, LA 70820
$188
Cash flow
5.1%
Cash-on-Cash Return
6.8%
Cap rate
0.8%
Rent to Value Ratio

Active
$224,000
3
bds
|
3
ba
|
1,555
sqft
|
built
2004
5315 Arlington Ct, Baton Rouge, LA 70820
$107
Cash flow
2.5%
Cash-on-Cash Return
6.3%
Cap rate
0.8%
Rent to Value Ratio

Active
$650,000
20
bds
|
0
ba
|
6,692
sqft
|
built
1975
4708 Tigerland Ave, Baton Rouge, LA 70820
$-1,351
Cash flow
-10.8%
Cash-on-Cash Return
3.2%
Cap rate
0.4%
Rent to Value Ratio

Active
$295,000
3
bds
|
2
ba
|
1,524
sqft
|
built
2016
1405 Alouette Dr, Baton Rouge, LA 70820
$-341
Cash flow
-6.0%
Cash-on-Cash Return
4.3%
Cap rate
0.5%
Rent to Value Ratio
Active
$315,000
bds
|
0
ba
|
4,200
sqft
|
built
1979
1767 Port Dr, Baton Rouge, LA 70820
$234
Cash flow
3.9%
Cash-on-Cash Return
6.6%
Cap rate
0.8%
Rent to Value Ratio

Active
$289,000
3
bds
|
2
ba
|
1,688
sqft
|
built
2019
1208 Foxtail Dr, Baton Rouge, LA 70820
$446
Cash flow
8.1%
Cash-on-Cash Return
7.5%
Cap rate
0.9%
Rent to Value Ratio
Active
$288,000
3
bds
|
2
ba
|
1,659
sqft
|
built
2018
7985 Brown Hickory Ave, Baton Rouge, LA 70820
$-145
Cash flow
-2.6%
Cash-on-Cash Return
5.1%
Cap rate
0.6%
Rent to Value Ratio
Active
$415,000
3
bds
|
2
ba
|
2,114
sqft
|
built
2007
6104 Destrehan Dr, Baton Rouge, LA 70820
$-659
Cash flow
-8.3%
Cash-on-Cash Return
4.4%
Cap rate
0.5%
Rent to Value Ratio
Active
$749,900
5
bds
|
5
ba
|
3,746
sqft
|
built
2006
3126 Laurel Plantation Ave, Baton Rouge, LA 70820
$-473
Cash flow
-3.3%
Cash-on-Cash Return
4.9%
Cap rate
0.6%
Rent to Value Ratio
Active
$1,495,000
5
bds
|
4
ba
|
5,849
sqft
|
built
2005
2005 Laurel Lakes Ave, Baton Rouge, LA 70820
$-2,884
Cash flow
-10.1%
Cash-on-Cash Return
3.4%
Cap rate
0.4%
Rent to Value Ratio

Active
$519,000
4
bds
|
3
ba
|
2,300
sqft
|
built
2023
4355 Boulonnais Ave, Baton Rouge, LA 70820
$264
Cash flow
2.7%
Cash-on-Cash Return
6.3%
Cap rate
0.8%
Rent to Value Ratio

Active
$574,900
4
bds
|
3
ba
|
3,048
sqft
|
built
2003
6314 Morgan Bend Dr, Baton Rouge, LA 70820
$-799
Cash flow
-7.3%
Cash-on-Cash Return
4.0%
Cap rate
0.5%
Rent to Value Ratio

Active
$362,200
bds
|
0
ba
|
4,332
sqft
|
built
1985
1706 Brightside Dr, Baton Rouge, LA 70820
$-1,368
Cash flow
-19.7%
Cash-on-Cash Return
1.1%
Cap rate
0.2%
Rent to Value Ratio

Active
$220,000
2
bds
|
2
ba
|
1,065
sqft
|
built
2019
1451 Pelican Club Dr, Baton Rouge, LA 70820
$-86
Cash flow
-2.0%
Cash-on-Cash Return
5.2%
Cap rate
0.7%
Rent to Value Ratio
Active
$225,000
3
bds
|
3
ba
|
1,558
sqft
|
built
2004
2105 Belle Point Aly, Baton Rouge, LA 70820
$102
Cash flow
2.4%
Cash-on-Cash Return
6.2%
Cap rate
0.8%
Rent to Value Ratio
Active
$423,899
bds
|
0
ba
|
4,000
sqft
|
built
1984
5407 Nicholson Dr, Baton Rouge, LA 70820
$-1,247
Cash flow
-15.3%
Cash-on-Cash Return
2.1%
Cap rate
0.3%
Rent to Value Ratio
Active
$174,000
3
bds
|
3
ba
|
1,780
sqft
|
built
1989
5205 Heatherstone Dr, Baton Rouge, LA 70820
$163
Cash flow
4.9%
Cash-on-Cash Return
6.8%
Cap rate
1.0%
Rent to Value Ratio
Active
$198,900
3
bds
|
2
ba
|
2,119
sqft
|
built
1973
5435 Heatherstone Dr, Baton Rouge, LA 70820
$79
Cash flow
2.1%
Cash-on-Cash Return
6.7%
Cap rate
0.9%
Rent to Value Ratio

Active
$299,000
3
bds
|
2
ba
|
1,663
sqft
|
built
2012
7935 Seville Ct, Baton Rouge, LA 70820
$72
Cash flow
1.3%
Cash-on-Cash Return
6.0%
Cap rate
0.8%
Rent to Value Ratio
Active
$350,000
3
bds
|
0
ba
|
3,214
sqft
|
built
1980
1532 Sharlo Ave, Baton Rouge, LA 70820
$-770
Cash flow
-11.5%
Cash-on-Cash Return
3.0%
Cap rate
0.4%
Rent to Value Ratio
Active
$505,000
4
bds
|
3
ba
|
2,794
sqft
|
built
2002
3603 Twelve Oaks Ave, Baton Rouge, LA 70820
$-468
Cash flow
-4.8%
Cash-on-Cash Return
4.6%
Cap rate
0.6%
Rent to Value Ratio
Active
$334,000
3
bds
|
2
ba
|
1,768
sqft
|
built
2014
7907 Valencia Ct, Baton Rouge, LA 70820
$77
Cash flow
1.2%
Cash-on-Cash Return
6.0%
Cap rate
0.7%
Rent to Value Ratio

Active
$402,000
bds
|
0
ba
|
3,248
sqft
|
built
5435 Nicholson Dr, Baton Rouge, LA 70820
$-1,281
Cash flow
-16.6%
Cash-on-Cash Return
1.9%
Cap rate
0.2%
Rent to Value Ratio

Active
$349,000
3
bds
|
2
ba
|
1,783
sqft
|
built
2015
8365 Seville Ct, Baton Rouge, LA 70820
$-201
Cash flow
-3.0%
Cash-on-Cash Return
5.0%
Cap rate
0.6%
Rent to Value Ratio
Active
$165,000
3
bds
|
2
ba
|
1,607
sqft
|
built
1983
1534 Sharlo Ave, Baton Rouge, LA 70820
$214
Cash flow
6.8%
Cash-on-Cash Return
7.2%
Cap rate
0.9%
Rent to Value Ratio
Active
$795,000
4
bds
|
5
ba
|
3,045
sqft
|
built
2023
2860 Pointe Marie Dr, Baton Rouge, LA 70820
$-28
Cash flow
-0.2%
Cash-on-Cash Return
5.6%
Cap rate
0.7%
Rent to Value Ratio

Active
$525,000
3
bds
|
2
ba
|
2,041
sqft
|
built
2022
3064 Pointe Marie Dr, Baton Rouge, LA 70820
$-169
Cash flow
-1.7%
Cash-on-Cash Return
5.3%
Cap rate
0.7%
Rent to Value Ratio

Active
$519,900
4
bds
|
3
ba
|
2,796
sqft
|
built
2006
3828 Twelve Oaks Ave, Baton Rouge, LA 70820
$-538
Cash flow
-5.4%
Cash-on-Cash Return
4.4%
Cap rate
0.5%
Rent to Value Ratio

Active
$280,000
bds
|
0
ba
|
3,450
sqft
|
built
4726 Earl Gros Ave, Baton Rouge, LA 70820
$-221
Cash flow
-4.1%
Cash-on-Cash Return
4.7%
Cap rate
0.6%
Rent to Value Ratio
Active
$875,000
4
bds
|
5
ba
|
4,550
sqft
|
built
1993
2806 Dakin Ave, Baton Rouge, LA 70820
$-773
Cash flow
-4.6%
Cash-on-Cash Return
4.6%
Cap rate
0.6%
Rent to Value Ratio

Active
$895,000
4
bds
|
4
ba
|
3,376
sqft
|
built
2021
3257 Pointe Marie Dr, Baton Rouge, LA 70820
$-816
Cash flow
-4.8%
Cash-on-Cash Return
4.6%
Cap rate
0.6%
Rent to Value Ratio

Active
$659,900
4
bds
|
3
ba
|
2,586
sqft
|
built
2018
3143 Pointe Marie Dr, Baton Rouge, LA 70820
$-217
Cash flow
-1.7%
Cash-on-Cash Return
5.3%
Cap rate
0.7%
Rent to Value Ratio

Active
$3,500,000
bds
|
0
ba
|
36,000
sqft
|
built
7272 Burbank Dr, Baton Rouge, LA 70820
$-15,597
Cash flow
-23.3%
Cash-on-Cash Return
0.3%
Cap rate
0.0%
Rent to Value Ratio
Active
$99,900
2
bds
|
3
ba
|
1,250
sqft
|
built
1984
1933 S Brightside View Dr, Baton Rouge, LA 70820
$209
Cash flow
10.9%
Cash-on-Cash Return
8.2%
Cap rate
1.4%
Rent to Value Ratio