73106 Investment Properties for Sale
Browse homes for sale and investment properties in 73106. Refine your search by price, property type, or more.
Best cash flowing properties in 73106
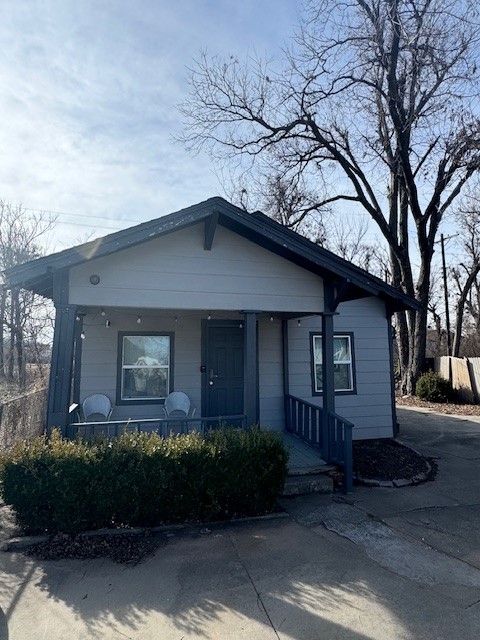
Pending
$190,000
4
bds
|
4
ba
|
0
sqft
|
built
1910
1315 NW 7th St, Oklahoma City, OK 73106
$129
Cash flow
3.5%
Cash-on-Cash Return
6.5%
Cap rate
0.8%
Rent to Value Ratio
Active
$125,000
3
bds
|
1
ba
|
0
sqft
|
built
1923
1613 NW 22nd St, Oklahoma City, OK 73106
$110
Cash flow
4.6%
Cash-on-Cash Return
6.7%
Cap rate
0.9%
Rent to Value Ratio
58 out of 73 properties for sale in 73106
Limited Results Shown
Create a free account, or log in to reveal all property listings and enjoy the complete experience.
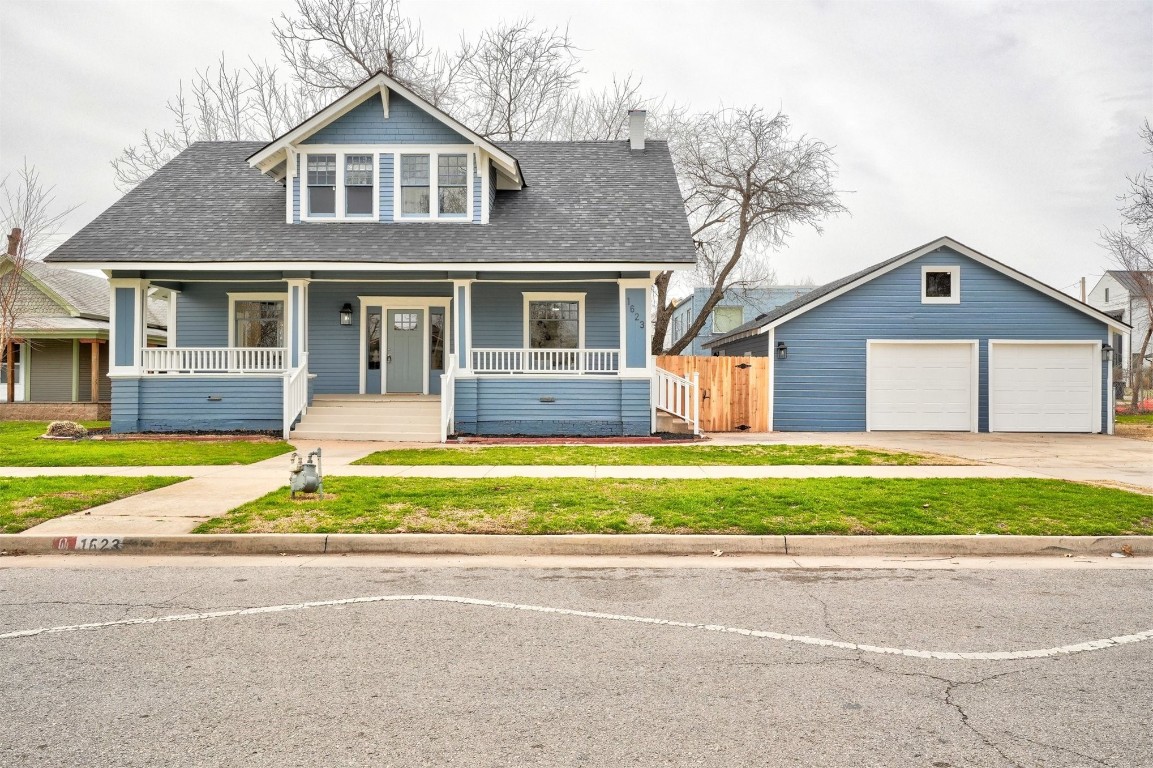
Active
$539,500
3
bds
|
3
ba
|
0
sqft
|
built
1915
1623 N Ellison Ave, Oklahoma City, OK 73106
$-1,454
Cash flow
-14.1%
Cash-on-Cash Return
2.4%
Cap rate
0.3%
Rent to Value Ratio
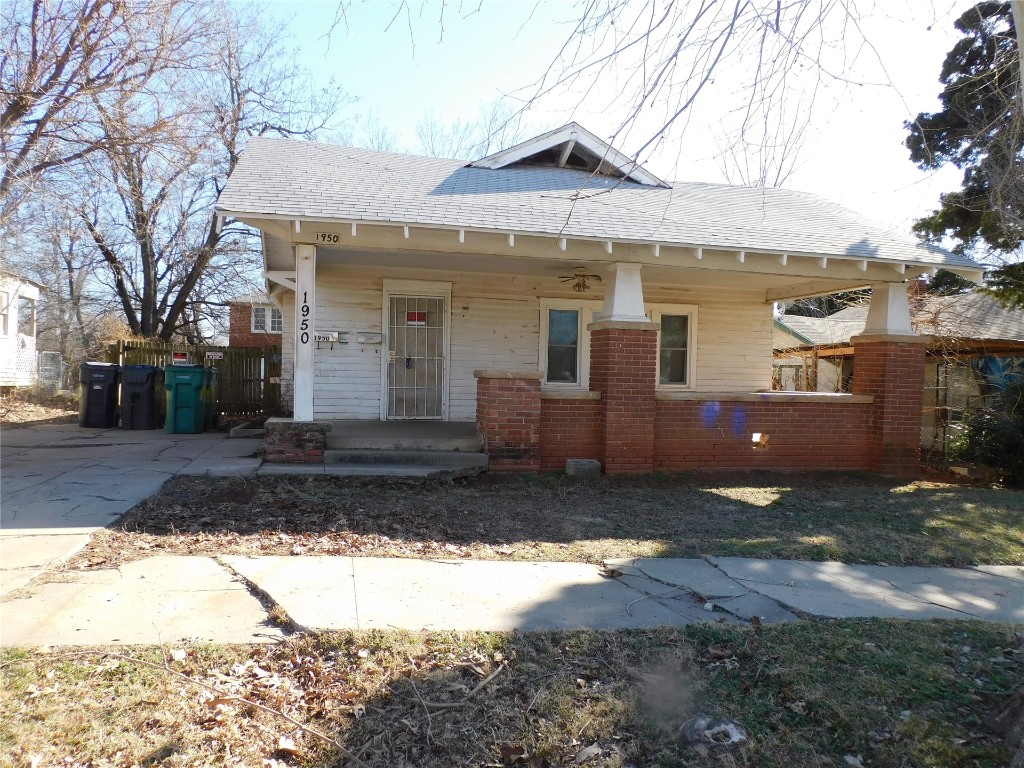
Active
$248,000
4
bds
|
2
ba
|
0
sqft
|
built
1918
1950 W Park Pl, Oklahoma City, OK 73106
$-203
Cash flow
-4.3%
Cash-on-Cash Return
4.7%
Cap rate
0.6%
Rent to Value Ratio
Pending
$190,000
4
bds
|
4
ba
|
0
sqft
|
built
1910
1315 NW 7th St, Oklahoma City, OK 73106
$129
Cash flow
3.5%
Cash-on-Cash Return
6.5%
Cap rate
0.8%
Rent to Value Ratio
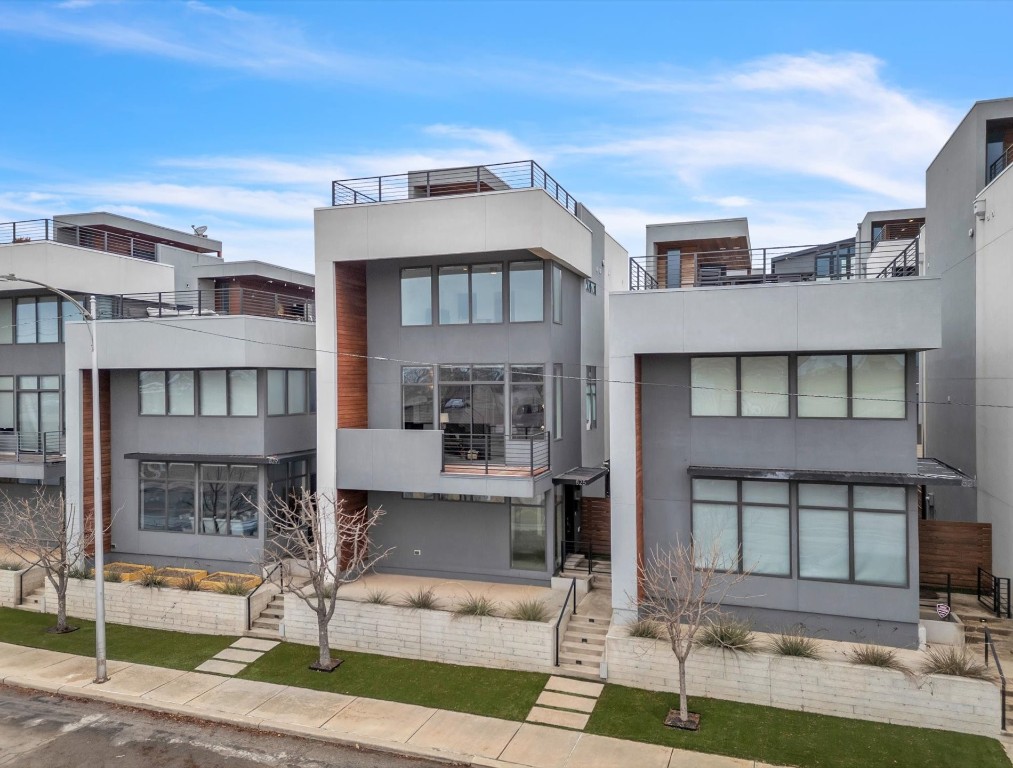
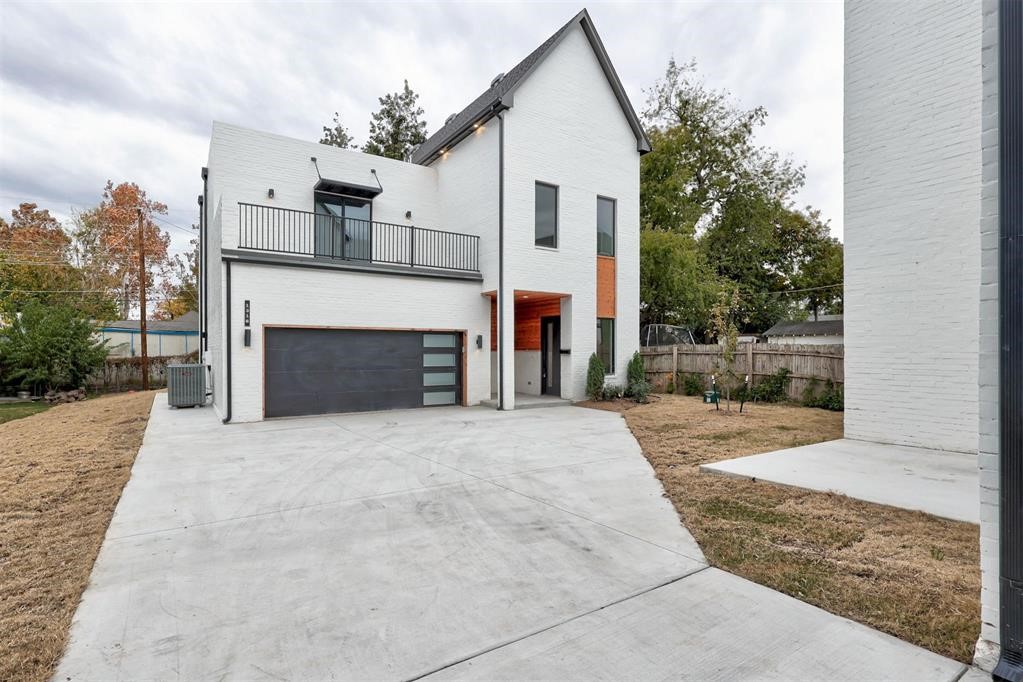
Active
$749,000
3
bds
|
4
ba
|
0
sqft
|
built
2020
825 NW 6th St, Oklahoma City, OK 73106
$-1,665
Cash flow
-11.6%
Cash-on-Cash Return
3.0%
Cap rate
0.5%
Rent to Value Ratio
Active
$125,000
3
bds
|
1
ba
|
0
sqft
|
built
1923
1613 NW 22nd St, Oklahoma City, OK 73106
$110
Cash flow
4.6%
Cash-on-Cash Return
6.7%
Cap rate
0.9%
Rent to Value Ratio
Active
$275,000
5
bds
|
4
ba
|
0
sqft
|
built
1921
1900 W Park Pl, Oklahoma City, OK 73106
$-333
Cash flow
-6.3%
Cash-on-Cash Return
4.2%
Cap rate
0.6%
Rent to Value Ratio
Active
$375,000
5
bds
|
3
ba
|
0
sqft
|
built
1949
2214 N Florida Ave, Oklahoma City, OK 73106
$-197
Cash flow
-2.7%
Cash-on-Cash Return
5.0%
Cap rate
0.7%
Rent to Value Ratio
Active
$350,000
4
bds
|
3
ba
|
0
sqft
|
built
1906
1615 NW 1st St, Oklahoma City, OK 73106
$-1,126
Cash flow
-16.8%
Cash-on-Cash Return
1.8%
Cap rate
0.4%
Rent to Value Ratio
Active
$224,900
5
bds
|
3
ba
|
0
sqft
|
built
1914
1512 NW 2nd St, Oklahoma City, OK 73106
$-393
Cash flow
-9.1%
Cash-on-Cash Return
3.6%
Cap rate
0.5%
Rent to Value Ratio
Active
$549,900
3
bds
|
4
ba
|
0
sqft
|
built
2023
1318 NW 15th St, Oklahoma City, OK 73106
$-187
Cash flow
-1.8%
Cash-on-Cash Return
5.3%
Cap rate
0.6%
Rent to Value Ratio
Active
$469,000
4
bds
|
4
ba
|
0
sqft
|
built
2023
1301 NW 1st St, Oklahoma City, OK 73106
$-88
Cash flow
-1.0%
Cash-on-Cash Return
5.5%
Cap rate
0.7%
Rent to Value Ratio

Active
$339,000
2
bds
|
2
ba
|
0
sqft
|
built
1910
915 NW 22nd St, Oklahoma City, OK 73106
$-651
Cash flow
-10.0%
Cash-on-Cash Return
3.4%
Cap rate
0.5%
Rent to Value Ratio
Active
$579,900
3
bds
|
3
ba
|
0
sqft
|
built
1930
1617 N Marion Ave, Oklahoma City, OK 73106
$-854
Cash flow
-7.7%
Cash-on-Cash Return
3.9%
Cap rate
0.6%
Rent to Value Ratio
Active
$569,000
3
bds
|
3
ba
|
0
sqft
|
built
1921
1322 NW 21st St, Oklahoma City, OK 73106
$-1,021
Cash flow
-9.4%
Cash-on-Cash Return
3.5%
Cap rate
0.5%
Rent to Value Ratio
Active
$289,000
2
bds
|
2
ba
|
0
sqft
|
built
1927
1140 N Kentucky Ave, Oklahoma City, OK 73106
$-518
Cash flow
-9.4%
Cash-on-Cash Return
3.5%
Cap rate
0.5%
Rent to Value Ratio
Active
$304,000
2
bds
|
2
ba
|
0
sqft
|
built
1927
1840 NW 11th St, Oklahoma City, OK 73106
$-604
Cash flow
-10.4%
Cash-on-Cash Return
3.3%
Cap rate
0.5%
Rent to Value Ratio
Active
$450,000
9
bds
|
4
ba
|
0
sqft
|
built
1920
1801 NW 8th St, Oklahoma City, OK 73106
$-1,230
Cash flow
-14.3%
Cash-on-Cash Return
2.4%
Cap rate
0.4%
Rent to Value Ratio
Active
$224,900
2
bds
|
1
ba
|
0
sqft
|
built
1927
2045 NW 21st St, Oklahoma City, OK 73106
$-195
Cash flow
-4.5%
Cash-on-Cash Return
4.6%
Cap rate
0.7%
Rent to Value Ratio