73111 Investment Properties for Sale
Browse homes for sale and investment properties in 73111. Refine your search by price, property type, or more.
Best cash flowing properties in 73111
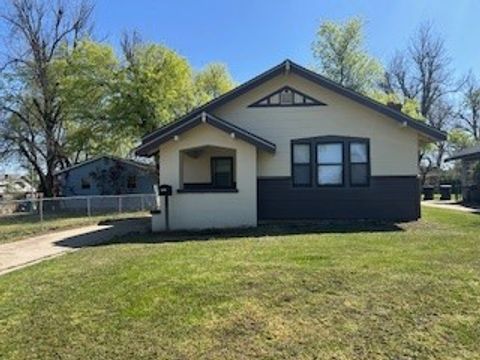
Active
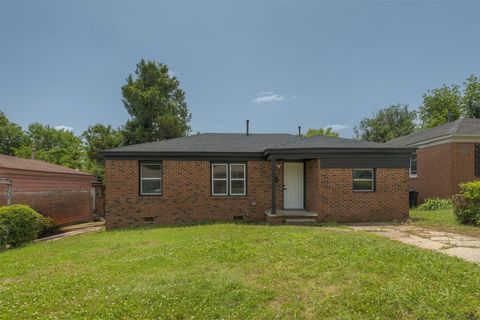
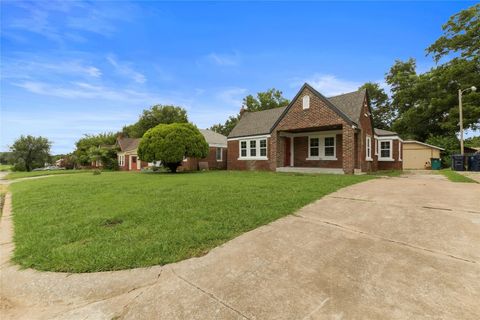
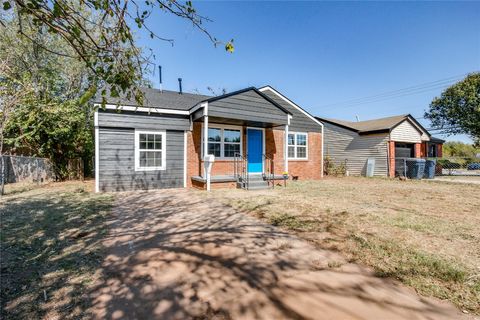
$90,000
3
bds
|
2
ba
|
0
sqft
|
built
1955
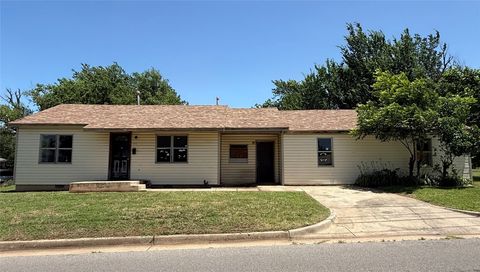
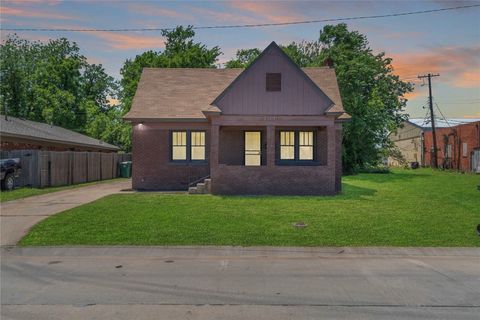
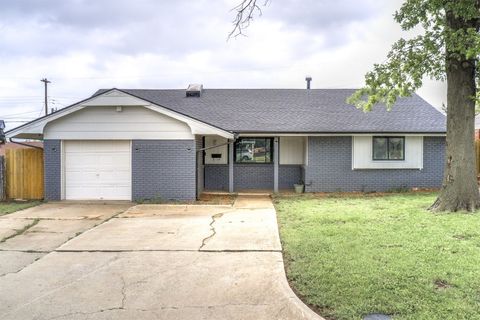
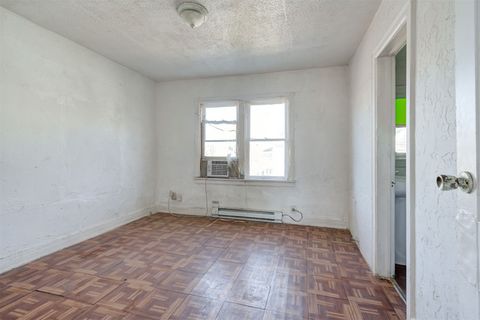
2918 N Prospect Ave, Oklahoma City, OK 73111
$465
Cash flow
27.0%
Cash-on-Cash Return
11.9%
Cap rate
1.6%
Rent to Value Ratio

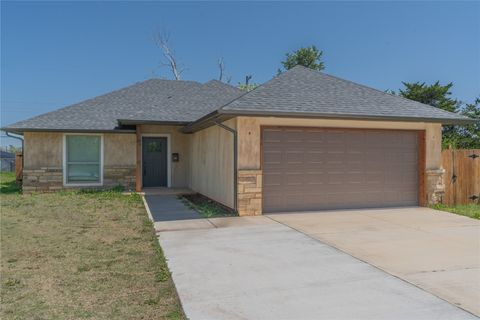
Active
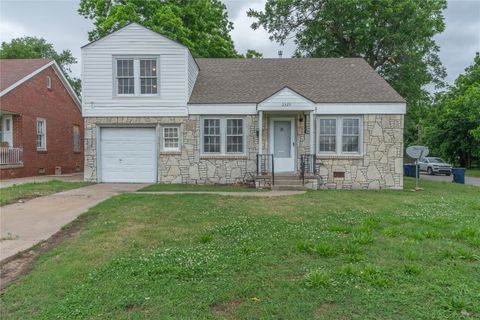
$137,000
3
bds
|
2
ba
|
0
sqft
|
built
1963
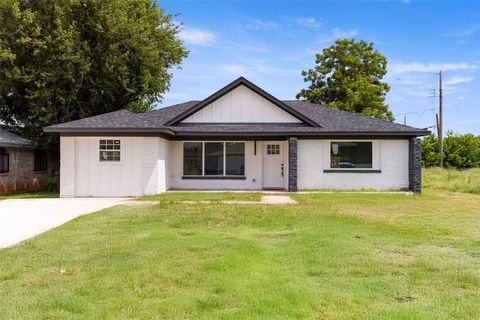
2525 NE 18th St, Oklahoma City, OK 73111
$243
Cash flow
9.3%
Cash-on-Cash Return
7.8%
Cap rate
1.0%
Rent to Value Ratio
39 out of 47 properties for sale in 73111
Limited Results Shown
Create a free account, or log in to reveal all property listings and enjoy the complete experience.
Active
$204,000
4
bds
|
2
ba
|
0
sqft
|
built
1951
1529 NE 44th St, Oklahoma City, OK 73111
$-300
Cash flow
-7.7%
Cash-on-Cash Return
3.9%
Cap rate
0.5%
Rent to Value Ratio
Active
$196,000
3
bds
|
2
ba
|
0
sqft
|
built
1960
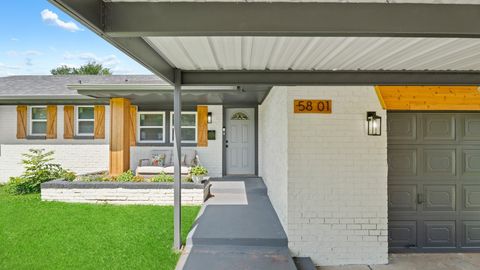
5801 N Rhode Island Ave, Oklahoma City, OK 73111
$80
Cash flow
2.1%
Cash-on-Cash Return
6.2%
Cap rate
0.8%
Rent to Value Ratio
Active
$90,000
3
bds
|
2
ba
|
0
sqft
|
built
1955
2918 N Prospect Ave, Oklahoma City, OK 73111
$465
Cash flow
27.0%
Cash-on-Cash Return
11.9%
Cap rate
1.6%
Rent to Value Ratio
Active
$164,900
2
bds
|
1
ba
|
0
sqft
|
built
2025
2212 N Kelham Ave, Oklahoma City, OK 73111
$-82
Cash flow
-2.6%
Cash-on-Cash Return
5.1%
Cap rate
0.7%
Rent to Value Ratio
Active
$299,000
4
bds
|
2
ba
|
0
sqft
|
built
1929
1109 NE 17th St, Oklahoma City, OK 73111
$-363
Cash flow
-6.3%
Cash-on-Cash Return
4.2%
Cap rate
0.5%
Rent to Value Ratio
Active
$120,000
3
bds
|
1
ba
|
0
sqft
|
built
1969
2605 N Kate Ave, Oklahoma City, OK 73111
$167
Cash flow
7.3%
Cash-on-Cash Return
7.4%
Cap rate
0.9%
Rent to Value Ratio
Active
$895,000
3
bds
|
3
ba
|
0
sqft
|
built
1946
1500 E Wilshire Blvd, Oklahoma City, OK 73111
$-2,515
Cash flow
-14.7%
Cash-on-Cash Return
2.3%
Cap rate
0.3%
Rent to Value Ratio
Active
$228,000
3
bds
|
2
ba
|
0
sqft
|
built
1940
1533 NE 26th St, Oklahoma City, OK 73111
$-159
Cash flow
-3.6%
Cash-on-Cash Return
4.8%
Cap rate
0.6%
Rent to Value Ratio
Active
$154,000
3
bds
|
1
ba
|
0
sqft
|
built
1949
2704 NE Success St, Oklahoma City, OK 73111
$6
Cash flow
0.2%
Cash-on-Cash Return
5.7%
Cap rate
0.7%
Rent to Value Ratio
Active
$195,000
4
bds
|
2
ba
|
0
sqft
|
built
1940
2325 E Madison St, Oklahoma City, OK 73111
$124
Cash flow
3.3%
Cash-on-Cash Return
6.4%
Cap rate
0.8%
Rent to Value Ratio
Active
$100,000
3
bds
|
1
ba
|
0
sqft
|
built
1950
1401 NE 37th St, Oklahoma City, OK 73111
$236
Cash flow
12.3%
Cash-on-Cash Return
8.5%
Cap rate
1.1%
Rent to Value Ratio

Active
$500,000
4
bds
|
6
ba
|
0
sqft
|
built
2022
1021 NE 18th St, Oklahoma City, OK 73111
$-779
Cash flow
-8.1%
Cash-on-Cash Return
3.8%
Cap rate
0.5%
Rent to Value Ratio
Active
$145,900
3
bds
|
1
ba
|
0
sqft
|
built
1949
2107 NE 26th St, Oklahoma City, OK 73111
$39
Cash flow
1.4%
Cash-on-Cash Return
6.0%
Cap rate
0.8%
Rent to Value Ratio
Active
$175,000
2
bds
|
1
ba
|
0
sqft
|
built
1929
2301 N Kelham Ave, Oklahoma City, OK 73111
$-217
Cash flow
-6.5%
Cash-on-Cash Return
4.2%
Cap rate
0.6%
Rent to Value Ratio
Active
$174,000
3
bds
|
1
ba
|
0
sqft
|
built
1980
2421 N Prospect Ave, Oklahoma City, OK 73111
$-105
Cash flow
-3.1%
Cash-on-Cash Return
5.0%
Cap rate
0.6%
Rent to Value Ratio

Active
$145,000
2
bds
|
1
ba
|
0
sqft
|
built
1932
2017 NE 20th St, Oklahoma City, OK 73111
$158
Cash flow
5.7%
Cash-on-Cash Return
7.0%
Cap rate
1.0%
Rent to Value Ratio

Active
$5,600,000
6
bds
|
9
ba
|
0
sqft
|
built
1931
2203 E Wilshire Blvd, Oklahoma City, OK 73111
$-27,216
Cash flow
-25.4%
Cash-on-Cash Return
-0.2%
Cap rate
0.1%
Rent to Value Ratio
Active
$185,000
3
bds
|
2
ba
|
0
sqft
|
built
1956
3601 N Terry Ave, Oklahoma City, OK 73111
$-63
Cash flow
-1.8%
Cash-on-Cash Return
5.3%
Cap rate
0.6%
Rent to Value Ratio
Active
$157,500
2
bds
|
1
ba
|
0
sqft
|
built
1920
1132 NE 17th St, Oklahoma City, OK 73111
$-144
Cash flow
-4.8%
Cash-on-Cash Return
4.6%
Cap rate
0.6%
Rent to Value Ratio
Active
$235,000
4
bds
|
3
ba
|
0
sqft
|
built
1959
5400 N Wisconsin Ave, Oklahoma City, OK 73111
$-255
Cash flow
-5.7%
Cash-on-Cash Return
4.4%
Cap rate
0.7%
Rent to Value Ratio
Active
$95,000
3
bds
|
1
ba
|
0
sqft
|
built
1925
2221 N Lottie Ave, Oklahoma City, OK 73111
$227
Cash flow
12.5%
Cash-on-Cash Return
8.6%
Cap rate
1.2%
Rent to Value Ratio
Active
$129,000
2
bds
|
1
ba
|
0
sqft
|
built
1935
2131 N Jordan Ave, Oklahoma City, OK 73111
$1
Cash flow
0.0%
Cash-on-Cash Return
5.7%
Cap rate
0.8%
Rent to Value Ratio
Active
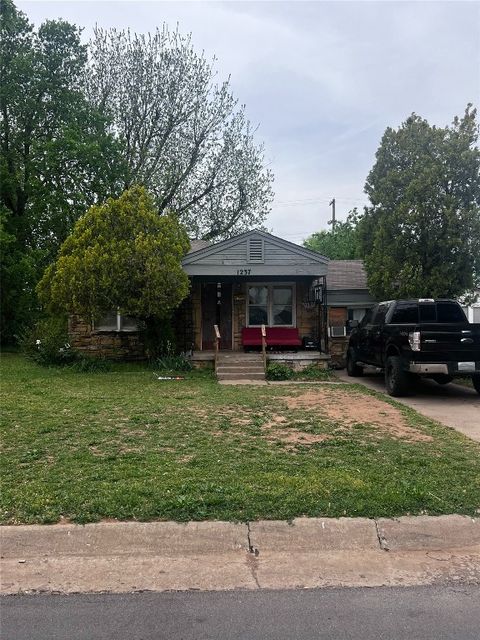
$99,000
2
bds
|
1
ba
|
0
sqft
|
built
1947
1237 Staton Dr, Oklahoma City, OK 73111
$81
Cash flow
4.3%
Cash-on-Cash Return
6.7%
Cap rate
0.9%
Rent to Value Ratio

Active
$475,000
6
bds
|
3
ba
|
0
sqft
|
built
1930
2110 N Kelley Ave, Oklahoma City, OK 73111
$-1,144
Cash flow
-12.6%
Cash-on-Cash Return
2.8%
Cap rate
0.3%
Rent to Value Ratio
Active
$160,000
3
bds
|
1
ba
|
0
sqft
|
built
1928
1212 NE 17th St, Oklahoma City, OK 73111
$99
Cash flow
3.2%
Cash-on-Cash Return
6.4%
Cap rate
0.8%
Rent to Value Ratio
Active
$245,000
3
bds
|
2
ba
|
0
sqft
|
built
2022
1800 N Nebraska Ave, Oklahoma City, OK 73111
$-207
Cash flow
-4.4%
Cash-on-Cash Return
4.7%
Cap rate
0.6%
Rent to Value Ratio
Active
$324,900
3
bds
|
3
ba
|
0
sqft
|
built
1951
1700 NE 67th St, Oklahoma City, OK 73111
$-623
Cash flow
-10.0%
Cash-on-Cash Return
3.4%
Cap rate
0.6%
Rent to Value Ratio
Active
$135,000
3
bds
|
1
ba
|
0
sqft
|
built
1954
1708 NE 47th St, Oklahoma City, OK 73111
$190
Cash flow
7.3%
Cash-on-Cash Return
7.4%
Cap rate
1.0%
Rent to Value Ratio
Active
$145,000
2
bds
|
1
ba
|
0
sqft
|
built
1934
2045 NE 17th St, Oklahoma City, OK 73111
$168
Cash flow
6.0%
Cash-on-Cash Return
7.1%
Cap rate
0.9%
Rent to Value Ratio
Active
$112,000
3
bds
|
1
ba
|
0
sqft
|
built
1950
1400 NE 27th St, Oklahoma City, OK 73111
$79
Cash flow
3.7%
Cash-on-Cash Return
6.5%
Cap rate
0.9%
Rent to Value Ratio
Active
$137,000
3
bds
|
2
ba
|
0
sqft
|
built
1963
2525 NE 18th St, Oklahoma City, OK 73111
$243
Cash flow
9.3%
Cash-on-Cash Return
7.8%
Cap rate
1.0%
Rent to Value Ratio
Active
$134,000
2
bds
|
2
ba
|
0
sqft
|
built
1930
2200 NE 22nd St, Oklahoma City, OK 73111
$110
Cash flow
4.3%
Cash-on-Cash Return
6.7%
Cap rate
0.9%
Rent to Value Ratio
Active
$171,990
3
bds
|
2
ba
|
0
sqft
|
built
1935
2208 N Hood St, Oklahoma City, OK 73111
$-148
Cash flow
-4.5%
Cash-on-Cash Return
4.6%
Cap rate
0.7%
Rent to Value Ratio
Active
$185,000
5
bds
|
3
ba
|
0
sqft
|
built
1930
1801 E Madison St, Oklahoma City, OK 73111
$-85
Cash flow
-2.4%
Cash-on-Cash Return
5.1%
Cap rate
0.7%
Rent to Value Ratio
Active
$125,000
3
bds
|
2
ba
|
0
sqft
|
built
1924
2609 N Fonshill Ave, Oklahoma City, OK 73111
$114
Cash flow
4.8%
Cash-on-Cash Return
6.8%
Cap rate
0.9%
Rent to Value Ratio

Active
$152,000
3
bds
|
1
ba
|
0
sqft
|
built
1948
1321 Campbell Rd, Oklahoma City, OK 73111
$-3
Cash flow
-0.1%
Cash-on-Cash Return
5.7%
Cap rate
0.7%
Rent to Value Ratio
Active
$399,000
3
bds
|
2
ba
|
0
sqft
|
built
1936
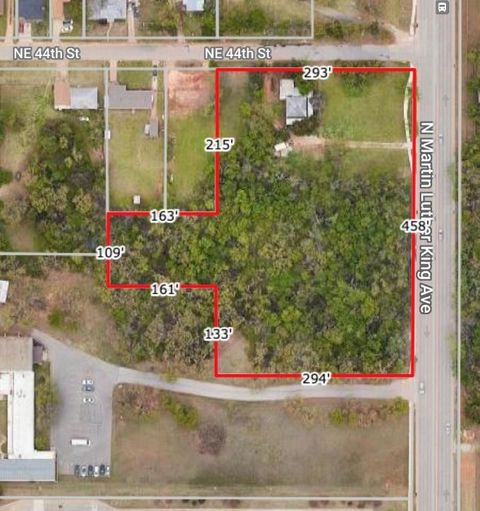
4435 N Martin Luther King Ave, Oklahoma City, OK 73111
$-461
Cash flow
-6.0%
Cash-on-Cash Return
4.3%
Cap rate
0.6%
Rent to Value Ratio
Active
$1,495,000
7
bds
|
8
ba
|
0
sqft
|
built
2007
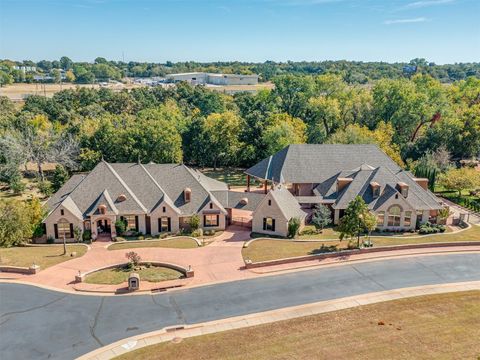
4808 Rose Rock Dr, Oklahoma City, OK 73111
$-5,572
Cash flow
-19.4%
Cash-on-Cash Return
1.2%
Cap rate
0.3%
Rent to Value Ratio
Active
$179,500
4
bds
|
2
ba
|
0
sqft
|
built
1949
1417 NE 44th St, Oklahoma City, OK 73111
$224
Cash flow
6.5%
Cash-on-Cash Return
7.2%
Cap rate
0.9%
Rent to Value Ratio