
$65,000
Investment Summary
- Monthly Cash Flow
- $324
- Cap Rate
- 6.0%
- Cash-on-Cash Return
- 5.8%
- Debt Coverage Ratio
- n/a
- Internal Rate of Return (5 years)
- 9.7%
Cash Flow
Net Operating Income (NOI) minus mortgage payments.
Calculation:
NOI - Mortgage Payments
Cap Rate (Market Value)
Capitalization Rate is a rate of return that compares the yearly Net Operating Income (NOI) to the market value.
Calculation:
NOI / Market Value
Cash-on-Cash Return (CoC)
Annual Cash Flow / Cash Invested
Calculation:
Annual cash flow divided by initial cash invested.
Debt Coverage Ratio (DCR)
Net Operating Income (NOI) divided by total debt payments.
Calculation:
NOI / Total Debt Payments
Internal Rate of Return (IRR)
A metric for assessing profitability over time. IRR is the discount rate at which the net present value (NPV) of all future cash flows (positive and negative) from an investment equals zero — including both periodic cash flow (such as rent) and a projected sale at the end of the holding period. It represents the expected annualized return, accounting for income, expenses, and the recovery of capital through a future sale.
Property Description
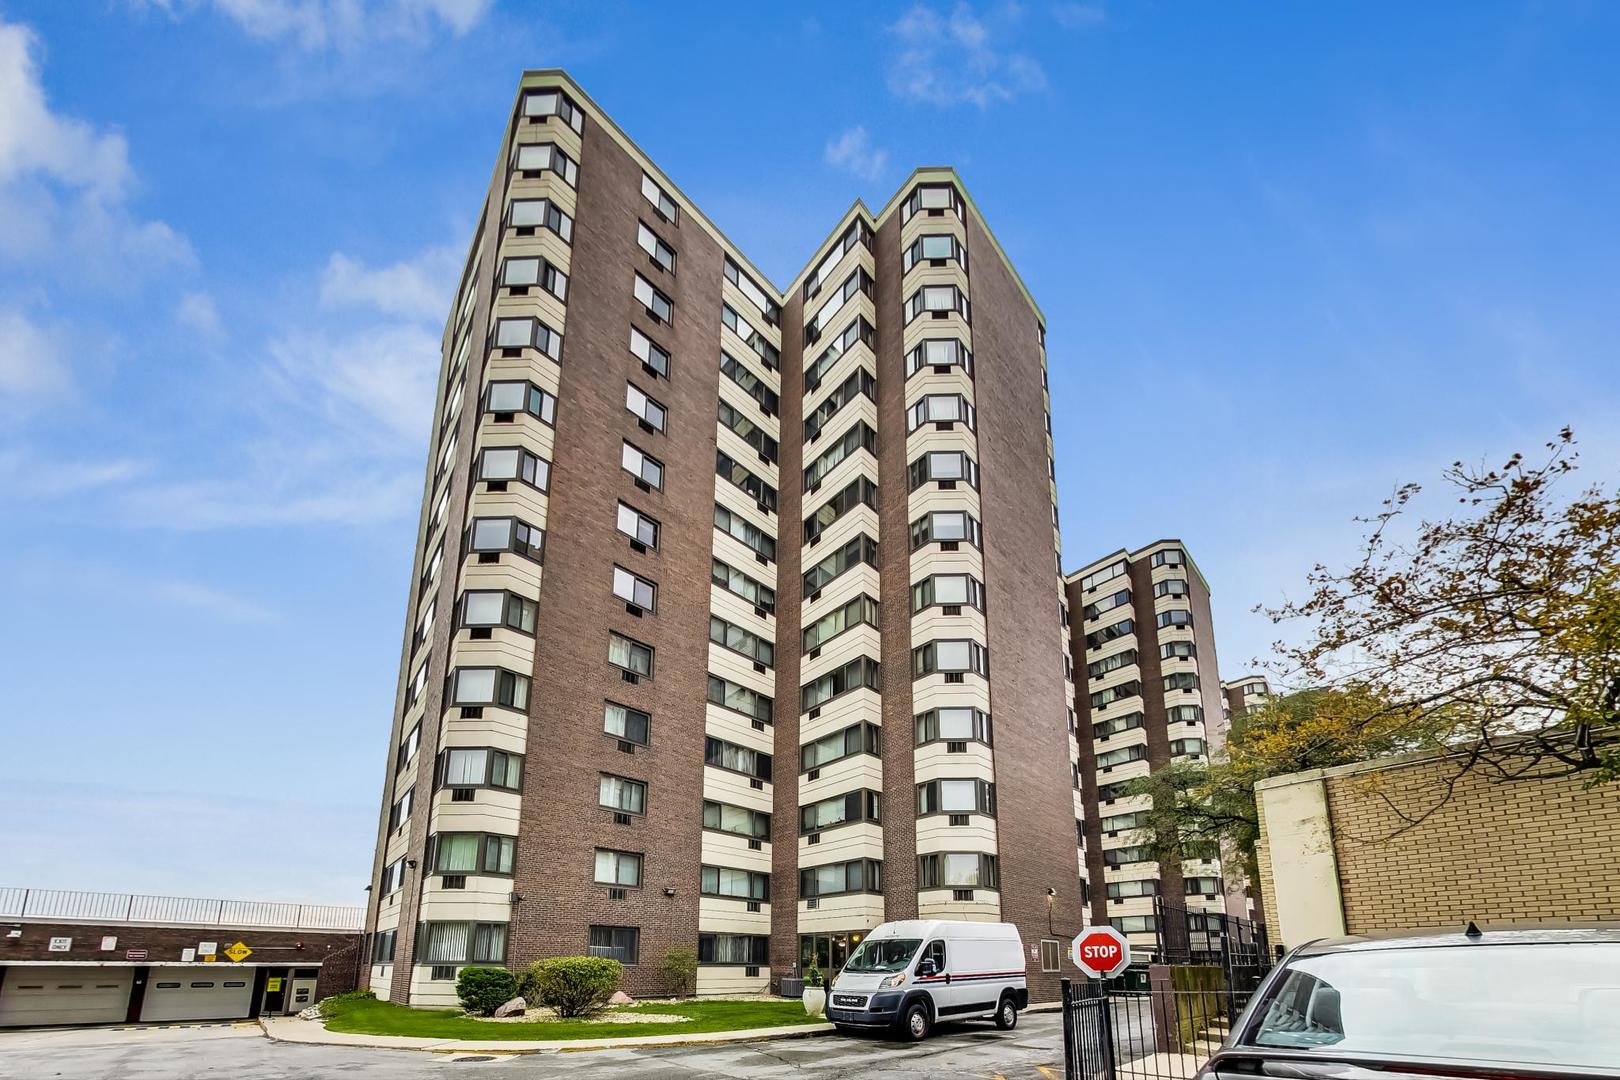
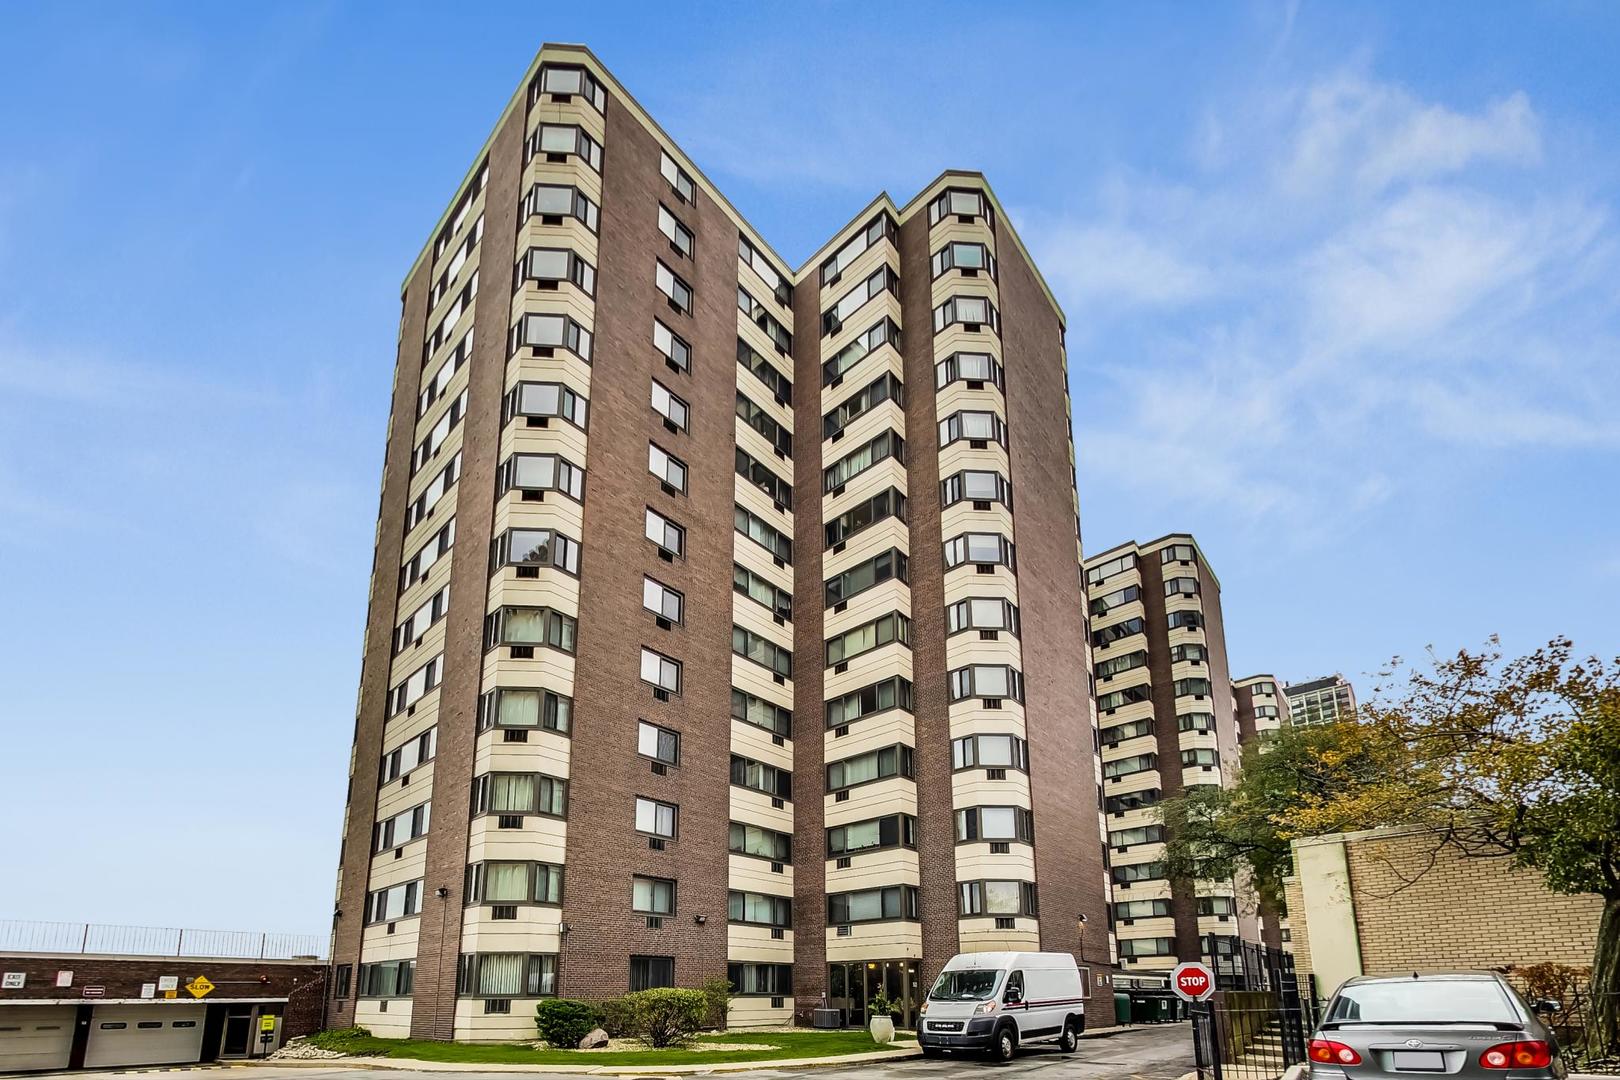
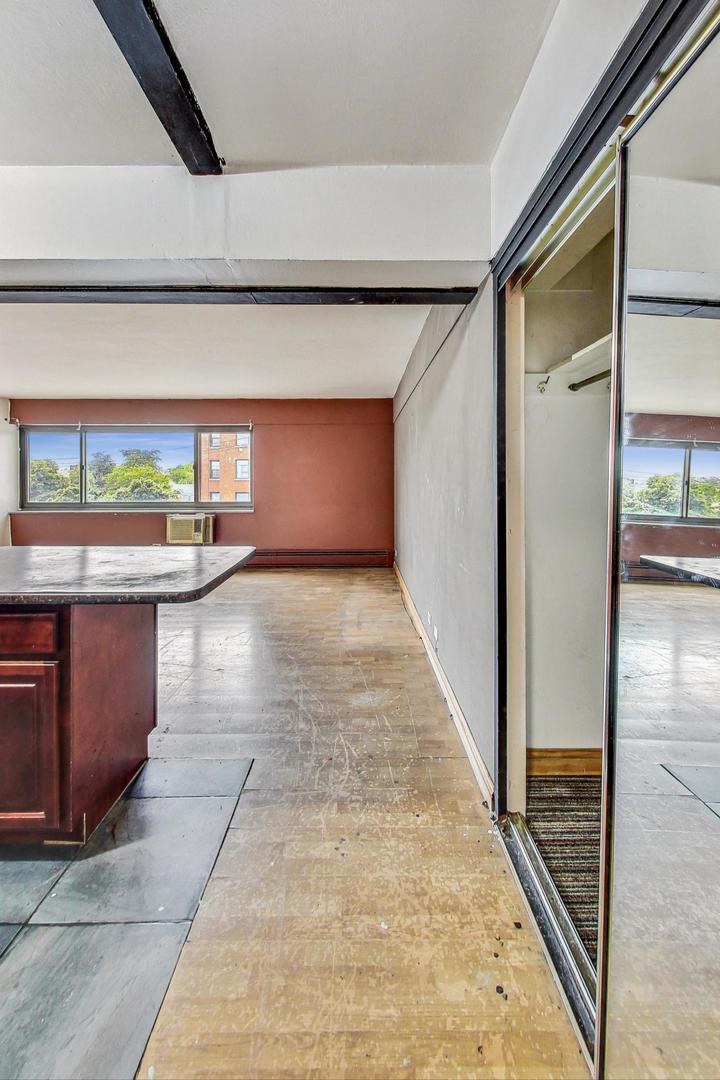
Welcome to 7337 S South Shore Dr Unit 430, a 2-bedroom, 1-bathroom condo in the heart of Chicago's vibrant South Shore neighborhood. This incredible unit offers an unparalleled view of the majestic Lake Michigan, making it the perfect opportunity for those looking to create their dream home with a touch of personalization. Whether you're a handyman or looking for a property that qualifies for rehab financing, this condo is a true diamond in the rough, with the potential to be transformed into a stunning lakeside retreat. Upon entering, you'll be greeted by a spacious and bright living area, where large windows frame breathtaking views of the lake. Imagine waking up to the serene sight of the water every morning, or unwinding in the evening while watching the colors of the sunset reflect on the lake's surface. The living space flows effortlessly into the dining area, making it perfect for hosting guests or enjoying cozy dinners with a backdrop that's second to none. The two bedrooms are generously sized, offering plenty of space for rest and relaxation. The master bedroom also enjoys its own lake view, providing a private escape from the city's hustle and bustle. The second bedroom offers flexibility, whether you need an additional sleeping area, a home office, or a creative space. The full bathroom is conveniently located and ready for a modern update to suit your personal style. One of the standout features of this building is its magnificent terrace, which faces directly toward Lake Michigan. As a resident, you'll have access to this expansive outdoor space, perfect for soaking up the sun, enjoying fresh air, or simply taking in the sweeping views of the lake. Whether you're reading a book, enjoying a cup of coffee, or entertaining friends and family, the terrace provides a tranquil escape just steps from your door. While this condo is brimming with potential, it does require some updates and improvements to fully bring it to life. For those with a vision, this property presents an incredible opportunity to customize and renovate. Whether you plan to utilize rehab financing or prefer to tackle projects yourself, the foundation is solid, and the location is second to none. With your personal touch, this condo could easily be transformed into a chic and modern lakefront haven. Beyond the unit itself, the location offers unbeatable convenience. Situated along the lakefront, you're just steps away from the South Shore Cultural Center, the lakefront trail, and nearby beaches. Public transportation options are easily accessible, and you're just minutes away from downtown Chicago, offering the perfect balance of peaceful lakeside living and city convenience. Local dining, shopping, and entertainment options are all within reach, adding to the appeal of this sought-after neighborhood. Don't miss out on this rare opportunity to own a condo with stunning lake views, a prime location, and endless possibilities. Whether you're an investor looking for a great project or a buyer ready to create your dream home, this unit at 7337 S South Shore Dr is full of potential. Schedule your showing today and start imagining the beautiful transformation that awaits at this lakeside gem.
Build Your Team
Quickly find investor-friendly professionals who can help you succeed in real estate investing at any stage of the investing journey.


Agents
Match with investor-friendly agents who can help you find, analyze, and close your next deal


Lenders
Get the best funding…find investor-friendly lenders who specialize in your deal strategy


Property Managers
Transition to passive investing. Find a trusted property management partnership that lasts.


Tax Pros & Accountants
Taxes and financial reporting made easy—find experts to create tax savings strategies, file taxes, and more
Location
Property Details
Parking
- Details: Asphalt
- Garage Spaces: 0
- Spaces Total: 0
Bedroom Information
- # of Bedrooms: 2
Bathroom Information
- # of Baths (Full): 1
- # of Baths (Total): 1.0
Interior Features
- # of Rooms: 5
- # of Stories: 14
- Basement Description: None
Exterior Features
- Foundation: Concrete Perimeter
- Roof Material: Asphalt
HOA
- Has HOA: Yes
- HOA Fee: $677/monthly
Land Information
- Land Use: Residential
- Land Use Subtype: Condominium Unit
Lot Information
- Parcel ID: 21301140291338
- Lot Size: 0 sqft
Property Information
- Property Type: Condominium
- Year Built: 1964
Tax Information
- Annual Tax: $411
Utilities
- Heating: Baseboard, Radiant
- Cooling: Wall Unit(s)
Location
- County: Cook
Listing Details
Investment Summary
- Monthly Cash Flow
- $324
- Cap Rate
- 6.0%
- Cash-on-Cash Return
- 5.8%
- Debt Coverage Ratio
- n/a
- Internal Rate of Return (5 years)
- 9.7%
Cash Flow
Net Operating Income (NOI) minus mortgage payments.
Calculation:
NOI - Mortgage Payments
Cap Rate (Market Value)
Capitalization Rate is a rate of return that compares the yearly Net Operating Income (NOI) to the market value.
Calculation:
NOI / Market Value
Cash-on-Cash Return (CoC)
Annual Cash Flow / Cash Invested
Calculation:
Annual cash flow divided by initial cash invested.
Debt Coverage Ratio (DCR)
Net Operating Income (NOI) divided by total debt payments.
Calculation:
NOI / Total Debt Payments
Internal Rate of Return (IRR)
A metric for assessing profitability over time. IRR is the discount rate at which the net present value (NPV) of all future cash flows (positive and negative) from an investment equals zero — including both periodic cash flow (such as rent) and a projected sale at the end of the holding period. It represents the expected annualized return, accounting for income, expenses, and the recovery of capital through a future sale.
Purchase Details
Purchase PriceThe price paid for the property. Purchase price:
| $65,000 |
|---|---|
Amount FinancedThe amount of the purchase financed through a loan. Amount financed:
| $0 |
Down paymentThe initial payment made towards the purchase. Down payment:
| $65,000 |
Closing CostsFees and expenses associated with purchasing a property, typically ranging from 2% to 5% of the home’s purchase price, paid at the end of a home purchase to cover services like lending, title transfer, and taxes. Closing costs:
| $1,950 |
Rehab CostsCosts incurred to repair or improve the property, including: roof, flooring, exterior siding, kitchen, exterior paint, bathrooms, etc. Rehab costs:
| $0 |
Initial Cash InvestedThe total initial cash invested in the property. Calculation:Down payment + Buying costs + Rehab costs Initial cash invested:
| $66,950 |
Square Feet (SQFT)The total square footage of the property. Square feet:
| 933 |
Cost Per Square FootCost per square foot of the property. Calculation:Purchase Price / Square Feet Cost per square foot:
| $70 |
Monthly Rent Per Square FootMonthly rent divided by the number of square feet. This ratio helps investors compare rental income efficiency across properties, markets, and unit sizes Calculation:Monthly Rent / Square Feet Monthly rent per square foot:
| $1.61 |
Financing Details
Loan AmountThe total sum of money borrowed from a lender to finance a property purchase. Calculation:Purchase Price - Down Payment
Loan amount:
| $0 |
|---|
Financing is not included in this analysis because the purchase price is under $75,000. Most lenders have minimum loan amounts and typically do not provide financing for properties below this threshold. However, if you’d like to include financing, you can customize the value through the Customize Inputs tab.
Operating Income
| % Rent | Monthly | Yearly | |
|---|---|---|---|
Gross RentThe total rental income received from tenants before deducting any expenses. Includes base rent, late fees, pet fees, parking fees, and other recurring charges.
Gross rent:
| $1,500 | $18,000 | |
Vacancy LossExpected loss of rent due to vacancies.
Vacancy loss:
(6%)
| 6% | -$90 | -$1,080 |
Operating IncomeGross rental income minus vacancy loss. Calculation:Gross rent - Vacancy loss
Operating income:
| $1,410 | $16,920 |
Operating Expenses
| % Rent | Monthly | Yearly | |
|---|---|---|---|
Property TaxesAnnual taxes levied by local governments on real estate properties. These taxes fund public services like schools, roads, and emergency services. | 2% | -$34 | -$411 |
InsuranceThe costs for insurance coverage to protect against financial losses due to risks like fire, natural disasters, theft, liability, or tenant-related damages. Calculation:Assumes 7% of gross rental income, unless insurance rates are specified. | 7% | -$105 | -$1,260 |
Property ManagementThe costs associated with hiring a property manager to handle the day-to-day operations of a rental property. Includes management fees, leasing fes, eviction fees, etc. Calculation:Assumes 8% of gross rental income. | 8% | -$120 | -$1,440 |
Repairs & MaintenanceOngoing costs for routine upkeep and minor fixes needed to keep a property in good working condition. Calculation:Assumes 5% of gross rental income. Varies by property age and condition. | 5% | -$75 | -$900 |
Capital ExpensesLarge, infrequent costs for major improvements or replacements, like a new roof, HVAC system, or appliances. Calculation:Assumes 5% of gross rental income. Varies by property age. | 5% | -$75 | -$900 |
HOA FeesRegular dues paid to a Homeowners Association for community maintenance, amenities, and management. Similar fees include: Condo Association Fees, Co-op Maintenance Fees, etc. | 45% | -$677 | -$8,124 |
Operating ExpensesRecurring costs required to maintain and manage a rental property, including property taxes, insurance, maintenance, repairs, utilities (if paid by the owner), property management fees, and other day-to-day expenses. Calculation:Insurance + Property Taxes + Property Management + Repairs & Maintenance + Capital Expenditures + HOA Fees | 72% | -$1,086 | -$13,035 |
Cash Flow
| Monthly | Yearly | |
|---|---|---|
Net Operating Income (NOI)The income generated from a property after deducting all operating expenses but before deducting mortgage payments, taxes, and capital expenditures. Calculation:Gross Operating Income - Operating Expenses
Net operating income:
| $324 | $3,888 |
Mortgage PaymentThe fixed amount a borrower pays each month to repay a loan. It typically includes principal and interest (P&I) and may also cover property taxes, insurance, HOA fees, and PMI if escrowed. | $0 | $0 |
Cash FlowNet Operating Income (NOI) minus mortgage payments. Calculation:NOI - Mortgage Payments | $324 | $3,888 |