60649 Investment Properties for Sale
Browse homes for sale and investment properties in 60649. Refine your search by price, property type, or more.
Best cash flowing properties in 60649
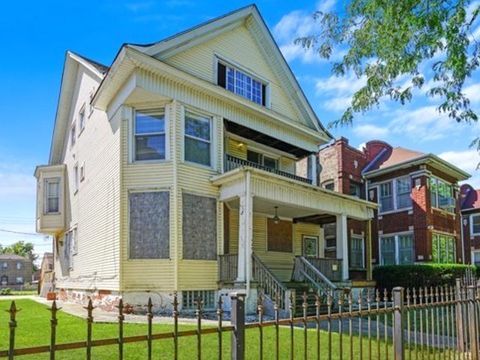
Active
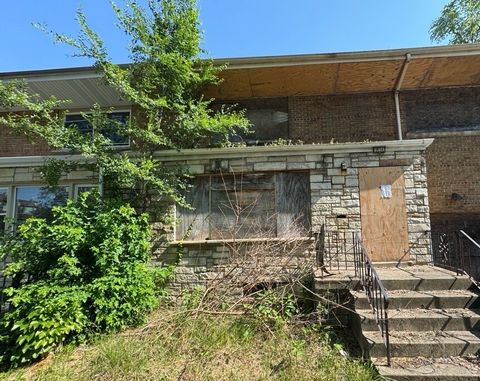
$50,000
3
bds
|
1
ba
|
1,789
sqft
|
built
1954
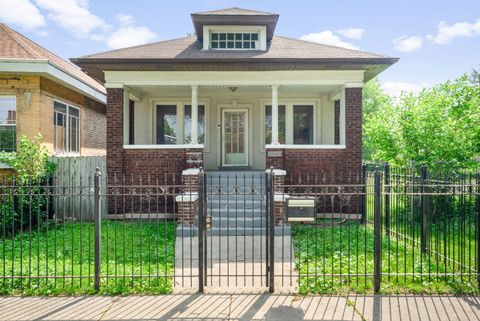
2650 E 77th St, Chicago, IL 60649
$1,186
Cash flow
27.6%
Cash-on-Cash Return
28.5%
Cap rate
4.0%
Rent to Value Ratio
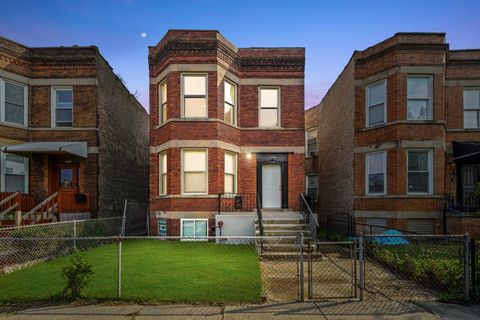
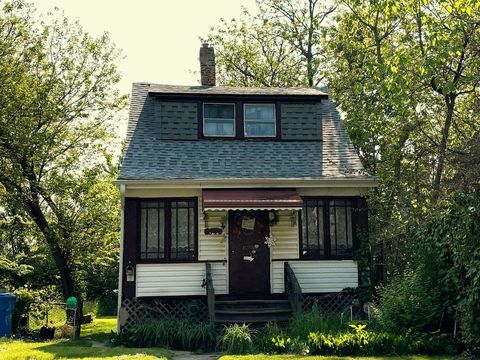
Active
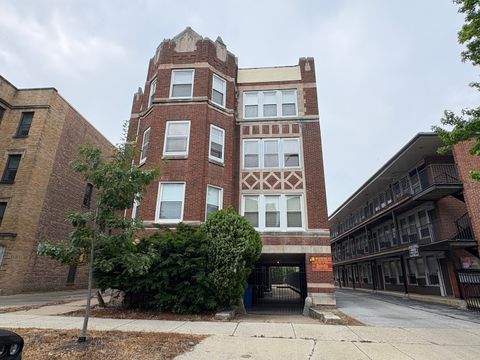
$42,500
3
bds
|
2
ba
|
1,150
sqft
|
built
1922
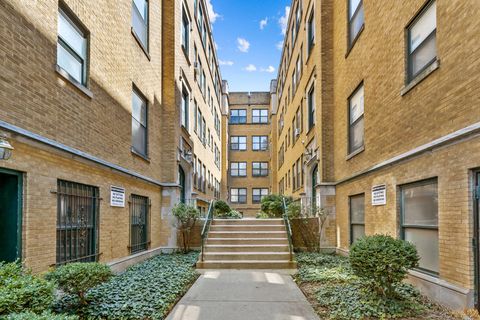
6836 S Crandon Ave, Chicago, IL 60649
$1,005
Cash flow
27.5%
Cash-on-Cash Return
28.4%
Cap rate
3.5%
Rent to Value Ratio
45 out of 57 properties for sale in 60649
Limited Results Shown
Create a free account, or log in to reveal all property listings and enjoy the complete experience.
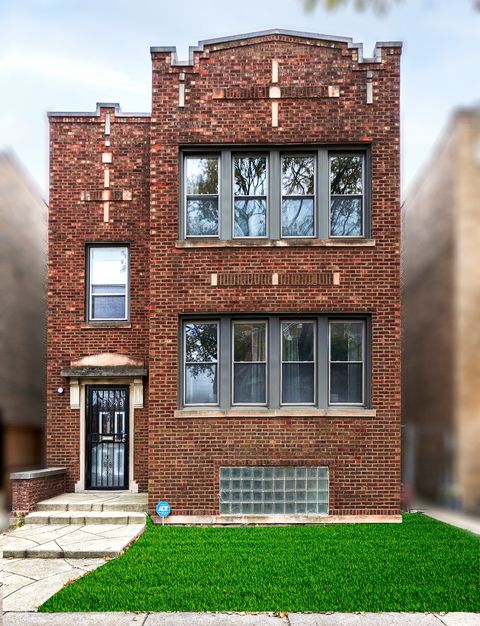
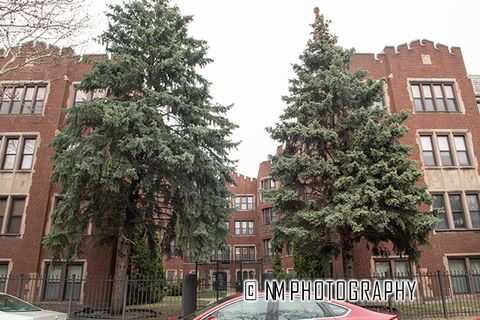
Active
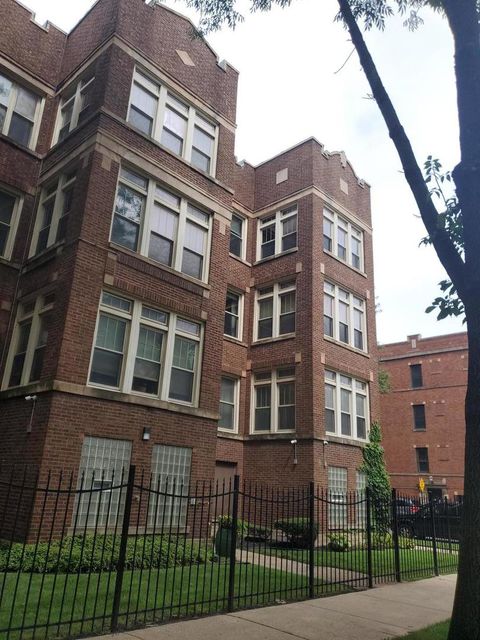
$90,000
3
bds
|
2
ba
|
1,200
sqft
|
built
1924
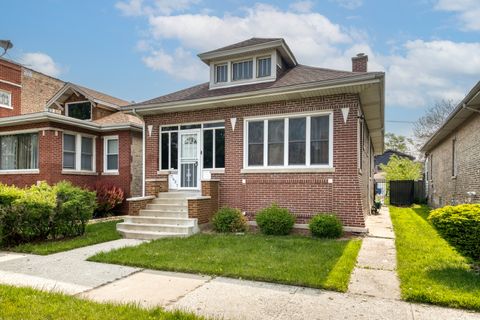
2234 E 70th Pl, Chicago, IL 60649
$581
Cash flow
33.7%
Cash-on-Cash Return
13.4%
Cap rate
1.8%
Rent to Value Ratio
Active
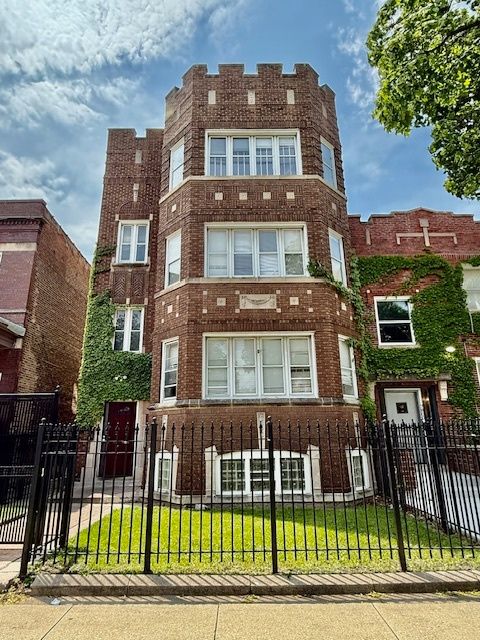
$394,900
9
bds
|
6
ba
|
0
sqft
|
built
1928
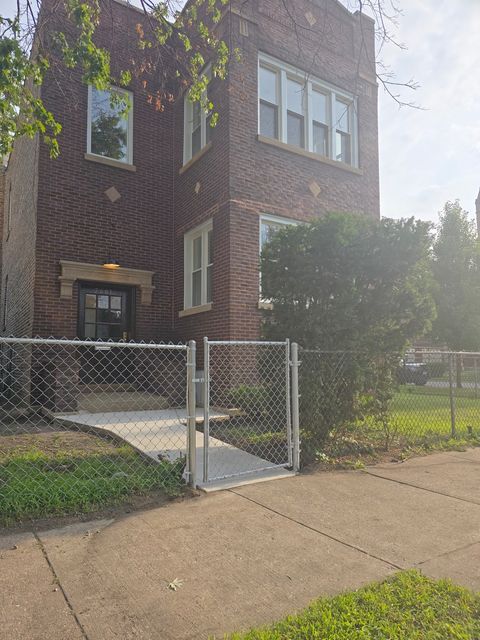
7804 S Burnham Ave, Chicago, IL 60649
$-1,056
Cash flow
-14.0%
Cash-on-Cash Return
2.5%
Cap rate
0.4%
Rent to Value Ratio
Active
$135,000
6
bds
|
3
ba
|
0
sqft
|
built
1894
2115 E 72nd Pl, Chicago, IL 60649
$736
Cash flow
28.4%
Cash-on-Cash Return
12.2%
Cap rate
1.7%
Rent to Value Ratio
Active
$389,900
6
bds
|
3
ba
|
0
sqft
|
built
1908
1759 E 72nd Pl, Chicago, IL 60649
$-1,144
Cash flow
-15.3%
Cash-on-Cash Return
2.2%
Cap rate
0.4%
Rent to Value Ratio
Active
$399,000
4
bds
|
2
ba
|
0
sqft
|
built
1918
6923 S Merrill Ave, Chicago, IL 60649
$-482
Cash flow
-6.3%
Cash-on-Cash Return
4.2%
Cap rate
0.7%
Rent to Value Ratio
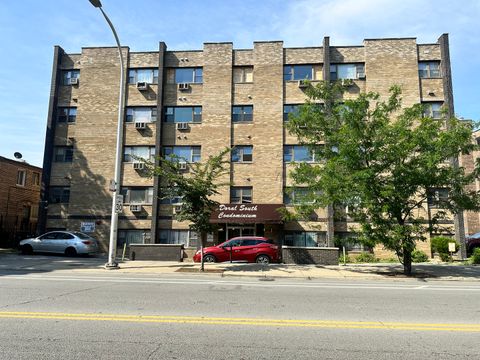
Active
$65,000
1
bds
|
1
ba
|
675
sqft
|
built
1974
7854 S South Shore Dr, Chicago, IL 60649
$593
Cash flow
10.6%
Cash-on-Cash Return
10.9%
Cap rate
2.0%
Rent to Value Ratio
Active
$234,900
3
bds
|
1
ba
|
1,154
sqft
|
built
1913
7545 S Ridgeland Ave, Chicago, IL 60649
$442
Cash flow
9.8%
Cash-on-Cash Return
7.9%
Cap rate
1.1%
Rent to Value Ratio
Active
$49,900
1
bds
|
1
ba
|
750
sqft
|
built
1923
7205 S Yates Blvd, Chicago, IL 60649
$553
Cash flow
12.9%
Cash-on-Cash Return
13.3%
Cap rate
2.8%
Rent to Value Ratio
Active
$150,000
2
bds
|
2
ba
|
1,240
sqft
|
built
1920
7637 S Ridgeland Ave, Chicago, IL 60649
$596
Cash flow
20.7%
Cash-on-Cash Return
10.4%
Cap rate
1.5%
Rent to Value Ratio
Active
$424,900
6
bds
|
2
ba
|
0
sqft
|
built
1918
2601 E 78th St, Chicago, IL 60649
$-1,221
Cash flow
-15.0%
Cash-on-Cash Return
2.2%
Cap rate
0.3%
Rent to Value Ratio
Active
$284,900
6
bds
|
3
ba
|
0
sqft
|
built
1927
7539 S Yates Blvd, Chicago, IL 60649
$-31
Cash flow
-0.6%
Cash-on-Cash Return
5.5%
Cap rate
0.8%
Rent to Value Ratio
Active
$350,000
4
bds
|
2
ba
|
2,200
sqft
|
built
1898
7422 S Coles Ave, Chicago, IL 60649
$-1,028
Cash flow
-15.3%
Cash-on-Cash Return
2.2%
Cap rate
0.4%
Rent to Value Ratio
Active
$1,674,900
8
bds
|
6
ba
|
0
sqft
|
built
1926
6909 S Chappel Ave, Chicago, IL 60649
$-6,937
Cash flow
-21.6%
Cash-on-Cash Return
0.7%
Cap rate
0.1%
Rent to Value Ratio

Active
$72,900
1
bds
|
1
ba
|
700
sqft
|
built
1964
7337 S South Shore Dr, Chicago, IL 60649
$-9
Cash flow
-0.1%
Cash-on-Cash Return
-0.1%
Cap rate
1.2%
Rent to Value Ratio
Active
$135,000
2
bds
|
1
ba
|
980
sqft
|
built
1954
2430 E 73rd St, Chicago, IL 60649
$377
Cash flow
14.6%
Cash-on-Cash Return
9.0%
Cap rate
1.2%
Rent to Value Ratio
Active
$215,000
3
bds
|
2
ba
|
2,300
sqft
|
built
1925
6727 S Merrill Ave, Chicago, IL 60649
$-422
Cash flow
-10.2%
Cash-on-Cash Return
3.3%
Cap rate
1.0%
Rent to Value Ratio
Active
$695,000
4
bds
|
3
ba
|
1,806
sqft
|
built
1888
7316 S South Shore Dr, Chicago, IL 60649
$-1,063
Cash flow
-8.0%
Cash-on-Cash Return
3.8%
Cap rate
0.5%
Rent to Value Ratio
Active
$340,000
5
bds
|
2
ba
|
0
sqft
|
built
1922
7846 S Bennett Ave, Chicago, IL 60649
$-338
Cash flow
-5.2%
Cash-on-Cash Return
4.5%
Cap rate
0.6%
Rent to Value Ratio
Active
$235,000
3
bds
|
2
ba
|
1,225
sqft
|
built
1905
7819 S Colfax Ave, Chicago, IL 60649
$-115
Cash flow
-2.6%
Cash-on-Cash Return
5.1%
Cap rate
0.7%
Rent to Value Ratio
Active
$389,000
3
bds
|
3
ba
|
0
sqft
|
built
1914
6843 S Chappel Ave, Chicago, IL 60649
$-4
Cash flow
-0.1%
Cash-on-Cash Return
5.7%
Cap rate
0.8%
Rent to Value Ratio
Active
$140,000
4
bds
|
2
ba
|
1,140
sqft
|
built
1918
7655 S Clyde Ave, Chicago, IL 60649
$347
Cash flow
12.9%
Cash-on-Cash Return
8.7%
Cap rate
1.2%
Rent to Value Ratio
Active
$440,000
3
bds
|
5
ba
|
3,912
sqft
|
built
1920
7711 S Ridgeland Ave, Chicago, IL 60649
$-1,154
Cash flow
-13.7%
Cash-on-Cash Return
2.5%
Cap rate
0.4%
Rent to Value Ratio
Active
$174,900
3
bds
|
1
ba
|
1,104
sqft
|
built
1903
7522 S Merrill Ave, Chicago, IL 60649
$238
Cash flow
7.1%
Cash-on-Cash Return
7.3%
Cap rate
1.0%
Rent to Value Ratio
Active
$369,999
16
bds
|
8
ba
|
0
sqft
|
built
1923
2445 E 74th Pl, Chicago, IL 60649
$-1,156
Cash flow
-16.3%
Cash-on-Cash Return
1.9%
Cap rate
0.4%
Rent to Value Ratio
Active
$125,000
2
bds
|
2
ba
|
1,100
sqft
|
built
1950
7854 S South Shore Dr, Chicago, IL 60649
$68
Cash flow
2.8%
Cash-on-Cash Return
6.3%
Cap rate
1.3%
Rent to Value Ratio
Active
$210,000
2
bds
|
2
ba
|
1,250
sqft
|
built
1920
1729 E 67th St, Chicago, IL 60649
$-84
Cash flow
-2.1%
Cash-on-Cash Return
5.2%
Cap rate
0.8%
Rent to Value Ratio
Active
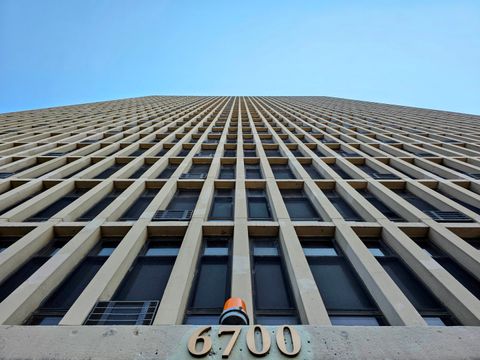
$135,000
1
bds
|
1
ba
|
850
sqft
|
built
1968
6700 S South Shore Dr, Chicago, IL 60649
$-282
Cash flow
-10.9%
Cash-on-Cash Return
3.2%
Cap rate
1.0%
Rent to Value Ratio
Active
$220,000
4
bds
|
2
ba
|
0
sqft
|
built
1888
6907 S Cornell Ave, Chicago, IL 60649
$516
Cash flow
12.2%
Cash-on-Cash Return
8.5%
Cap rate
1.1%
Rent to Value Ratio
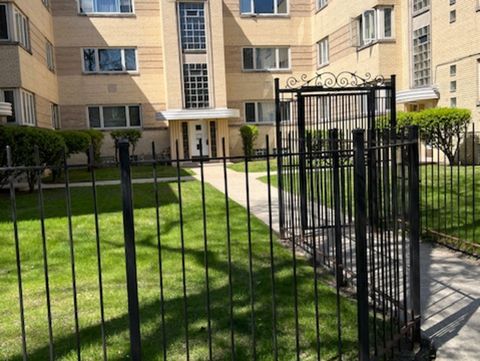
Active
$136,000
1
bds
|
1
ba
|
600
sqft
|
built
1968
6700 S South Shore Dr, Chicago, IL 60649
$278
Cash flow
10.7%
Cash-on-Cash Return
8.1%
Cap rate
1.0%
Rent to Value Ratio
Active
$95,999
1
bds
|
1
ba
|
713
sqft
|
built
1911
7543 S Colfax Ave, Chicago, IL 60649
$649
Cash flow
35.3%
Cash-on-Cash Return
13.8%
Cap rate
1.7%
Rent to Value Ratio
Active
$260,000
5
bds
|
2
ba
|
2,087
sqft
|
built
1928
1942 E 74th St, Chicago, IL 60649
$-46
Cash flow
-0.9%
Cash-on-Cash Return
5.5%
Cap rate
0.9%
Rent to Value Ratio
Active
$109,500
2
bds
|
1
ba
|
900
sqft
|
built
1946
2030 E 72nd Pl, Chicago, IL 60649
$81
Cash flow
3.9%
Cash-on-Cash Return
6.6%
Cap rate
1.4%
Rent to Value Ratio
Active
$77,000
2
bds
|
1
ba
|
750
sqft
|
built
1975
6707 S Chappel Ave, Chicago, IL 60649
$189
Cash flow
12.8%
Cash-on-Cash Return
8.6%
Cap rate
1.7%
Rent to Value Ratio
Active
$120,000
2
bds
|
1
ba
|
0
sqft
|
built
1970
7308 S Yates Blvd, Chicago, IL 60649
$129
Cash flow
5.6%
Cash-on-Cash Return
7.0%
Cap rate
1.3%
Rent to Value Ratio

Active
$175,000
6
bds
|
2
ba
|
0
sqft
|
built
1922
7747 S Cornell Ave, Chicago, IL 60649
$208
Cash flow
6.2%
Cash-on-Cash Return
7.1%
Cap rate
1.0%
Rent to Value Ratio

Active
$524,999
3
bds
|
3
ba
|
2,634
sqft
|
built
1955
6707 S Euclid Ave, Chicago, IL 60649
$-565
Cash flow
-5.6%
Cash-on-Cash Return
4.4%
Cap rate
0.7%
Rent to Value Ratio
Active
$229,999
3
bds
|
2
ba
|
0
sqft
|
built
1921
6756 S Oglesby Ave, Chicago, IL 60649
$-701
Cash flow
-15.9%
Cash-on-Cash Return
2.0%
Cap rate
0.7%
Rent to Value Ratio
Active
$628,900
4
bds
|
4
ba
|
3,800
sqft
|
built
1920
7237 S Luella Ave, Chicago, IL 60649
$-886
Cash flow
-7.4%
Cash-on-Cash Return
4.0%
Cap rate
0.6%
Rent to Value Ratio