74126 Investment Properties for Sale
Browse homes for sale and investment properties in 74126. Refine your search by price, property type, or more.
Best cash flowing properties in 74126
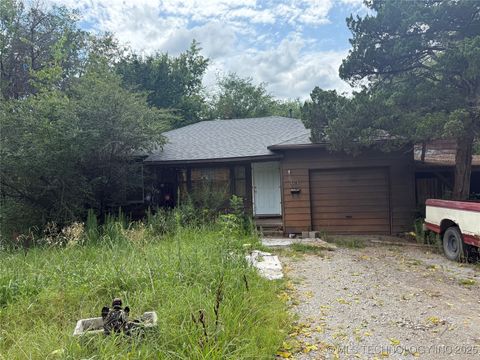
Active
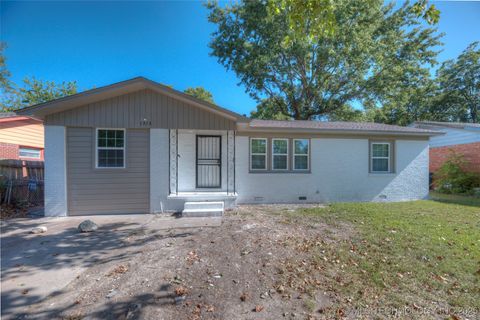
$62,500
4
bds
|
2
ba
|
2,084
sqft
|
built
1952
6416 N Rockford Ave, Tulsa, OK 74126
$1,165
Cash flow
21.7%
Cash-on-Cash Return
22.4%
Cap rate
2.9%
Rent to Value Ratio

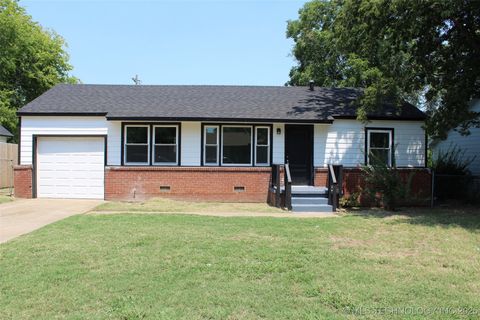
Active
$54,000
3
bds
|
1
ba
|
912
sqft
|
built
1963
5922 N Garrison Ave, Tulsa, OK 74126
$716
Cash flow
15.4%
Cash-on-Cash Return
15.9%
Cap rate
2.0%
Rent to Value Ratio
17 out of 25 properties for sale in 74126
Limited Results Shown
Create a free account, or log in to reveal all property listings and enjoy the complete experience.

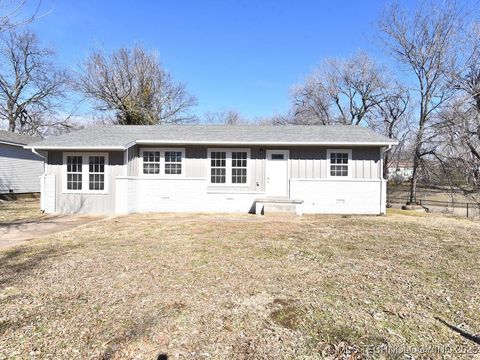
Active
$130,000
3
bds
|
1
ba
|
1,248
sqft
|
built
1958
729 E 54th St N, Tulsa, OK 74126
$55
Cash flow
2.2%
Cash-on-Cash Return
6.2%
Cap rate
0.8%
Rent to Value Ratio
Active
$130,000
3
bds
|
1
ba
|
962
sqft
|
built
1958
713 E 54th Pl N, Tulsa, OK 74126
$-14
Cash flow
-0.6%
Cash-on-Cash Return
5.5%
Cap rate
0.7%
Rent to Value Ratio

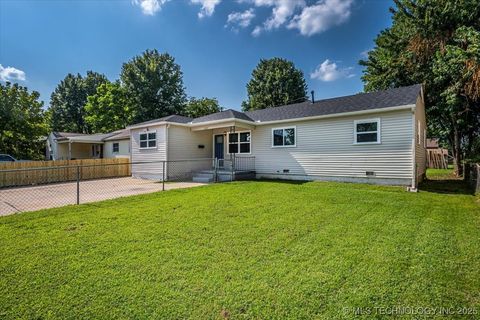
Active
$75,000
2
bds
|
1
ba
|
936
sqft
|
built
1958
241 E 53rd St N, Tulsa, OK 74126
$359
Cash flow
25.0%
Cash-on-Cash Return
11.4%
Cap rate
1.5%
Rent to Value Ratio
Active
$115,000
3
bds
|
1
ba
|
864
sqft
|
built
1954
509 E 48th Pl N, Tulsa, OK 74126
$186
Cash flow
8.4%
Cash-on-Cash Return
7.6%
Cap rate
1.0%
Rent to Value Ratio
Active
$163,000
4
bds
|
3
ba
|
1,307
sqft
|
built
1950
1557 E 52nd St N, Tulsa, OK 74126
$-137
Cash flow
-4.4%
Cash-on-Cash Return
4.7%
Cap rate
0.6%
Rent to Value Ratio
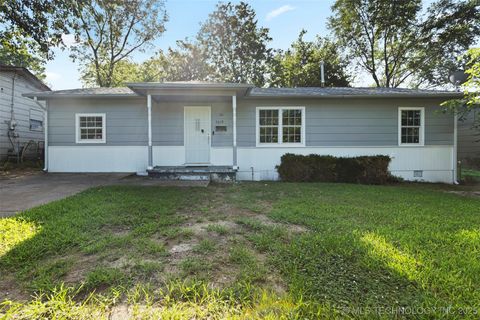
Active
$135,000
3
bds
|
1
ba
|
1,162
sqft
|
built
1956
4939 N Trenton Ave, Tulsa, OK 74126
$224
Cash flow
8.7%
Cash-on-Cash Return
7.7%
Cap rate
1.0%
Rent to Value Ratio
Active
$150,000
4
bds
|
2
ba
|
1,338
sqft
|
built
1960
1313 E 51st Pl N, Tulsa, OK 74126
$34
Cash flow
1.2%
Cash-on-Cash Return
6.0%
Cap rate
0.7%
Rent to Value Ratio
Active
$164,000
4
bds
|
2
ba
|
1,198
sqft
|
built
1960
519 E 51st Pl N, Tulsa, OK 74126
$150
Cash flow
4.8%
Cash-on-Cash Return
6.8%
Cap rate
0.9%
Rent to Value Ratio
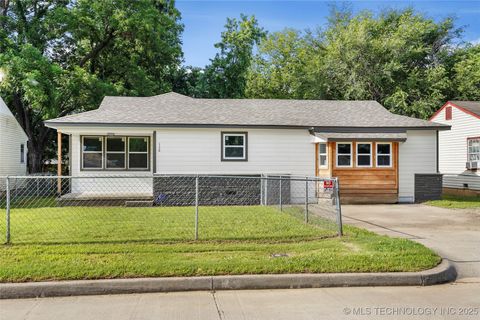
Active
$114,999
3
bds
|
2
ba
|
1,176
sqft
|
built
1962
5619 N Garrison Ave, Tulsa, OK 74126
$187
Cash flow
8.5%
Cash-on-Cash Return
7.6%
Cap rate
1.0%
Rent to Value Ratio
Active
$165,000
3
bds
|
2
ba
|
1,479
sqft
|
built
1957
116 W 49th Pl N, Tulsa, OK 74126
$208
Cash flow
6.6%
Cash-on-Cash Return
7.2%
Cap rate
0.9%
Rent to Value Ratio

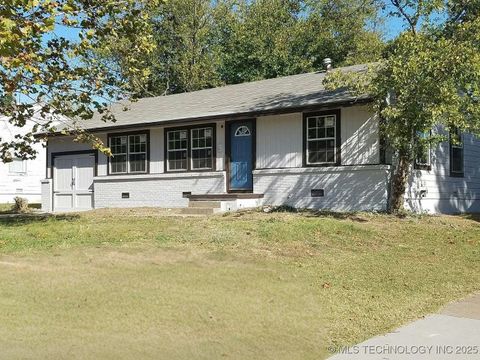
Active
$43,000
3
bds
|
1
ba
|
950
sqft
|
built
1958
215 E 53rd St N, Tulsa, OK 74126
$649
Cash flow
17.6%
Cash-on-Cash Return
18.1%
Cap rate
2.3%
Rent to Value Ratio
Active
$110,000
3
bds
|
1
ba
|
864
sqft
|
built
1948
4604 N Boston Pl, Tulsa, OK 74126
$309
Cash flow
14.7%
Cash-on-Cash Return
9.1%
Cap rate
1.2%
Rent to Value Ratio
Active
$143,000
3
bds
|
2
ba
|
912
sqft
|
built
1955
4667 N Cheyenne Ave, Tulsa, OK 74126
$64
Cash flow
2.3%
Cash-on-Cash Return
6.2%
Cap rate
0.8%
Rent to Value Ratio

Active
$119,900
2
bds
|
2
ba
|
1,317
sqft
|
built
1935
6621 N Peoria Ave, Tulsa, OK 74126
$298
Cash flow
13.0%
Cash-on-Cash Return
8.7%
Cap rate
1.1%
Rent to Value Ratio
Active
$135,000
3
bds
|
1
ba
|
864
sqft
|
built
1956
134 W 50th Ct N, Tulsa, OK 74126
$-256
Cash flow
-9.9%
Cash-on-Cash Return
3.4%
Cap rate
0.8%
Rent to Value Ratio