74133 Investment Properties for Sale
Browse homes for sale and investment properties in 74133. Refine your search by price, property type, or more.
Best cash flowing properties in 74133
Active
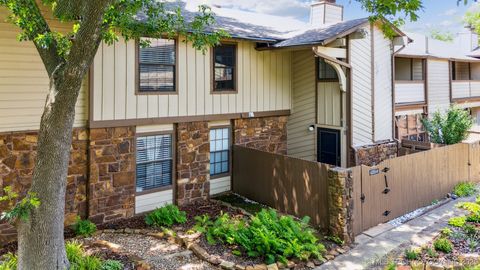
$120,000
2
bds
|
2
ba
|
1,116
sqft
|
built
1982
6355 S 80th East Ave, Tulsa, OK 74133
$-167
Cash flow
-7.3%
Cash-on-Cash Return
4.0%
Cap rate
1.1%
Rent to Value Ratio
Active
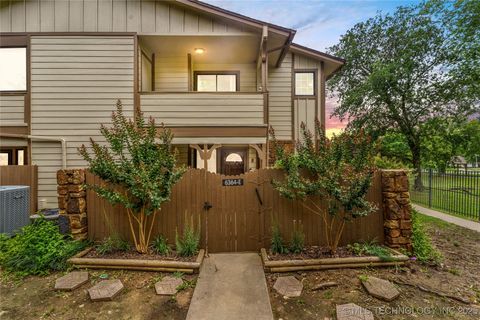
$124,900
2
bds
|
2
ba
|
1,205
sqft
|
built
1982
6364 S 80th East Ave, Tulsa, OK 74133
$-167
Cash flow
-7.0%
Cash-on-Cash Return
4.1%
Cap rate
1.0%
Rent to Value Ratio
73 out of 91 properties for sale in 74133
Limited Results Shown
Create a free account, or log in to reveal all property listings and enjoy the complete experience.
Active
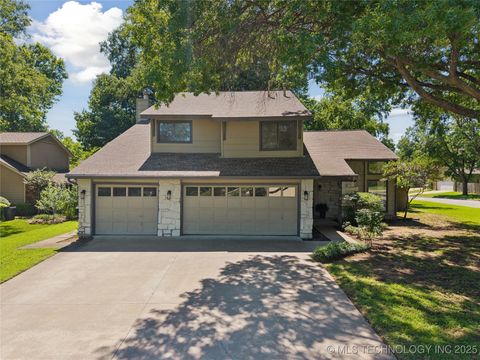
$385,000
4
bds
|
3
ba
|
2,924
sqft
|
built
1979
8912 S 70th East Ave, Tulsa, OK 74133
$-816
Cash flow
-11.1%
Cash-on-Cash Return
3.1%
Cap rate
0.5%
Rent to Value Ratio
Active
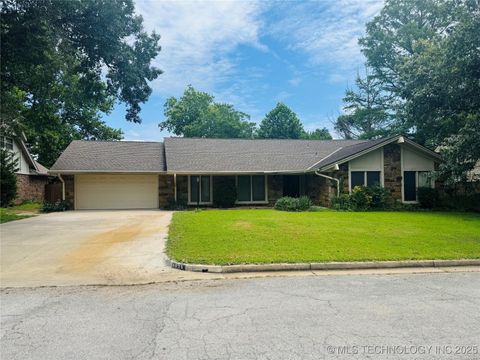
$289,900
4
bds
|
3
ba
|
2,599
sqft
|
built
1972
6635 S 76th East Ave, Tulsa, OK 74133
$-236
Cash flow
-4.2%
Cash-on-Cash Return
4.7%
Cap rate
0.7%
Rent to Value Ratio
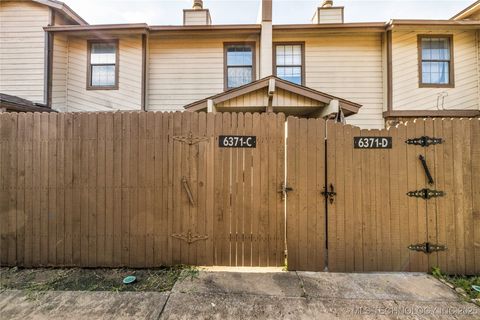
Active
$129,900
2
bds
|
3
ba
|
1,194
sqft
|
built
1982
6371 S 80th East Ave, Tulsa, OK 74133
$-202
Cash flow
-8.1%
Cash-on-Cash Return
3.8%
Cap rate
1.0%
Rent to Value Ratio
Active
$267,700
3
bds
|
2
ba
|
1,693
sqft
|
built
2002
8931 E 62nd Pl, Tulsa, OK 74133
$-452
Cash flow
-8.8%
Cash-on-Cash Return
3.7%
Cap rate
0.6%
Rent to Value Ratio
Active
$469,900
4
bds
|
3
ba
|
2,969
sqft
|
built
1978
8747 S 68th East Ave, Tulsa, OK 74133
$-1,042
Cash flow
-11.6%
Cash-on-Cash Return
3.0%
Cap rate
0.4%
Rent to Value Ratio
Active
$254,900
3
bds
|
2
ba
|
1,666
sqft
|
built
1983
9237 S 91st East Ave, Tulsa, OK 74133
$-225
Cash flow
-4.6%
Cash-on-Cash Return
4.6%
Cap rate
0.7%
Rent to Value Ratio
Active
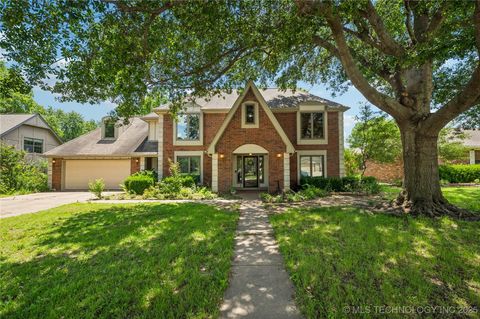
$399,000
4
bds
|
3
ba
|
3,420
sqft
|
built
1985
7222 E 87th St, Tulsa, OK 74133
$-402
Cash flow
-5.3%
Cash-on-Cash Return
4.5%
Cap rate
0.7%
Rent to Value Ratio
Active
$275,000
3
bds
|
2
ba
|
1,591
sqft
|
built
1985
8917 S 77th East Ave, Tulsa, OK 74133
$-330
Cash flow
-6.3%
Cash-on-Cash Return
4.2%
Cap rate
0.7%
Rent to Value Ratio
Active
$370,000
4
bds
|
3
ba
|
3,599
sqft
|
built
1976
9208 S 70th East Ave, Tulsa, OK 74133
$-185
Cash flow
-2.6%
Cash-on-Cash Return
5.1%
Cap rate
0.8%
Rent to Value Ratio
Active
$384,900
3
bds
|
3
ba
|
2,491
sqft
|
built
1984
7020 E 89th St, Tulsa, OK 74133
$-910
Cash flow
-12.3%
Cash-on-Cash Return
2.8%
Cap rate
0.4%
Rent to Value Ratio
Active
$304,000
3
bds
|
3
ba
|
2,125
sqft
|
built
1976
9421 S 69th East Ave, Tulsa, OK 74133
$-422
Cash flow
-7.2%
Cash-on-Cash Return
4.0%
Cap rate
0.6%
Rent to Value Ratio
Active
$415,000
4
bds
|
4
ba
|
3,279
sqft
|
built
1979
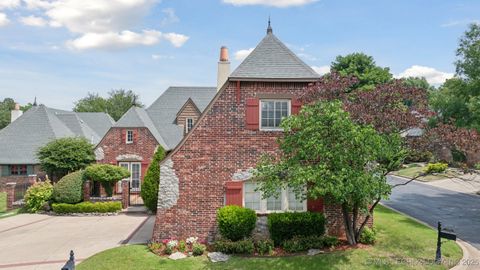
6617 E 88th Pl, Tulsa, OK 74133
$-557
Cash flow
-7.0%
Cash-on-Cash Return
4.1%
Cap rate
0.6%
Rent to Value Ratio
Active
$289,900
3
bds
|
2
ba
|
2,028
sqft
|
built
1972
6914 E 73rd St, Tulsa, OK 74133
$-352
Cash flow
-6.3%
Cash-on-Cash Return
4.2%
Cap rate
0.6%
Rent to Value Ratio
Active
$579,900
4
bds
|
3
ba
|
3,522
sqft
|
built
2008
9402 E 109th St, Tulsa, OK 74133
$-969
Cash flow
-8.7%
Cash-on-Cash Return
3.7%
Cap rate
0.6%
Rent to Value Ratio
Active
$399,900
4
bds
|
3
ba
|
2,608
sqft
|
built
2001
7721 E 101st Pl, Tulsa, OK 74133
$-666
Cash flow
-8.7%
Cash-on-Cash Return
3.7%
Cap rate
0.6%
Rent to Value Ratio
Active
$459,900
4
bds
|
4
ba
|
3,574
sqft
|
built
2003
8811 E 110th St, Tulsa, OK 74133
$-515
Cash flow
-5.8%
Cash-on-Cash Return
4.3%
Cap rate
0.7%
Rent to Value Ratio
Active
$304,999
3
bds
|
3
ba
|
2,759
sqft
|
built
1978
6401 S 86th East Ave, Tulsa, OK 74133
$-404
Cash flow
-6.9%
Cash-on-Cash Return
4.1%
Cap rate
0.7%
Rent to Value Ratio
Active
$408,999
3
bds
|
3
ba
|
2,706
sqft
|
built
1969
6722 S 72nd East Ave, Tulsa, OK 74133
$-684
Cash flow
-8.7%
Cash-on-Cash Return
3.7%
Cap rate
0.5%
Rent to Value Ratio
Active
$420,000
4
bds
|
3
ba
|
2,882
sqft
|
built
1971
6960 E 61st Pl, Tulsa, OK 74133
$-455
Cash flow
-5.7%
Cash-on-Cash Return
4.4%
Cap rate
0.7%
Rent to Value Ratio
Active
$549,900
5
bds
|
3
ba
|
3,876
sqft
|
built
2003
8906 E 110th St, Tulsa, OK 74133
$-1,156
Cash flow
-11.0%
Cash-on-Cash Return
3.2%
Cap rate
0.5%
Rent to Value Ratio
Active
$515,000
4
bds
|
3
ba
|
3,679
sqft
|
built
2005
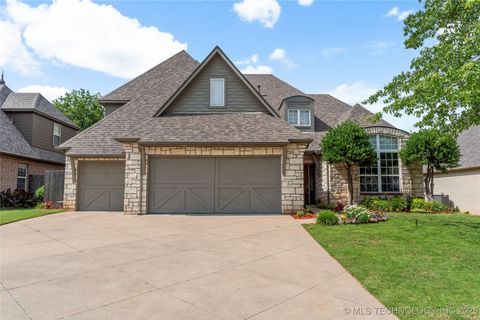
10480 S 86th East Ave, Tulsa, OK 74133
$-653
Cash flow
-6.6%
Cash-on-Cash Return
4.2%
Cap rate
0.6%
Rent to Value Ratio
Active
$283,000
4
bds
|
2
ba
|
2,504
sqft
|
built
1996
9128 E 74th St, Tulsa, OK 74133
$-346
Cash flow
-6.4%
Cash-on-Cash Return
4.2%
Cap rate
0.6%
Rent to Value Ratio
Active
$389,000
4
bds
|
3
ba
|
3,111
sqft
|
built
1978
8221 S 74th East Ave, Tulsa, OK 74133
$-642
Cash flow
-8.6%
Cash-on-Cash Return
3.7%
Cap rate
0.5%
Rent to Value Ratio
Active
$300,000
2
bds
|
2
ba
|
1,614
sqft
|
built
2004
10115 S 94th East Pl, Tulsa, OK 74133
$-631
Cash flow
-11.0%
Cash-on-Cash Return
3.2%
Cap rate
0.6%
Rent to Value Ratio
Active
$440,000
3
bds
|
3
ba
|
2,631
sqft
|
built
2013
10235 S 96th East Pl, Tulsa, OK 74133
$-764
Cash flow
-9.1%
Cash-on-Cash Return
3.6%
Cap rate
0.6%
Rent to Value Ratio
Active
$498,900
4
bds
|
4
ba
|
3,668
sqft
|
built
2000
8703 E 101st Pl, Tulsa, OK 74133
$-927
Cash flow
-9.7%
Cash-on-Cash Return
3.4%
Cap rate
0.6%
Rent to Value Ratio
Active
$257,400
3
bds
|
2
ba
|
1,689
sqft
|
built
1991
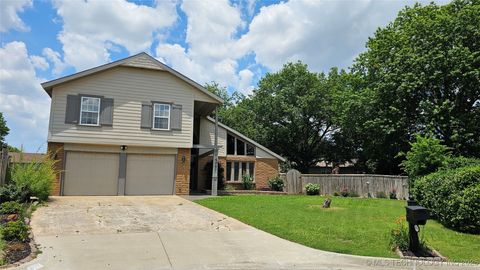
9908 S 95th East Ave, Tulsa, OK 74133
$-363
Cash flow
-7.4%
Cash-on-Cash Return
4.0%
Cap rate
0.6%
Rent to Value Ratio
Active
$394,999
3
bds
|
2
ba
|
2,360
sqft
|
built
2006
7506 E 94th St, Tulsa, OK 74133
$-814
Cash flow
-10.8%
Cash-on-Cash Return
3.2%
Cap rate
0.6%
Rent to Value Ratio
Active
$415,000
4
bds
|
3
ba
|
3,207
sqft
|
built
1986
10807 E 99th St, Tulsa, OK 74133
$-511
Cash flow
-6.4%
Cash-on-Cash Return
4.2%
Cap rate
0.7%
Rent to Value Ratio
Active
$345,000
4
bds
|
3
ba
|
2,580
sqft
|
built
1970
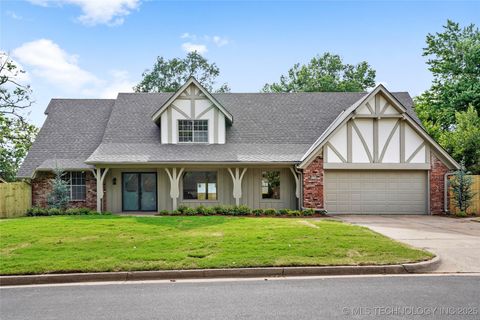
7315 S 69th East Pl, Tulsa, OK 74133
$-411
Cash flow
-6.2%
Cash-on-Cash Return
4.3%
Cap rate
0.6%
Rent to Value Ratio
Active
$509,000
4
bds
|
3
ba
|
3,257
sqft
|
built
2000
10135 S 78th East Ave, Tulsa, OK 74133
$-984
Cash flow
-10.1%
Cash-on-Cash Return
3.4%
Cap rate
0.6%
Rent to Value Ratio