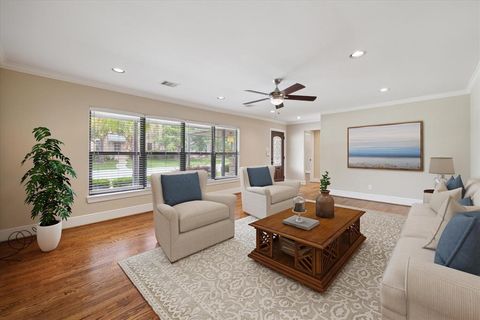
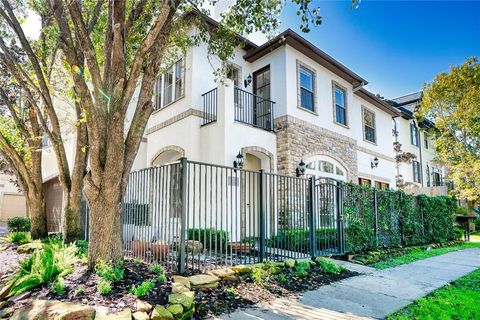
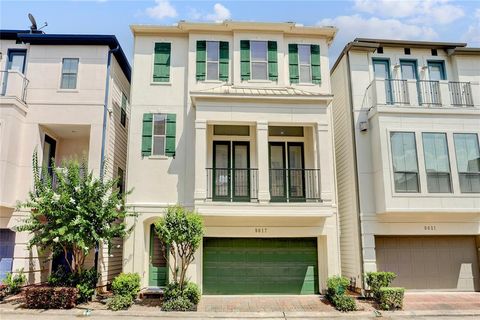
77025 Investment Properties for Sale
Browse homes for sale and investment properties in 77025. Refine your search by price, property type, or more.
Best cash flowing properties in 77025
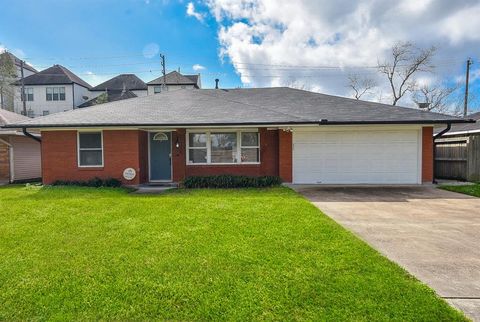
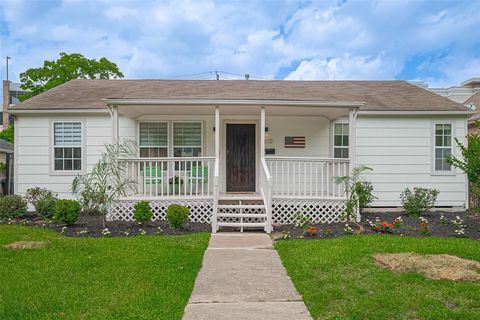
Active
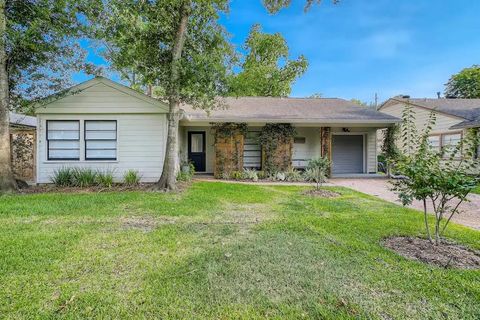
$405,000
3
bds
|
0
ba
|
1,729
sqft
|
built
1953
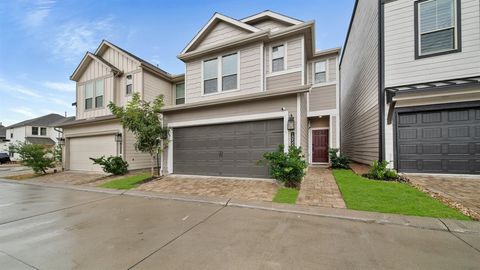
4125 Lymbar Dr, Houston, TX 77025
$-311
Cash flow
-4.0%
Cash-on-Cash Return
5.3%
Cap rate
0.9%
Rent to Value Ratio
Active
$95,000
1
bds
|
0
ba
|
744
sqft
|
built
1960
2601 Bellefontaine St, Houston, TX 77025
$-328
Cash flow
-18.0%
Cash-on-Cash Return
2.1%
Cap rate
1.4%
Rent to Value Ratio
118 out of 126 properties for sale in 77025
Limited Results Shown
Create a free account, or log in to reveal all property listings and enjoy the complete experience.
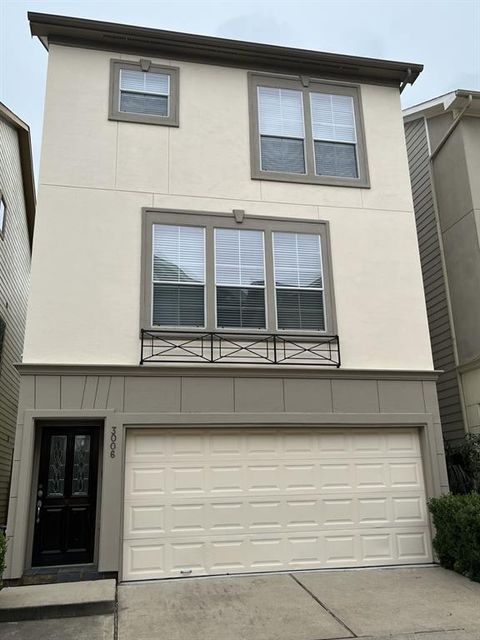
Active
$398,000
3
bds
|
0
ba
|
1,936
sqft
|
built
2008
3006 Clearview Cir, Houston, TX 77025
$-766
Cash flow
-10.0%
Cash-on-Cash Return
4.0%
Cap rate
0.7%
Rent to Value Ratio
Active
$435,000
4
bds
|
0
ba
|
2,634
sqft
|
built
1957
9219 Timberside Dr, Houston, TX 77025
$-1,262
Cash flow
-15.1%
Cash-on-Cash Return
2.8%
Cap rate
0.6%
Rent to Value Ratio

Active
$775,000
4
bds
|
0
ba
|
2,708
sqft
|
built
1952
8707 Linkmeadow Ln, Houston, TX 77025
$-2,255
Cash flow
-15.2%
Cash-on-Cash Return
2.8%
Cap rate
0.5%
Rent to Value Ratio
Active
$725,000
3
bds
|
0
ba
|
1,368
sqft
|
built
1947
4110 Gramercy St, Houston, TX 77025
$-2,894
Cash flow
-20.8%
Cash-on-Cash Return
1.5%
Cap rate
0.4%
Rent to Value Ratio
Active
$495,000
3
bds
|
0
ba
|
2,284
sqft
|
built
1967
4053 Breakwood Dr, Houston, TX 77025
$-900
Cash flow
-9.5%
Cash-on-Cash Return
4.1%
Cap rate
0.7%
Rent to Value Ratio
Active
$599,000
3
bds
|
0
ba
|
1,700
sqft
|
built
1950
3831 Linklea Dr, Houston, TX 77025
$-2,056
Cash flow
-17.9%
Cash-on-Cash Return
2.1%
Cap rate
0.5%
Rent to Value Ratio
Active
$1,878,000
4
bds
|
0
ba
|
4,788
sqft
|
built
2020
4019 Drummond St, Houston, TX 77025
$-7,198
Cash flow
-20.0%
Cash-on-Cash Return
1.7%
Cap rate
0.4%
Rent to Value Ratio
Active
$849,500
3
bds
|
0
ba
|
2,328
sqft
|
built
1950
3207 Aberdeen Way, Houston, TX 77025
$-2,594
Cash flow
-15.9%
Cash-on-Cash Return
2.6%
Cap rate
0.5%
Rent to Value Ratio
Active
$347,900
3
bds
|
0
ba
|
2,194
sqft
|
built
2001
9716 Riddlewood Ln, Houston, TX 77025
$-861
Cash flow
-12.9%
Cash-on-Cash Return
3.3%
Cap rate
0.6%
Rent to Value Ratio
Active
$226,000
2
bds
|
0
ba
|
1,452
sqft
|
built
1980
2601 S Braeswood Blvd, Houston, TX 77025
$-653
Cash flow
-15.1%
Cash-on-Cash Return
2.8%
Cap rate
0.9%
Rent to Value Ratio

Active
$569,900
3
bds
|
0
ba
|
2,128
sqft
|
built
1952
3515 Norris Dr, Houston, TX 77025
$-1,425
Cash flow
-13.0%
Cash-on-Cash Return
3.3%
Cap rate
0.5%
Rent to Value Ratio

Active
$425,000
4
bds
|
0
ba
|
1,888
sqft
|
built
1952
4009 Woodshire St, Houston, TX 77025
$-817
Cash flow
-10.0%
Cash-on-Cash Return
4.0%
Cap rate
0.7%
Rent to Value Ratio
Active
$450,000
4
bds
|
0
ba
|
2,683
sqft
|
built
2011
9948 Woodwind Ln N, Houston, TX 77025
$-576
Cash flow
-6.7%
Cash-on-Cash Return
4.7%
Cap rate
0.9%
Rent to Value Ratio
Active
$975,000
4
bds
|
0
ba
|
4,152
sqft
|
built
1979
2628 Glen Haven Blvd, Houston, TX 77025
$-3,453
Cash flow
-18.5%
Cash-on-Cash Return
2.0%
Cap rate
0.5%
Rent to Value Ratio
Active
$93,999
1
bds
|
0
ba
|
744
sqft
|
built
1960
2601 Bellefontaine St, Houston, TX 77025
$-351
Cash flow
-19.5%
Cash-on-Cash Return
1.8%
Cap rate
1.4%
Rent to Value Ratio

Active
$999,000
5
bds
|
0
ba
|
3,924
sqft
|
built
2013
3302 Rochdale St, Houston, TX 77025
$-4,176
Cash flow
-21.8%
Cash-on-Cash Return
1.2%
Cap rate
0.4%
Rent to Value Ratio
Active
$450,000
3
bds
|
0
ba
|
2,002
sqft
|
built
1960
3727 Woodvalley Dr, Houston, TX 77025
$-417
Cash flow
-4.8%
Cash-on-Cash Return
5.2%
Cap rate
0.6%
Rent to Value Ratio
Active
$370,000
3
bds
|
0
ba
|
1,501
sqft
|
built
2020
10307 Harmon Smith Dr, Houston, TX 77025
$-1,016
Cash flow
-14.3%
Cash-on-Cash Return
3.0%
Cap rate
0.7%
Rent to Value Ratio
Active
$329,900
2
bds
|
0
ba
|
2,126
sqft
|
built
2011
10722 Clearview Villa Pl, Houston, TX 77025
$-707
Cash flow
-11.2%
Cash-on-Cash Return
3.7%
Cap rate
0.8%
Rent to Value Ratio
Active
$299,000
2
bds
|
0
ba
|
1,234
sqft
|
built
1952
4046 Woodfin St, Houston, TX 77025
$-852
Cash flow
-14.9%
Cash-on-Cash Return
2.8%
Cap rate
0.6%
Rent to Value Ratio
Active
$277,000
3
bds
|
0
ba
|
1,695
sqft
|
built
2016
3718 Main Poplar Dr, Houston, TX 77025
$-522
Cash flow
-9.8%
Cash-on-Cash Return
3.4%
Cap rate
0.8%
Rent to Value Ratio

Active
$284,000
3
bds
|
0
ba
|
1,314
sqft
|
built
1952
4018 Woodshire St, Houston, TX 77025
$-549
Cash flow
-10.1%
Cash-on-Cash Return
3.9%
Cap rate
0.7%
Rent to Value Ratio
Active
$400,000
3
bds
|
0
ba
|
2,017
sqft
|
built
2022
10756 Craighead Dr, Houston, TX 77025
$-584
Cash flow
-7.6%
Cash-on-Cash Return
4.5%
Cap rate
0.9%
Rent to Value Ratio
Active
$924,990
3
bds
|
0
ba
|
3,658
sqft
|
built
2001
4035 Gramercy St, Houston, TX 77025
$-2,120
Cash flow
-12.0%
Cash-on-Cash Return
3.5%
Cap rate
0.6%
Rent to Value Ratio

Active
$285,000
3
bds
|
0
ba
|
1,695
sqft
|
built
2016
3726 Main Poplar Dr, Houston, TX 77025
$-680
Cash flow
-12.4%
Cash-on-Cash Return
3.4%
Cap rate
0.8%
Rent to Value Ratio

Active
$102,900
1
bds
|
0
ba
|
842
sqft
|
built
1960
2601 Bellefontaine St, Houston, TX 77025
$-459
Cash flow
-23.3%
Cash-on-Cash Return
0.9%
Cap rate
1.3%
Rent to Value Ratio

Active
$679,000
3
bds
|
0
ba
|
3,360
sqft
|
built
2005
9129 Buffalo Speedway, Houston, TX 77025
$-1,964
Cash flow
-15.1%
Cash-on-Cash Return
2.8%
Cap rate
0.6%
Rent to Value Ratio
Active
$450,000
3
bds
|
0
ba
|
2,426
sqft
|
built
2008
9617 Pemberton Crescent Dr, Houston, TX 77025
$-1,230
Cash flow
-14.3%
Cash-on-Cash Return
3.0%
Cap rate
0.6%
Rent to Value Ratio
Active
$370,000
3
bds
|
0
ba
|
2,016
sqft
|
built
2018
9618 Riddlewood Ln, Houston, TX 77025
$-741
Cash flow
-10.4%
Cash-on-Cash Return
3.9%
Cap rate
0.8%
Rent to Value Ratio
Active
$625,000
4
bds
|
0
ba
|
2,933
sqft
|
built
1960
4102 Levonshire Dr, Houston, TX 77025
$-1,120
Cash flow
-9.3%
Cash-on-Cash Return
4.1%
Cap rate
0.7%
Rent to Value Ratio

Active
$434,900
3
bds
|
0
ba
|
2,391
sqft
|
built
2018
4124 Willowbend Blvd, Houston, TX 77025
$-1,036
Cash flow
-12.4%
Cash-on-Cash Return
3.4%
Cap rate
0.7%
Rent to Value Ratio
Active
$415,000
3
bds
|
0
ba
|
1,779
sqft
|
built
2022
10507 Marston Vineyard Dr, Houston, TX 77025
$-1,282
Cash flow
-16.1%
Cash-on-Cash Return
2.6%
Cap rate
0.6%
Rent to Value Ratio
Active
$574,000
3
bds
|
0
ba
|
2,569
sqft
|
built
1958
4023 Mischire Dr, Houston, TX 77025
$-1,307
Cash flow
-11.9%
Cash-on-Cash Return
3.5%
Cap rate
0.6%
Rent to Value Ratio
Active
$95,000
1
bds
|
0
ba
|
744
sqft
|
built
1960
2601 Bellefontaine St, Houston, TX 77025
$-328
Cash flow
-18.0%
Cash-on-Cash Return
2.1%
Cap rate
1.4%
Rent to Value Ratio
Active
$405,000
3
bds
|
0
ba
|
1,729
sqft
|
built
1953
4125 Lymbar Dr, Houston, TX 77025
$-311
Cash flow
-4.0%
Cash-on-Cash Return
5.3%
Cap rate
0.9%
Rent to Value Ratio

Active
$338,000
3
bds
|
0
ba
|
2,180
sqft
|
built
2005
3731 Tiffany Pl, Houston, TX 77025
$-595
Cash flow
-9.2%
Cash-on-Cash Return
4.2%
Cap rate
0.7%
Rent to Value Ratio
Active
$449,900
3
bds
|
0
ba
|
2,343
sqft
|
built
2016
3102 Mitchell Landing Ct, Houston, TX 77025
$-1,143
Cash flow
-13.3%
Cash-on-Cash Return
3.2%
Cap rate
0.7%
Rent to Value Ratio
Active
$190,000
2
bds
|
0
ba
|
1,336
sqft
|
built
1980
2601 S Braeswood Blvd, Houston, TX 77025
$-700
Cash flow
-19.2%
Cash-on-Cash Return
1.8%
Cap rate
0.9%
Rent to Value Ratio
Active
$410,000
3
bds
|
0
ba
|
1,314
sqft
|
built
1952
4021 Woodshire St, Houston, TX 77025
$-1,043
Cash flow
-13.3%
Cash-on-Cash Return
3.2%
Cap rate
0.5%
Rent to Value Ratio
Active
$297,500
3
bds
|
0
ba
|
1,695
sqft
|
built
2016
3736 Main Poplar Dr, Houston, TX 77025
$-335
Cash flow
-5.9%
Cash-on-Cash Return
4.9%
Cap rate
0.7%
Rent to Value Ratio