77099 Investment Properties for Sale
Browse homes for sale and investment properties in 77099. Refine your search by price, property type, or more.
Best cash flowing properties in 77099
Active
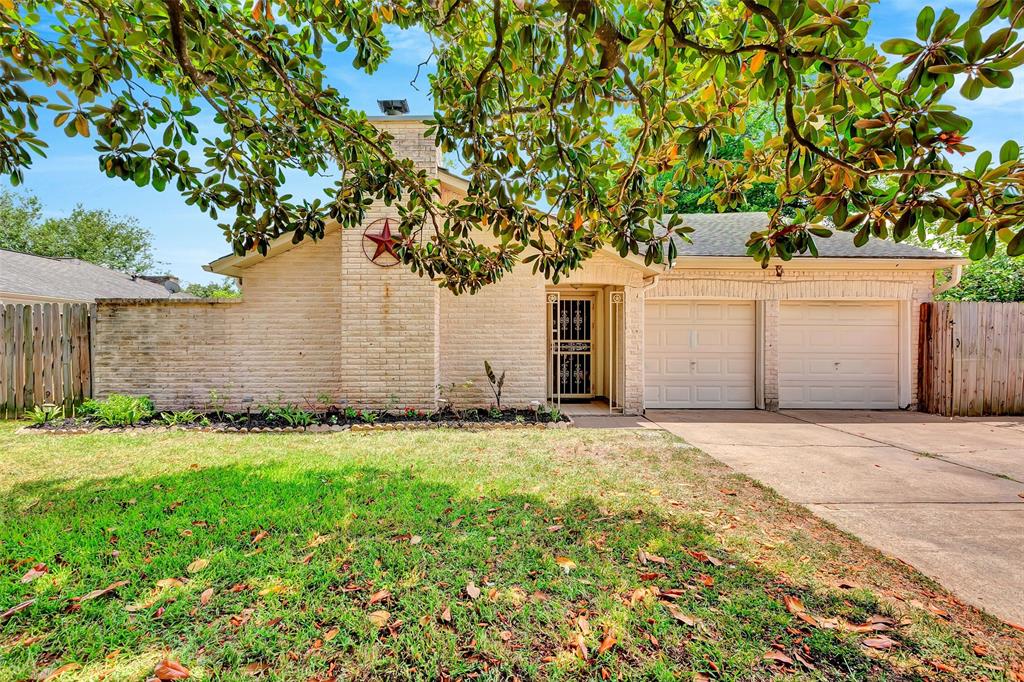
$199,900
3
bds
|
0
ba
|
1,149
sqft
|
built
1969
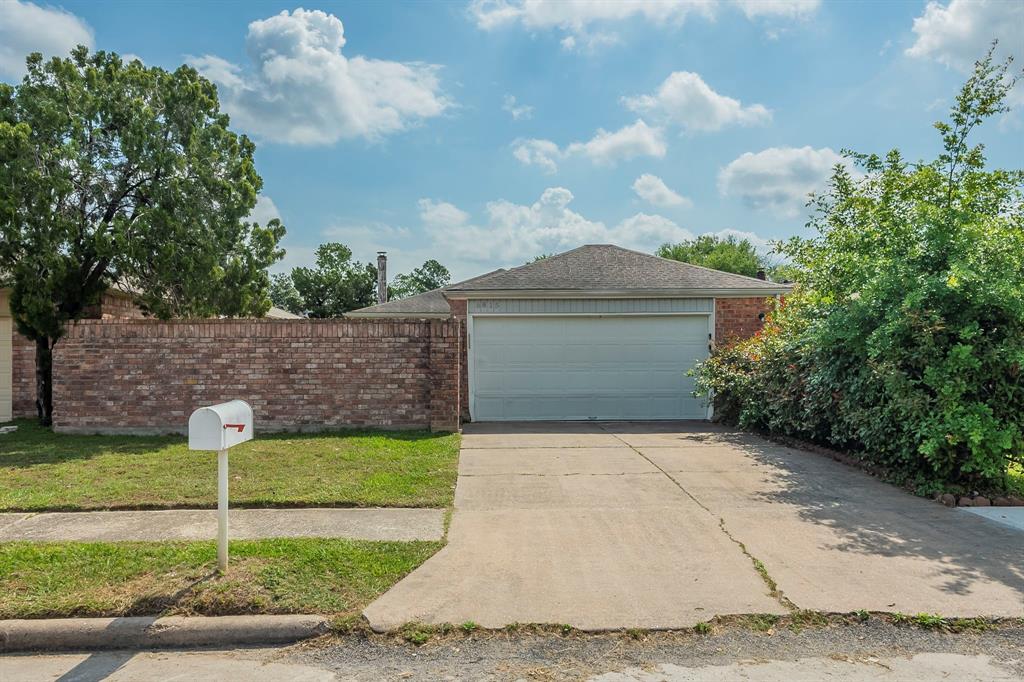
8914 Amblewood Dr, Houston, TX 77099
$374
Cash flow
9.8%
Cash-on-Cash Return
8.5%
Cap rate
1.3%
Rent to Value Ratio
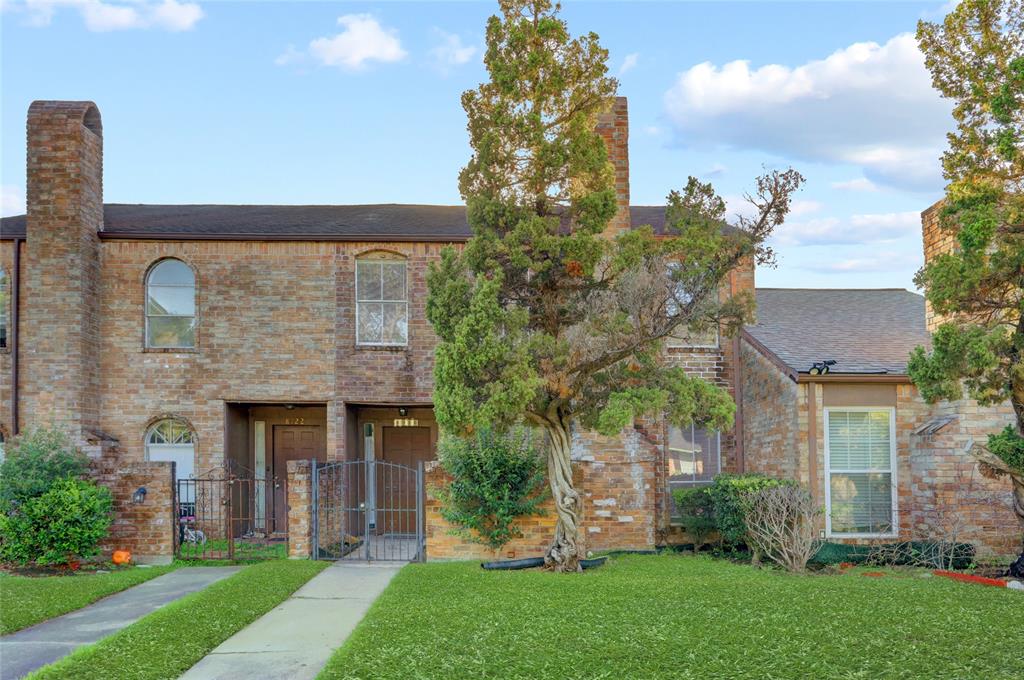
Active under contract
$94,970
2
bds
|
0
ba
|
1,068
sqft
|
built
1982
9700 Leawood Blvd, Houston, TX 77099
$-57
Cash flow
-3.1%
Cash-on-Cash Return
5.6%
Cap rate
1.5%
Rent to Value Ratio
92 out of 101 properties for sale in 77099
Limited Results Shown
Create a free account, or log in to reveal all property listings and enjoy the complete experience.
Active
$87,800
2
bds
|
0
ba
|
1,068
sqft
|
built
1983
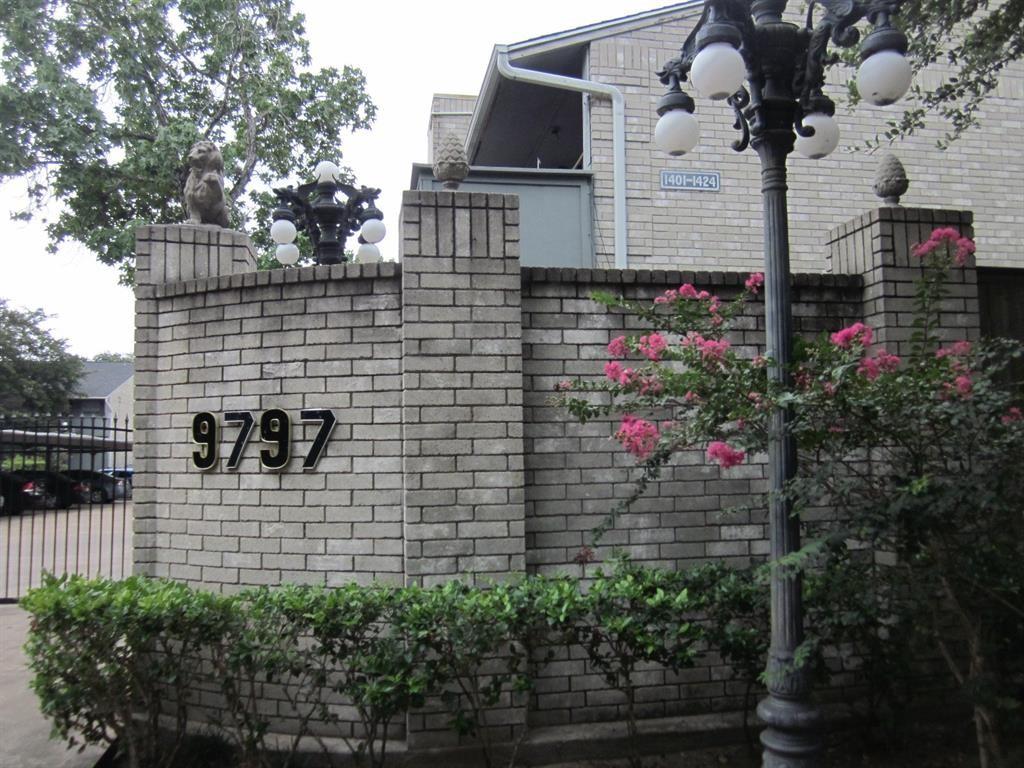
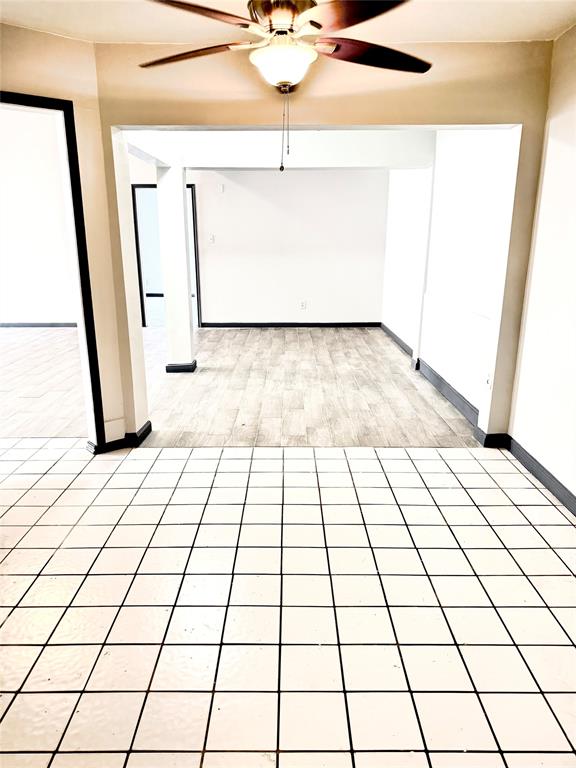
9797 Leawood Blvd, Houston, TX 77099
$-205
Cash flow
-12.2%
Cash-on-Cash Return
3.5%
Cap rate
1.3%
Rent to Value Ratio
Active
$88,888
1
bds
|
0
ba
|
768
sqft
|
built
1980
10501 South Dr, Houston, TX 77099
$-193
Cash flow
-11.3%
Cash-on-Cash Return
3.7%
Cap rate
1.1%
Rent to Value Ratio
Active
$88,000
2
bds
|
0
ba
|
1,068
sqft
|
built
1983
9797 Leawood Blvd, Houston, TX 77099
$-93
Cash flow
-5.5%
Cash-on-Cash Return
5.0%
Cap rate
1.5%
Rent to Value Ratio
Active
$88,888
1
bds
|
0
ba
|
768
sqft
|
built
1980
10501 South Dr, Houston, TX 77099
$-187
Cash flow
-11.0%
Cash-on-Cash Return
3.8%
Cap rate
1.1%
Rent to Value Ratio
Active
$123,000
2
bds
|
0
ba
|
1,068
sqft
|
built
1983
9797 Leawood Blvd, Houston, TX 77099
$-498
Cash flow
-21.1%
Cash-on-Cash Return
1.4%
Cap rate
0.8%
Rent to Value Ratio
Active
$110,000
2
bds
|
0
ba
|
1,068
sqft
|
built
1983
9797 Leawood Blvd, Houston, TX 77099
$-240
Cash flow
-11.4%
Cash-on-Cash Return
3.7%
Cap rate
1.2%
Rent to Value Ratio
Active
$235,000
3
bds
|
0
ba
|
1,312
sqft
|
built
1981
8715 Belle Glen Dr, Houston, TX 77099
$-440
Cash flow
-9.8%
Cash-on-Cash Return
4.0%
Cap rate
0.8%
Rent to Value Ratio
Active
$249,900
3
bds
|
0
ba
|
1,652
sqft
|
built
1982
9319 Belle Park Dr, Houston, TX 77099
$-664
Cash flow
-13.9%
Cash-on-Cash Return
3.1%
Cap rate
0.6%
Rent to Value Ratio
Active
$320,000
3
bds
|
0
ba
|
1,868
sqft
|
built
1982
11738 Fairpoint Dr, Houston, TX 77099
$-682
Cash flow
-11.1%
Cash-on-Cash Return
3.7%
Cap rate
0.6%
Rent to Value Ratio

Active
$290,000
3
bds
|
0
ba
|
1,560
sqft
|
built
1970
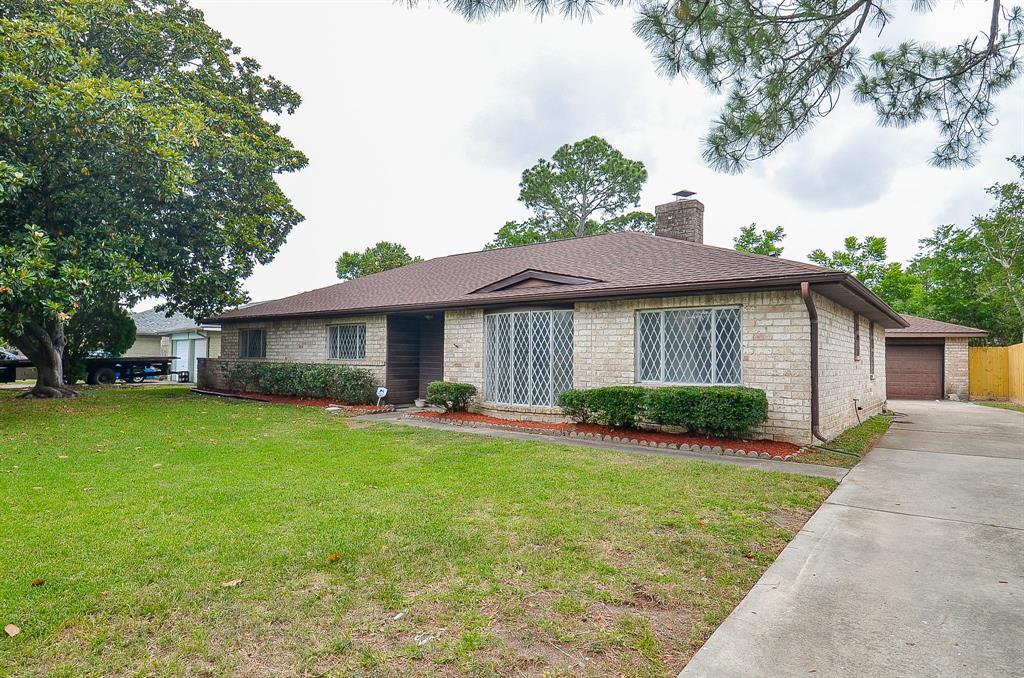
10203 Huntington Dale Dr, Houston, TX 77099
$-674
Cash flow
-12.1%
Cash-on-Cash Return
3.5%
Cap rate
0.6%
Rent to Value Ratio
Active
$330,000
3
bds
|
0
ba
|
1,642
sqft
|
built
1974
12314 Bexley Dr, Houston, TX 77099
$-675
Cash flow
-10.7%
Cash-on-Cash Return
3.8%
Cap rate
0.6%
Rent to Value Ratio
Active
$79,000
1
bds
|
0
ba
|
768
sqft
|
built
1980
10501 South Dr, Houston, TX 77099
$-143
Cash flow
-9.4%
Cash-on-Cash Return
4.1%
Cap rate
1.3%
Rent to Value Ratio
Active
$85,000
2
bds
|
0
ba
|
1,068
sqft
|
built
1983
9797 Leawood Blvd, Houston, TX 77099
$-284
Cash flow
-17.4%
Cash-on-Cash Return
2.3%
Cap rate
1.2%
Rent to Value Ratio
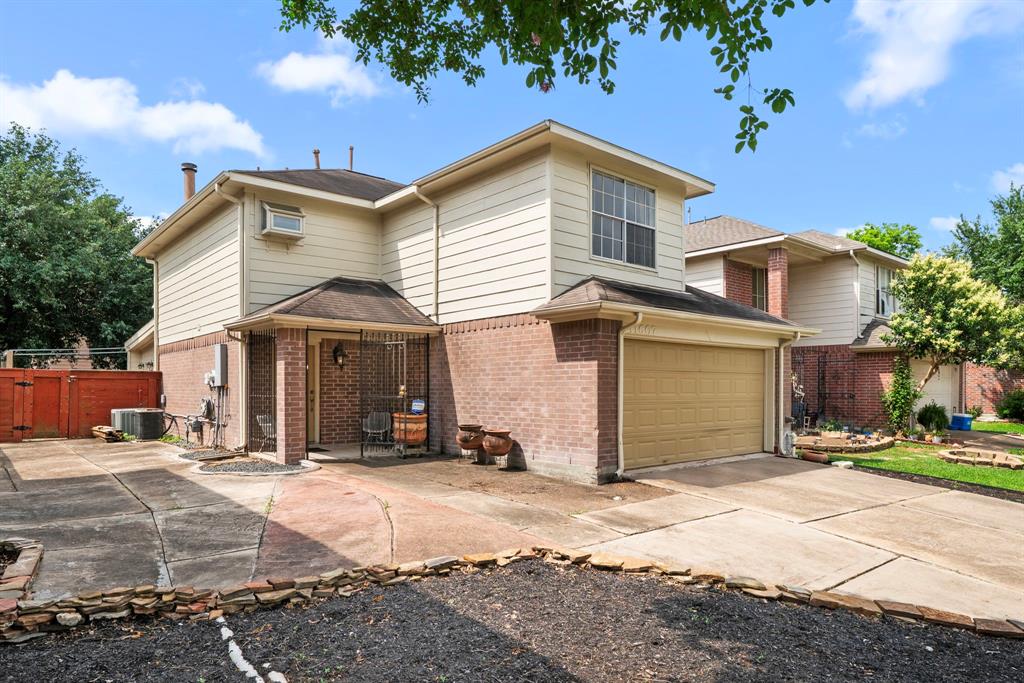
Active
$300,000
3
bds
|
0
ba
|
1,812
sqft
|
built
2006
9207 Dairy View Ln, Houston, TX 77099
$-771
Cash flow
-13.4%
Cash-on-Cash Return
3.2%
Cap rate
0.6%
Rent to Value Ratio
Active
$199,900
3
bds
|
0
ba
|
1,149
sqft
|
built
1969
8914 Amblewood Dr, Houston, TX 77099
$374
Cash flow
9.8%
Cash-on-Cash Return
8.5%
Cap rate
1.3%
Rent to Value Ratio
Active
$799,000
7
bds
|
0
ba
|
5,108
sqft
|
built
2010
11106 Lewis Dr, Houston, TX 77099
$-1,886
Cash flow
-12.3%
Cash-on-Cash Return
3.5%
Cap rate
0.6%
Rent to Value Ratio
Active
$155,000
2
bds
|
0
ba
|
1,168
sqft
|
built
1982
12300 Brookglade Cir, Houston, TX 77099
$-339
Cash flow
-11.4%
Cash-on-Cash Return
3.7%
Cap rate
0.9%
Rent to Value Ratio

Active
$264,999
3
bds
|
0
ba
|
1,607
sqft
|
built
1973
10527 Newborough Dr, Houston, TX 77099
$-530
Cash flow
-10.4%
Cash-on-Cash Return
3.9%
Cap rate
0.7%
Rent to Value Ratio
Active
$275,000
3
bds
|
0
ba
|
1,654
sqft
|
built
1972
12219 South Dr, Houston, TX 77099
$-485
Cash flow
-9.2%
Cash-on-Cash Return
4.2%
Cap rate
0.7%
Rent to Value Ratio
Active
$256,990
3
bds
|
0
ba
|
1,668
sqft
|
built
1974
12307 Shannon Hills Dr, Houston, TX 77099
$-532
Cash flow
-10.8%
Cash-on-Cash Return
3.8%
Cap rate
0.7%
Rent to Value Ratio
Active
$265,000
3
bds
|
0
ba
|
1,748
sqft
|
built
1979
13102 Lima Dr, Houston, TX 77099
$-161
Cash flow
-3.2%
Cash-on-Cash Return
5.6%
Cap rate
0.7%
Rent to Value Ratio
Active
$275,000
5
bds
|
0
ba
|
2,470
sqft
|
built
1977
13126 Birch Grove Dr, Houston, TX 77099
$-455
Cash flow
-8.6%
Cash-on-Cash Return
4.3%
Cap rate
0.7%
Rent to Value Ratio
Active under contract
$94,970
2
bds
|
0
ba
|
1,068
sqft
|
built
1982
9700 Leawood Blvd, Houston, TX 77099
$-57
Cash flow
-3.1%
Cash-on-Cash Return
5.6%
Cap rate
1.5%
Rent to Value Ratio
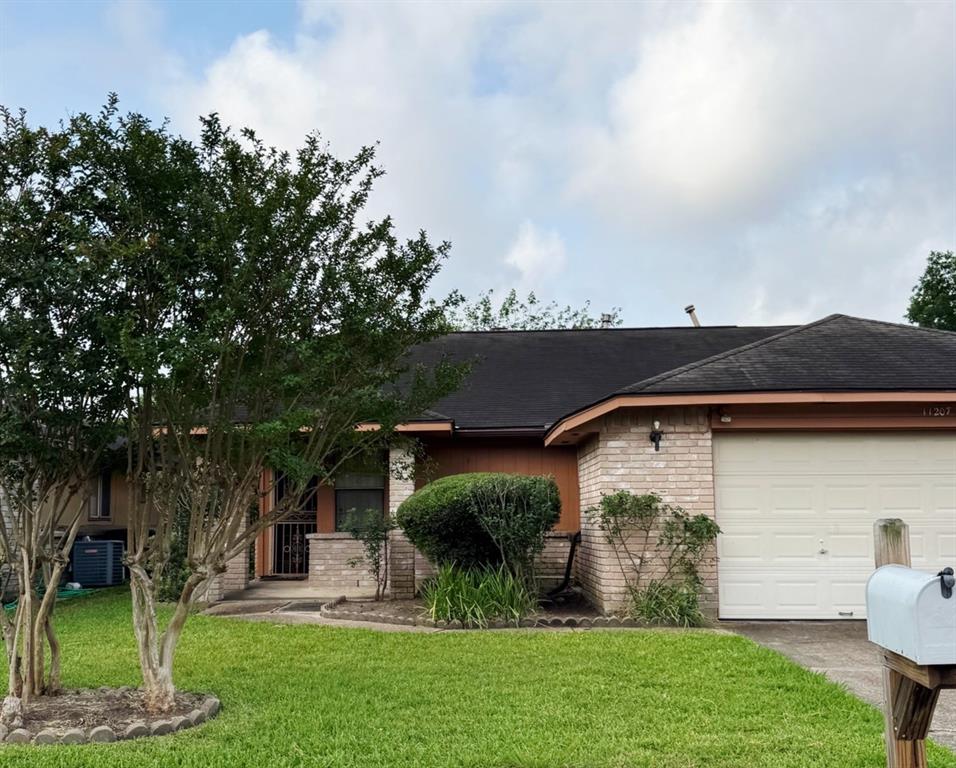
Active
$219,000
3
bds
|
0
ba
|
1,449
sqft
|
built
1981
11207 Windmark Pl, Houston, TX 77099
$-287
Cash flow
-6.8%
Cash-on-Cash Return
4.7%
Cap rate
0.8%
Rent to Value Ratio
Active
$245,000
3
bds
|
0
ba
|
1,548
sqft
|
built
1974
12119 Green Glade Dr, Houston, TX 77099
$-427
Cash flow
-9.1%
Cash-on-Cash Return
4.2%
Cap rate
0.7%
Rent to Value Ratio
Active
$350,000
4
bds
|
0
ba
|
1,864
sqft
|
built
1974
12323 Bexley Dr, Houston, TX 77099
$-916
Cash flow
-13.7%
Cash-on-Cash Return
3.1%
Cap rate
0.6%
Rent to Value Ratio
Active
$268,000
3
bds
|
0
ba
|
1,731
sqft
|
built
1980
12007 Fairpoint Dr, Houston, TX 77099
$-467
Cash flow
-9.1%
Cash-on-Cash Return
4.2%
Cap rate
0.7%
Rent to Value Ratio
Active
$285,000
3
bds
|
0
ba
|
1,630
sqft
|
built
1971
10815 Montverde Ln, Houston, TX 77099
$-260
Cash flow
-4.8%
Cash-on-Cash Return
5.2%
Cap rate
0.6%
Rent to Value Ratio
Active
$269,900
3
bds
|
0
ba
|
1,738
sqft
|
built
1975
12707 W Club Ln, Houston, TX 77099
$-275
Cash flow
-5.3%
Cash-on-Cash Return
5.1%
Cap rate
0.8%
Rent to Value Ratio
Active
$320,000
3
bds
|
0
ba
|
1,642
sqft
|
built
1974
12510 Shannon Hills Dr, Houston, TX 77099
$-624
Cash flow
-10.2%
Cash-on-Cash Return
3.9%
Cap rate
0.6%
Rent to Value Ratio
Active
$108,000
2
bds
|
0
ba
|
1,068
sqft
|
built
1983
9797 Leawood Blvd, Houston, TX 77099
$-127
Cash flow
-6.1%
Cash-on-Cash Return
4.9%
Cap rate
1.3%
Rent to Value Ratio
Active
$249,900
3
bds
|
0
ba
|
2,056
sqft
|
built
1983
11643 Herald Square Dr, Houston, TX 77099
$-390
Cash flow
-8.1%
Cash-on-Cash Return
4.4%
Cap rate
0.8%
Rent to Value Ratio
Active
$238,000
3
bds
|
0
ba
|
1,669
sqft
|
built
1977
8815 Brummel Dr, Houston, TX 77099
$-478
Cash flow
-10.5%
Cash-on-Cash Return
3.9%
Cap rate
0.7%
Rent to Value Ratio

Active
$279,000
3
bds
|
0
ba
|
1,833
sqft
|
built
1982
11846 Plumbrook Dr, Houston, TX 77099
$-697
Cash flow
-13.0%
Cash-on-Cash Return
3.3%
Cap rate
0.7%
Rent to Value Ratio
Active
$290,000
4
bds
|
0
ba
|
2,037
sqft
|
built
1971
10947 Vanderford Dr, Houston, TX 77099
$-630
Cash flow
-11.3%
Cash-on-Cash Return
3.7%
Cap rate
0.7%
Rent to Value Ratio
Pending
$245,000
4
bds
|
0
ba
|
1,861
sqft
|
built
1973
12215 Creekhurst Dr, Houston, TX 77099
$-402
Cash flow
-8.6%
Cash-on-Cash Return
4.3%
Cap rate
0.8%
Rent to Value Ratio
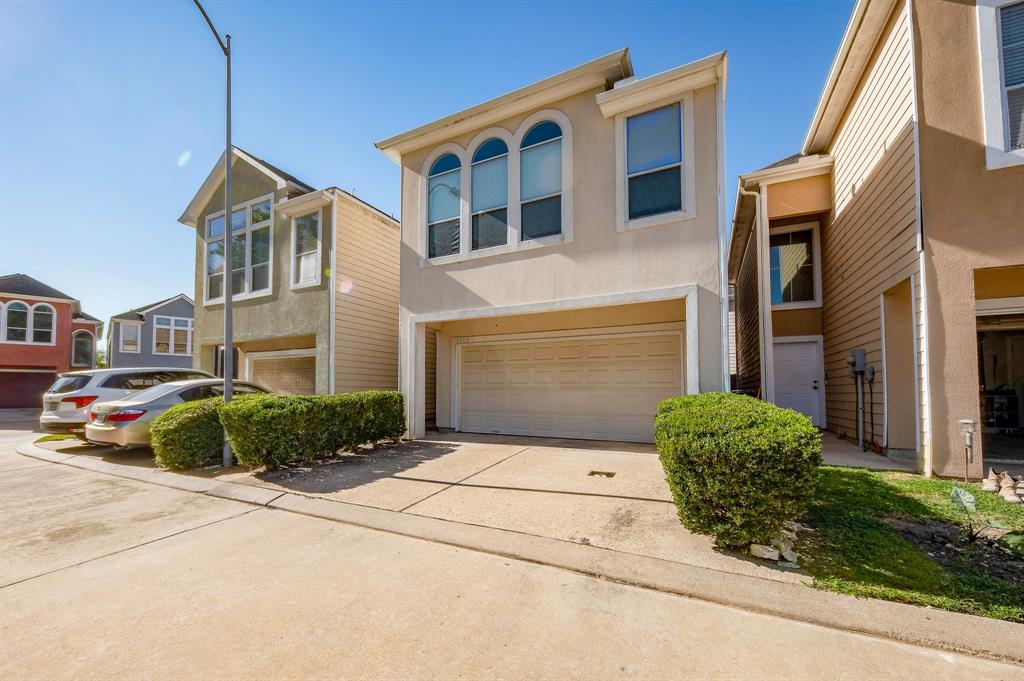
Active
$285,000
3
bds
|
0
ba
|
2,207
sqft
|
built
1997
11607 Zarroll Dr, Houston, TX 77099
$-638
Cash flow
-11.7%
Cash-on-Cash Return
3.6%
Cap rate
0.7%
Rent to Value Ratio
Active
$199,800
3
bds
|
0
ba
|
1,736
sqft
|
built
1977
8718 Maplecrest Dr, Houston, TX 77099
$-336
Cash flow
-8.8%
Cash-on-Cash Return
4.3%
Cap rate
0.9%
Rent to Value Ratio
Active
$240,000
3
bds
|
0
ba
|
1,730
sqft
|
built
2004
12510 Panther Place Dr, Houston, TX 77099
$-112
Cash flow
-2.4%
Cash-on-Cash Return
5.7%
Cap rate
0.8%
Rent to Value Ratio
Active
$267,900
3
bds
|
0
ba
|
1,422
sqft
|
built
1978
8814 Beau Monde Dr, Houston, TX 77099
$-728
Cash flow
-14.2%
Cash-on-Cash Return
3.0%
Cap rate
0.6%
Rent to Value Ratio