77539 Investment Properties for Sale
Browse homes for sale and investment properties in 77539. Refine your search by price, property type, or more.
Best cash flowing properties in 77539

Active
$95,000
1
bds
|
1
ba
|
762
sqft
|
built
1979
232 3rd St, San Leon, TX 77539
$332
Cash flow
18.2%
Cash-on-Cash Return
9.9%
Cap rate
1.7%
Rent to Value Ratio
Active
$60,000
1
bds
|
1
ba
|
639
sqft
|
built
1980
2501 Gulf Fwy, Dickinson, TX 77539
$263
Cash flow
5.1%
Cash-on-Cash Return
5.3%
Cap rate
1.7%
Rent to Value Ratio
127 out of 157 properties for sale in 77539
Limited Results Shown
Create a free account, or log in to reveal all property listings and enjoy the complete experience.

Active
$439,000
5
bds
|
4
ba
|
3,894
sqft
|
built
2006
4204 S Meridian Greens Dr, Dickinson, TX 77539
$-1,102
Cash flow
-13.1%
Cash-on-Cash Return
2.7%
Cap rate
0.6%
Rent to Value Ratio

Active
$275,000
3
bds
|
2
ba
|
1,377
sqft
|
built
1976
4801 36th St, Dickinson, TX 77539
$-400
Cash flow
-7.6%
Cash-on-Cash Return
3.9%
Cap rate
0.7%
Rent to Value Ratio

Active
$269,000
1
bds
|
1
ba
|
880
sqft
|
built
1968
1115 Magnolia Terrace Cir, Dickinson, TX 77539
$-222
Cash flow
-4.3%
Cash-on-Cash Return
4.7%
Cap rate
0.7%
Rent to Value Ratio

Active
$229,000
3
bds
|
2
ba
|
1,470
sqft
|
built
1996
5516 Thistle Dr, Dickinson, TX 77539
$-119
Cash flow
-2.7%
Cash-on-Cash Return
5.1%
Cap rate
0.9%
Rent to Value Ratio

Active
$795,000
2
bds
|
1
ba
|
1,300
sqft
|
built
2021
215 22nd St, Dickinson, TX 77539
$-3,627
Cash flow
-23.8%
Cash-on-Cash Return
0.2%
Cap rate
0.1%
Rent to Value Ratio

Active
$225,000
bds
|
1
ba
|
1,236
sqft
|
built
1962
114 2nd St, San Leon, TX 77539
$-492
Cash flow
-11.4%
Cash-on-Cash Return
3.1%
Cap rate
0.5%
Rent to Value Ratio
Active
$333,000
3
bds
|
2
ba
|
2,048
sqft
|
built
1999
412 Pecan Grv, Dickinson, TX 77539
$-327
Cash flow
-5.1%
Cash-on-Cash Return
4.5%
Cap rate
0.8%
Rent to Value Ratio
Active
$247,000
3
bds
|
3
ba
|
1,702
sqft
|
built
2005
242 Drake Run Ln, Dickinson, TX 77539
$-213
Cash flow
-4.5%
Cash-on-Cash Return
4.6%
Cap rate
0.9%
Rent to Value Ratio

Active
$289,000
4
bds
|
2
ba
|
2,017
sqft
|
built
2000
2884 Shallow Brook Ln, Dickinson, TX 77539
$-218
Cash flow
-3.9%
Cash-on-Cash Return
4.8%
Cap rate
0.9%
Rent to Value Ratio
Active
$385,000
4
bds
|
2
ba
|
2,238
sqft
|
built
1968
12226 Oak Ln, Dickinson, TX 77539
$-559
Cash flow
-7.6%
Cash-on-Cash Return
3.9%
Cap rate
0.7%
Rent to Value Ratio

Active
$139,000
3
bds
|
1
ba
|
1,243
sqft
|
built
1977
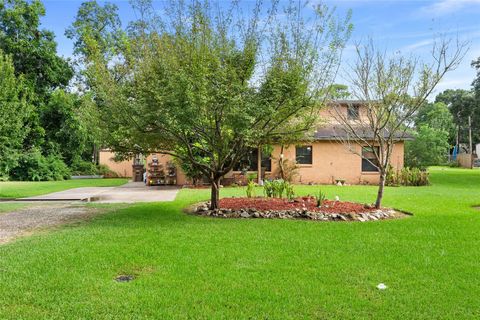
3103 Avenue H, Dickinson, TX 77539
$154
Cash flow
5.8%
Cash-on-Cash Return
7.0%
Cap rate
1.0%
Rent to Value Ratio

Active
$225,000
3
bds
|
3
ba
|
1,702
sqft
|
built
2007
213 Drake Run Ln, Dickinson, TX 77539
$-185
Cash flow
-4.3%
Cash-on-Cash Return
4.7%
Cap rate
0.9%
Rent to Value Ratio

Active
$319,000
2
bds
|
2
ba
|
1,376
sqft
|
built
2005
615 28th St, Dickinson, TX 77539
$-480
Cash flow
-7.9%
Cash-on-Cash Return
3.9%
Cap rate
0.7%
Rent to Value Ratio

Active
$225,000
4
bds
|
2
ba
|
1,740
sqft
|
built
2019
335 4th St, San Leon, TX 77539
$0
Cash flow
n/a
Cash-on-Cash Return
n/a
Cap rate
n/a
Rent to Value Ratio

Active
$260,000
3
bds
|
2
ba
|
1,946
sqft
|
built
1972
4911 Old Castle Ln, Dickinson, TX 77539
$-367
Cash flow
-7.4%
Cash-on-Cash Return
4.0%
Cap rate
0.8%
Rent to Value Ratio

Active
$322,000
4
bds
|
3
ba
|
2,235
sqft
|
built
2018
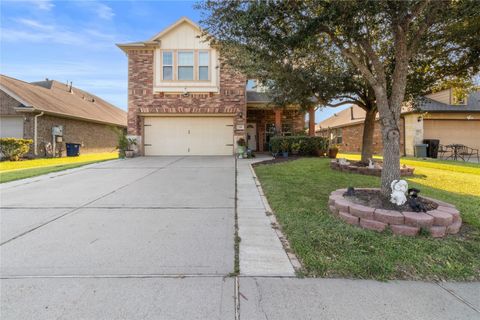
3057 Camelia View Ln, Dickinson, TX 77539
$-579
Cash flow
-9.4%
Cash-on-Cash Return
3.5%
Cap rate
0.8%
Rent to Value Ratio

Active
$246,500
3
bds
|
2
ba
|
1,443
sqft
|
built
1988
3122 Edgewood Dr, Dickinson, TX 77539
$-243
Cash flow
-5.1%
Cash-on-Cash Return
4.5%
Cap rate
0.8%
Rent to Value Ratio
Active
$225,000
4
bds
|
2
ba
|
1,845
sqft
|
built
1964
5047 Winding Way, Dickinson, TX 77539
$-141
Cash flow
-3.3%
Cash-on-Cash Return
4.9%
Cap rate
0.8%
Rent to Value Ratio
Active
$365,000
4
bds
|
3
ba
|
2,390
sqft
|
built
2014
216 Morgan Isle Ln, Dickinson, TX 77539
$-661
Cash flow
-9.4%
Cash-on-Cash Return
3.5%
Cap rate
0.7%
Rent to Value Ratio

Active
$699,900
6
bds
|
8
ba
|
3,189
sqft
|
built
2013
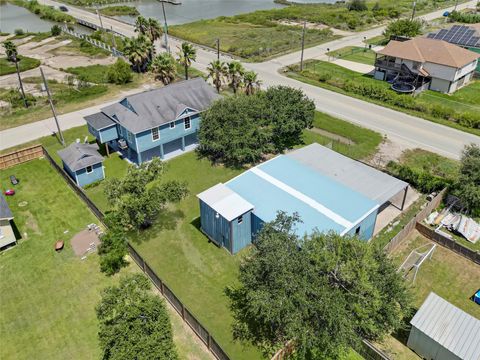
2564 E Bayshore Dr, San Leon, TX 77539
$-1,161
Cash flow
-8.7%
Cash-on-Cash Return
3.7%
Cap rate
0.7%
Rent to Value Ratio

Active
$525,000
3
bds
|
5
ba
|
1,728
sqft
|
built
2012
2431 Avenue A, San Leon, TX 77539
$-1,184
Cash flow
-11.8%
Cash-on-Cash Return
3.0%
Cap rate
0.6%
Rent to Value Ratio

Active
$595,000
2
bds
|
2
ba
|
6,268
sqft
|
built
2022
1006 23rd St, San Leon, TX 77539
$-1,685
Cash flow
-14.8%
Cash-on-Cash Return
2.3%
Cap rate
0.3%
Rent to Value Ratio

Active
$450,000
3
bds
|
3
ba
|
2,264
sqft
|
built
2005
523 28th St, Dickinson, TX 77539
$-1,000
Cash flow
-11.6%
Cash-on-Cash Return
3.0%
Cap rate
0.6%
Rent to Value Ratio

Active
$350,000
4
bds
|
4
ba
|
2,466
sqft
|
built
1977
2818 Frostwood Cir, Dickinson, TX 77539
$-313
Cash flow
-4.7%
Cash-on-Cash Return
4.6%
Cap rate
0.7%
Rent to Value Ratio
Active
$369,999
4
bds
|
3
ba
|
1,557
sqft
|
built
2003
909 18th St, San Leon, TX 77539
$-501
Cash flow
-7.1%
Cash-on-Cash Return
4.1%
Cap rate
0.7%
Rent to Value Ratio
Active
$65,000
1
bds
|
1
ba
|
639
sqft
|
built
1980
2501 Gulf Fwy, Dickinson, TX 77539
$205
Cash flow
3.7%
Cash-on-Cash Return
3.8%
Cap rate
1.7%
Rent to Value Ratio

Active
$295,000
3
bds
|
3
ba
|
2,171
sqft
|
built
2005
156 Easton Glen Ln, Dickinson, TX 77539
$-392
Cash flow
-6.9%
Cash-on-Cash Return
4.1%
Cap rate
0.7%
Rent to Value Ratio
Active
$535,000
3
bds
|
3
ba
|
2,180
sqft
|
built
2022
218 Debbie Ln, San Leon, TX 77539
$-1,499
Cash flow
-14.6%
Cash-on-Cash Return
2.3%
Cap rate
0.5%
Rent to Value Ratio

Active
$225,000
2
bds
|
2
ba
|
1,211
sqft
|
built
1994
2320 Caroline St, Dickinson, TX 77539
$-171
Cash flow
-4.0%
Cash-on-Cash Return
4.8%
Cap rate
0.8%
Rent to Value Ratio

Active
$299,900
4
bds
|
2
ba
|
1,902
sqft
|
built
1978
1206 Sunset Dr, Dickinson, TX 77539
$-318
Cash flow
-5.5%
Cash-on-Cash Return
4.4%
Cap rate
0.7%
Rent to Value Ratio
Active
$271,599
3
bds
|
2
ba
|
2,077
sqft
|
built
1972
3515 Elm Dr, Dickinson, TX 77539
$-613
Cash flow
-11.8%
Cash-on-Cash Return
3.0%
Cap rate
0.7%
Rent to Value Ratio

Active
$239,000
1
bds
|
2
ba
|
644
sqft
|
built
1972
5026 Scenic Dr, Dickinson, TX 77539
$-829
Cash flow
-18.1%
Cash-on-Cash Return
1.5%
Cap rate
0.6%
Rent to Value Ratio

Active
$219,900
3
bds
|
2
ba
|
1,290
sqft
|
built
1994
2707 Overland Trl, Dickinson, TX 77539
$-202
Cash flow
-4.8%
Cash-on-Cash Return
4.6%
Cap rate
0.8%
Rent to Value Ratio
Active
$164,999
2
bds
|
2
ba
|
1,000
sqft
|
built
1979
1002 22nd St, San Leon, TX 77539
$-136
Cash flow
-4.3%
Cash-on-Cash Return
4.7%
Cap rate
1.0%
Rent to Value Ratio

Active
$60,000
1
bds
|
1
ba
|
639
sqft
|
built
1980
2501 Gulf Fwy, Dickinson, TX 77539
$143
Cash flow
2.8%
Cash-on-Cash Return
2.9%
Cap rate
1.7%
Rent to Value Ratio

Active
$230,000
2
bds
|
1
ba
|
1,408
sqft
|
built
2011
327 3rd St, San Leon, TX 77539
$-228
Cash flow
-5.2%
Cash-on-Cash Return
4.5%
Cap rate
0.8%
Rent to Value Ratio

Active
$60,000
1
bds
|
1
ba
|
639
sqft
|
built
1980
2501 Gulf Fwy, Dickinson, TX 77539
$225
Cash flow
4.4%
Cash-on-Cash Return
4.5%
Cap rate
1.5%
Rent to Value Ratio

Active
$525,000
2
bds
|
1
ba
|
1,292
sqft
|
built
1987
309 Avenue A, San Leon, TX 77539
$-1,104
Cash flow
-11.0%
Cash-on-Cash Return
3.2%
Cap rate
0.4%
Rent to Value Ratio