78217 Investment Properties for Sale
Browse homes for sale and investment properties in 78217. Refine your search by price, property type, or more.
Best cash flowing properties in 78217
Active
$77,000
1
bds
|
1
ba
|
662
sqft
|
built
1974
3243 Nacogdoches Rd, San Antonio, TX 78217
$-200
Cash flow
-13.6%
Cash-on-Cash Return
3.1%
Cap rate
1.2%
Rent to Value Ratio
Active
$75,000
1
bds
|
1
ba
|
668
sqft
|
built
1974
3243 Nacogdoches Rd, San Antonio, TX 78217
$-262
Cash flow
-18.2%
Cash-on-Cash Return
2.1%
Cap rate
1.1%
Rent to Value Ratio
110 out of 125 properties for sale in 78217
Limited Results Shown
Create a free account, or log in to reveal all property listings and enjoy the complete experience.
Active
$210,000
3
bds
|
2
ba
|
1,419
sqft
|
built
1982
13910 Crested Crk, San Antonio, TX 78217
$-432
Cash flow
-10.7%
Cash-on-Cash Return
3.8%
Cap rate
0.8%
Rent to Value Ratio
Active
$319,990
3
bds
|
2
ba
|
1,347
sqft
|
built
2019
14902 Ardilla, San Antonio, TX 78217
$-1,042
Cash flow
-17.0%
Cash-on-Cash Return
2.4%
Cap rate
0.6%
Rent to Value Ratio
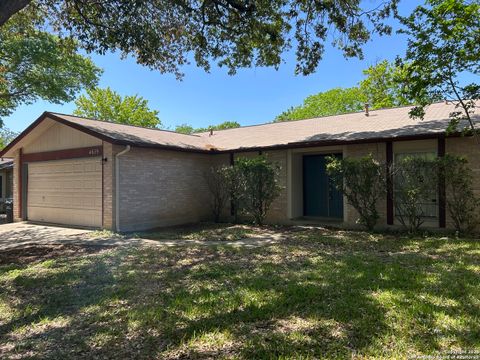
Active
$210,000
3
bds
|
2
ba
|
1,344
sqft
|
built
1979
4659 Misty Run, San Antonio, TX 78217
$-407
Cash flow
-10.1%
Cash-on-Cash Return
3.9%
Cap rate
0.8%
Rent to Value Ratio
Active
$285,000
3
bds
|
2
ba
|
1,694
sqft
|
built
1973
10514 Merritime Ct, San Antonio, TX 78217
$-776
Cash flow
-14.2%
Cash-on-Cash Return
3.0%
Cap rate
0.6%
Rent to Value Ratio

Active
$150,000
2
bds
|
2
ba
|
964
sqft
|
built
1973
8702 Village Dr, San Antonio, TX 78217
$-587
Cash flow
-20.4%
Cash-on-Cash Return
1.6%
Cap rate
0.8%
Rent to Value Ratio
Active
$290,000
3
bds
|
3
ba
|
1,714
sqft
|
built
2021
15062 Palm Desert Ct, San Antonio, TX 78217
$-853
Cash flow
-15.3%
Cash-on-Cash Return
2.7%
Cap rate
0.7%
Rent to Value Ratio

Active
$189,900
3
bds
|
1
ba
|
1,033
sqft
|
built
1972
3411 Hightree Dr, San Antonio, TX 78217
$-548
Cash flow
-15.1%
Cash-on-Cash Return
2.8%
Cap rate
0.6%
Rent to Value Ratio

Active
$130,000
1
bds
|
1
ba
|
660
sqft
|
built
1972
2811 Woodbury St, San Antonio, TX 78217
$-385
Cash flow
-15.5%
Cash-on-Cash Return
2.7%
Cap rate
0.8%
Rent to Value Ratio
Active
$365,000
4
bds
|
3
ba
|
2,829
sqft
|
built
1976
13707 Scarsdale St, San Antonio, TX 78217
$-710
Cash flow
-10.1%
Cash-on-Cash Return
3.9%
Cap rate
0.7%
Rent to Value Ratio
Active
$212,500
3
bds
|
2
ba
|
1,135
sqft
|
built
1983
14234 Swallow Dr, San Antonio, TX 78217
$-385
Cash flow
-9.5%
Cash-on-Cash Return
4.1%
Cap rate
0.8%
Rent to Value Ratio
Active
$224,900
4
bds
|
2
ba
|
1,258
sqft
|
built
1979
4819 Blue Heron Dr, San Antonio, TX 78217
$-511
Cash flow
-11.9%
Cash-on-Cash Return
3.5%
Cap rate
0.7%
Rent to Value Ratio
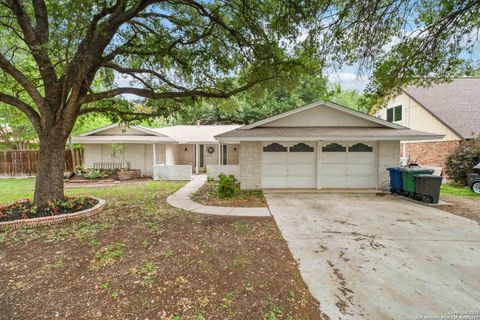
Active
$269,000
4
bds
|
2
ba
|
1,925
sqft
|
built
1982
4742 Misty Run, San Antonio, TX 78217
$-635
Cash flow
-12.3%
Cash-on-Cash Return
3.4%
Cap rate
0.7%
Rent to Value Ratio
Active
$229,900
3
bds
|
2
ba
|
2,143
sqft
|
built
1982
4826 Bohill St, San Antonio, TX 78217
$-403
Cash flow
-9.1%
Cash-on-Cash Return
4.2%
Cap rate
0.9%
Rent to Value Ratio
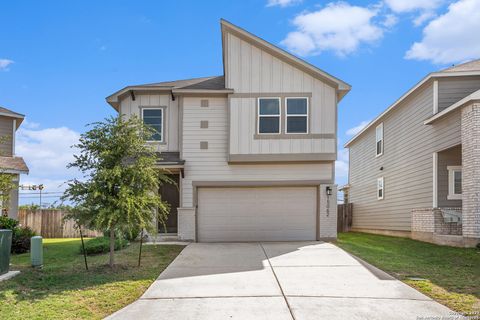
Active
$329,999
3
bds
|
2
ba
|
1,559
sqft
|
built
2019
4650 Trevor Way, San Antonio, TX 78217
$-1,029
Cash flow
-16.3%
Cash-on-Cash Return
2.5%
Cap rate
0.6%
Rent to Value Ratio
Active
$259,900
4
bds
|
2
ba
|
1,405
sqft
|
built
1959
107 Shropshire Dr, San Antonio, TX 78217
$-686
Cash flow
-13.8%
Cash-on-Cash Return
3.1%
Cap rate
0.6%
Rent to Value Ratio

Active
$440,000
4
bds
|
3
ba
|
2,536
sqft
|
built
2022
4523 Stark Aly, San Antonio, TX 78217
$-1,224
Cash flow
-14.5%
Cash-on-Cash Return
2.9%
Cap rate
0.6%
Rent to Value Ratio

Active
$550,000
4
bds
|
3
ba
|
2,880
sqft
|
built
1959
8619 Oak Ledge Dr, San Antonio, TX 78217
$-1,344
Cash flow
-12.7%
Cash-on-Cash Return
3.3%
Cap rate
0.6%
Rent to Value Ratio

Active
$328,000
3
bds
|
3
ba
|
1,909
sqft
|
built
2018
4522 Adanac Ct, San Antonio, TX 78217
$-1,024
Cash flow
-16.3%
Cash-on-Cash Return
2.5%
Cap rate
0.6%
Rent to Value Ratio

Active
$195,500
3
bds
|
2
ba
|
1,713
sqft
|
built
1973
3678 Hidden Dr, San Antonio, TX 78217
$-733
Cash flow
-19.6%
Cash-on-Cash Return
1.8%
Cap rate
0.9%
Rent to Value Ratio
Active
$135,000
2
bds
|
1
ba
|
728
sqft
|
built
1973
8702 Village Dr, San Antonio, TX 78217
$-467
Cash flow
-18.0%
Cash-on-Cash Return
2.1%
Cap rate
0.8%
Rent to Value Ratio

Active
$280,000
3
bds
|
2
ba
|
1,214
sqft
|
built
1982
13911 Woodbreeze St, San Antonio, TX 78217
$-909
Cash flow
-16.9%
Cash-on-Cash Return
2.4%
Cap rate
0.5%
Rent to Value Ratio

Active
$157,000
2
bds
|
2
ba
|
982
sqft
|
built
1972
2811 Woodbury St, San Antonio, TX 78217
$-608
Cash flow
-20.2%
Cash-on-Cash Return
1.6%
Cap rate
0.7%
Rent to Value Ratio
Active
$75,000
1
bds
|
1
ba
|
668
sqft
|
built
1974
3243 Nacogdoches Rd, San Antonio, TX 78217
$-262
Cash flow
-18.2%
Cash-on-Cash Return
2.1%
Cap rate
1.1%
Rent to Value Ratio
Active
$189,000
2
bds
|
2
ba
|
1,297
sqft
|
built
1970
9002 Wickfield St, San Antonio, TX 78217
$-804
Cash flow
-22.2%
Cash-on-Cash Return
1.2%
Cap rate
0.7%
Rent to Value Ratio
Active
$139,000
2
bds
|
2
ba
|
982
sqft
|
built
1972
2811 Woodbury St, San Antonio, TX 78217
$-464
Cash flow
-17.4%
Cash-on-Cash Return
2.3%
Cap rate
0.9%
Rent to Value Ratio

Active
$999,950
4
bds
|
3
ba
|
3,725
sqft
|
built
1948
3038 S Valley View Ln, San Antonio, TX 78217
$-4,528
Cash flow
-23.6%
Cash-on-Cash Return
0.8%
Cap rate
0.4%
Rent to Value Ratio
Active
$405,000
4
bds
|
3
ba
|
2,549
sqft
|
built
1978
4602 Bohill St, San Antonio, TX 78217
$-1,077
Cash flow
-13.9%
Cash-on-Cash Return
3.1%
Cap rate
0.6%
Rent to Value Ratio
Active
$77,000
1
bds
|
1
ba
|
662
sqft
|
built
1974
3243 Nacogdoches Rd, San Antonio, TX 78217
$-200
Cash flow
-13.6%
Cash-on-Cash Return
3.1%
Cap rate
1.2%
Rent to Value Ratio
Active
$295,000
3
bds
|
3
ba
|
1,798
sqft
|
built
1991
13802 Fairway Crst, San Antonio, TX 78217
$-555
Cash flow
-9.8%
Cash-on-Cash Return
4.0%
Cap rate
0.7%
Rent to Value Ratio
Active
$699,900
4
bds
|
4
ba
|
2,982
sqft
|
built
1952
9319 Oak Ledge Dr, San Antonio, TX 78217
$-2,022
Cash flow
-15.1%
Cash-on-Cash Return
2.8%
Cap rate
0.6%
Rent to Value Ratio

Active
$275,000
2
bds
|
3
ba
|
1,980
sqft
|
built
1973
8919 Wickfield St, San Antonio, TX 78217
$-835
Cash flow
-15.8%
Cash-on-Cash Return
2.6%
Cap rate
0.7%
Rent to Value Ratio
Active
$110,000
2
bds
|
2
ba
|
863
sqft
|
built
1974
3243 Nacogdoches Rd, San Antonio, TX 78217
$-368
Cash flow
-17.5%
Cash-on-Cash Return
2.2%
Cap rate
1.0%
Rent to Value Ratio

Active
$125,000
2
bds
|
1
ba
|
854
sqft
|
built
1973
8702 Village Dr, San Antonio, TX 78217
$-413
Cash flow
-17.2%
Cash-on-Cash Return
2.3%
Cap rate
1.0%
Rent to Value Ratio

Active
$148,000
2
bds
|
2
ba
|
982
sqft
|
built
1972
2811 Woodbury St, San Antonio, TX 78217
$-373
Cash flow
-13.1%
Cash-on-Cash Return
3.2%
Cap rate
0.9%
Rent to Value Ratio
Active
$300,000
3
bds
|
2
ba
|
1,894
sqft
|
built
1968
9708 Gemini Dr, San Antonio, TX 78217
$-974
Cash flow
-16.9%
Cash-on-Cash Return
2.4%
Cap rate
0.6%
Rent to Value Ratio

Active
$429,000
4
bds
|
3
ba
|
2,195
sqft
|
built
1983
8614 Brookhaven St, San Antonio, TX 78217
$-1,122
Cash flow
-13.6%
Cash-on-Cash Return
3.1%
Cap rate
0.6%
Rent to Value Ratio
Active
$249,900
3
bds
|
2
ba
|
1,699
sqft
|
built
1982
4802 Flicker St, San Antonio, TX 78217
$-531
Cash flow
-11.1%
Cash-on-Cash Return
3.7%
Cap rate
0.7%
Rent to Value Ratio
Active
$234,500
3
bds
|
2
ba
|
1,290
sqft
|
built
1962
9911 Flourisant Dr, San Antonio, TX 78217
$-573
Cash flow
-12.7%
Cash-on-Cash Return
3.3%
Cap rate
0.7%
Rent to Value Ratio
Active
$218,000
3
bds
|
1
ba
|
1,017
sqft
|
built
1968
4303 Sunshadow St, San Antonio, TX 78217
$-638
Cash flow
-15.3%
Cash-on-Cash Return
2.8%
Cap rate
0.6%
Rent to Value Ratio
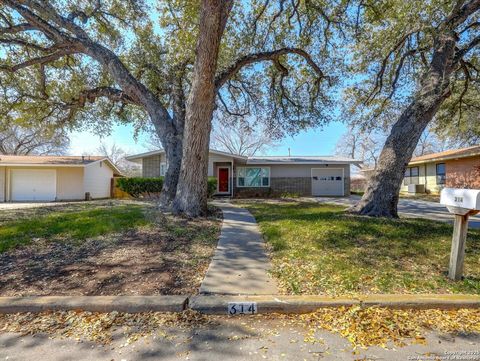
Active
$268,000
3
bds
|
2
ba
|
1,374
sqft
|
built
1956
314 Haverford Dr, San Antonio, TX 78217
$-724
Cash flow
-14.1%
Cash-on-Cash Return
3.0%
Cap rate
0.6%
Rent to Value Ratio