78217 Investment Properties for Sale
Browse homes for sale and investment properties in 78217. Refine your search by price, property type, or more.
Best cash flowing properties in 78217
Active
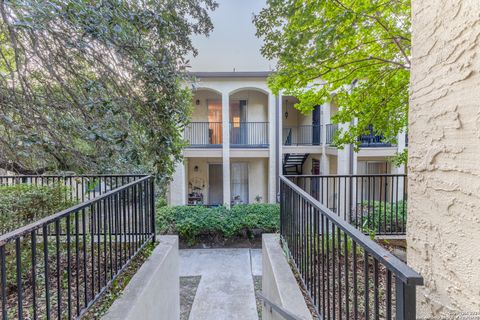
$126,000
2
bds
|
1
ba
|
723
sqft
|
built
1973
8702 Village Dr, San Antonio, TX 78217
$-51
Cash flow
-2.1%
Cash-on-Cash Return
5.8%
Cap rate
1.1%
Rent to Value Ratio
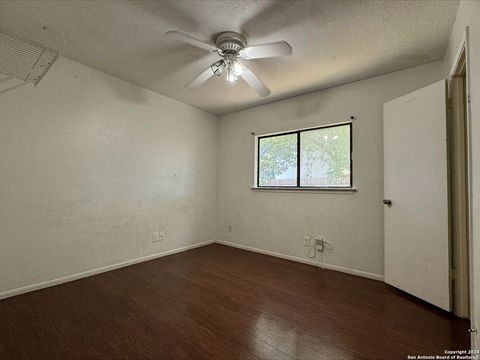
Active
$110,000
1
bds
|
1
ba
|
531
sqft
|
built
1980
3843 Barrington St, San Antonio, TX 78217
$-253
Cash flow
-12.0%
Cash-on-Cash Return
3.5%
Cap rate
0.9%
Rent to Value Ratio
110 out of 125 properties for sale in 78217
Limited Results Shown
Create a free account, or log in to reveal all property listings and enjoy the complete experience.
Active
$479,000
4
bds
|
3
ba
|
2,618
sqft
|
built
1961
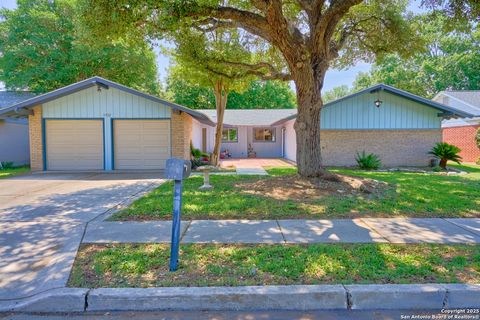
8731 Oak Ledge Dr, San Antonio, TX 78217
$-1,595
Cash flow
-17.4%
Cash-on-Cash Return
2.3%
Cap rate
0.5%
Rent to Value Ratio
Active
$349,000
3
bds
|
2
ba
|
2,045
sqft
|
built
1978
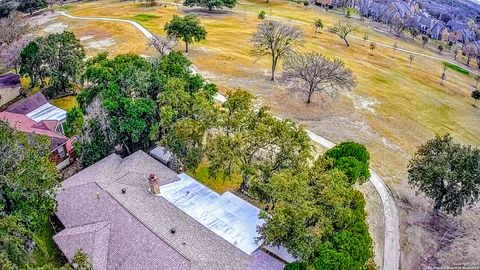
4250 Putting Grn, San Antonio, TX 78217
$-304
Cash flow
-4.5%
Cash-on-Cash Return
5.2%
Cap rate
0.6%
Rent to Value Ratio
Active
$239,900
3
bds
|
2
ba
|
1,300
sqft
|
built
1975
13926 Anchorage Hl, San Antonio, TX 78217
$-577
Cash flow
-12.5%
Cash-on-Cash Return
3.4%
Cap rate
0.7%
Rent to Value Ratio
Active
$219,999
2
bds
|
2
ba
|
1,330
sqft
|
built
1972
9016 Wickfield St, San Antonio, TX 78217
$-802
Cash flow
-19.0%
Cash-on-Cash Return
1.9%
Cap rate
0.8%
Rent to Value Ratio
Active
$215,000
2
bds
|
2
ba
|
1,465
sqft
|
built
1994
4811 Aspen Vw, San Antonio, TX 78217
$-473
Cash flow
-11.5%
Cash-on-Cash Return
3.6%
Cap rate
0.7%
Rent to Value Ratio

Active
$275,000
4
bds
|
2
ba
|
1,702
sqft
|
built
1993
4503 Stradford Pl, San Antonio, TX 78217
$-568
Cash flow
-10.8%
Cash-on-Cash Return
3.8%
Cap rate
0.7%
Rent to Value Ratio
Active
$335,000
3
bds
|
3
ba
|
2,395
sqft
|
built
1992
14015 Fairway Ct, San Antonio, TX 78217
$-1,041
Cash flow
-16.2%
Cash-on-Cash Return
2.5%
Cap rate
0.6%
Rent to Value Ratio

Active
$229,000
2
bds
|
2
ba
|
1,868
sqft
|
built
1973
3678 Hidden Dr, San Antonio, TX 78217
$-454
Cash flow
-10.3%
Cash-on-Cash Return
3.9%
Cap rate
0.7%
Rent to Value Ratio
Active
$292,000
3
bds
|
2
ba
|
1,490
sqft
|
built
1983
4900 Grey Hawk Dr, San Antonio, TX 78217
$-348
Cash flow
-6.2%
Cash-on-Cash Return
4.8%
Cap rate
0.8%
Rent to Value Ratio
Active
$297,499
3
bds
|
2
ba
|
2,062
sqft
|
built
1974
8908 Wexford St, San Antonio, TX 78217
$-1,098
Cash flow
-19.3%
Cash-on-Cash Return
1.8%
Cap rate
0.7%
Rent to Value Ratio
Active
$1,100,000
5
bds
|
6
ba
|
4,505
sqft
|
built
1957
9318 Oak Ledge Dr, San Antonio, TX 78217
$-4,596
Cash flow
-21.8%
Cash-on-Cash Return
1.3%
Cap rate
0.3%
Rent to Value Ratio
Active
$358,000
3
bds
|
2
ba
|
1,661
sqft
|
built
2021
4415 Tiger Run, San Antonio, TX 78217
$-1,043
Cash flow
-15.2%
Cash-on-Cash Return
2.8%
Cap rate
0.6%
Rent to Value Ratio

Active
$262,000
3
bds
|
2
ba
|
1,952
sqft
|
built
1994
4566 Sherwood Way, San Antonio, TX 78217
$-567
Cash flow
-11.3%
Cash-on-Cash Return
3.7%
Cap rate
0.8%
Rent to Value Ratio
Active
$299,000
3
bds
|
2
ba
|
2,002
sqft
|
built
1964
9702 Lantana Dr, San Antonio, TX 78217
$-870
Cash flow
-15.2%
Cash-on-Cash Return
2.8%
Cap rate
0.7%
Rent to Value Ratio
Active
$199,999
3
bds
|
2
ba
|
1,230
sqft
|
built
1969
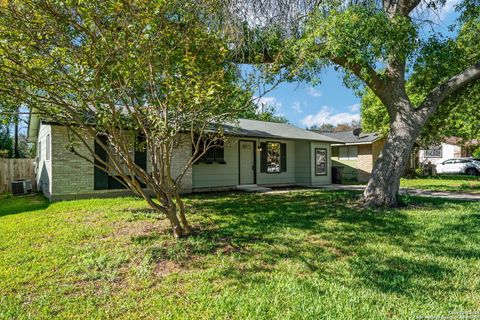
4354 Summer Wind St, San Antonio, TX 78217
$-429
Cash flow
-11.2%
Cash-on-Cash Return
3.7%
Cap rate
0.7%
Rent to Value Ratio
Active
$219,000
3
bds
|
2
ba
|
1,999
sqft
|
built
1972
9009 Wexford St, San Antonio, TX 78217
$-620
Cash flow
-14.8%
Cash-on-Cash Return
2.9%
Cap rate
0.9%
Rent to Value Ratio
Active
$325,000
3
bds
|
2
ba
|
2,055
sqft
|
built
1972
4002 Bentway St, San Antonio, TX 78217
$-566
Cash flow
-9.1%
Cash-on-Cash Return
4.2%
Cap rate
0.8%
Rent to Value Ratio
Active
$269,500
3
bds
|
2
ba
|
1,644
sqft
|
built
1982
4714 Bohill St, San Antonio, TX 78217
$-680
Cash flow
-13.2%
Cash-on-Cash Return
3.2%
Cap rate
0.7%
Rent to Value Ratio
Active
$245,499
3
bds
|
2
ba
|
1,386
sqft
|
built
1982
4911 Dare Ln, San Antonio, TX 78217
$-326
Cash flow
-6.9%
Cash-on-Cash Return
4.7%
Cap rate
0.8%
Rent to Value Ratio
Active
$110,000
1
bds
|
1
ba
|
531
sqft
|
built
1980
3843 Barrington St, San Antonio, TX 78217
$-253
Cash flow
-12.0%
Cash-on-Cash Return
3.5%
Cap rate
0.9%
Rent to Value Ratio
Active
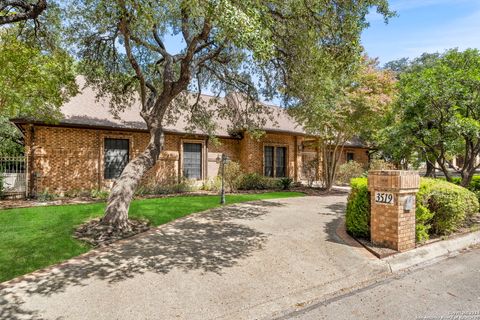
$685,000
4
bds
|
3
ba
|
3,604
sqft
|
built
1984
3519 Ryoak St, San Antonio, TX 78217
$-2,123
Cash flow
-16.2%
Cash-on-Cash Return
2.5%
Cap rate
0.6%
Rent to Value Ratio
Active
$299,900
3
bds
|
2
ba
|
1,672
sqft
|
built
1985
13702 Bellcrest Dr, San Antonio, TX 78217
$-703
Cash flow
-12.2%
Cash-on-Cash Return
3.5%
Cap rate
0.7%
Rent to Value Ratio
Active
$110,000
1
bds
|
1
ba
|
582
sqft
|
built
1973
8702 Village Dr, San Antonio, TX 78217
$-292
Cash flow
-13.8%
Cash-on-Cash Return
3.1%
Cap rate
0.9%
Rent to Value Ratio
Active
$229,900
3
bds
|
2
ba
|
1,980
sqft
|
built
1993
14319 Bromley Pl, San Antonio, TX 78217
$-515
Cash flow
-11.7%
Cash-on-Cash Return
3.6%
Cap rate
0.8%
Rent to Value Ratio

Active
$900,000
20
bds
|
0
ba
|
2,120
sqft
|
built
1972
2701 Woodbury St, San Antonio, TX 78217
$-4,332
Cash flow
-25.1%
Cash-on-Cash Return
0.5%
Cap rate
0.1%
Rent to Value Ratio
Active
$126,000
2
bds
|
1
ba
|
723
sqft
|
built
1973
8702 Village Dr, San Antonio, TX 78217
$-51
Cash flow
-2.1%
Cash-on-Cash Return
5.8%
Cap rate
1.1%
Rent to Value Ratio

Active
$175,000
2
bds
|
2
ba
|
1,195
sqft
|
built
1977
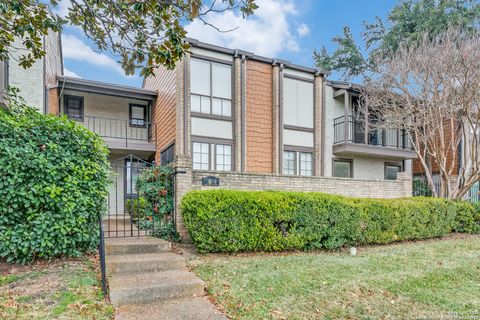
2935 Nacogdoches Rd, San Antonio, TX 78217
$-632
Cash flow
-18.8%
Cash-on-Cash Return
1.9%
Cap rate
0.7%
Rent to Value Ratio
Active
$215,000
2
bds
|
2
ba
|
1,409
sqft
|
built
1973
3678 Hidden Dr, San Antonio, TX 78217
$-574
Cash flow
-13.9%
Cash-on-Cash Return
3.1%
Cap rate
0.8%
Rent to Value Ratio
Active
$275,000
3
bds
|
2
ba
|
1,711
sqft
|
built
1984
12630 Thistle Down, San Antonio, TX 78217
$-596
Cash flow
-11.3%
Cash-on-Cash Return
3.7%
Cap rate
0.7%
Rent to Value Ratio
Active
$96,500
1
bds
|
1
ba
|
507
sqft
|
built
1982
10527 Perrin Beitel Rd, San Antonio, TX 78217
$-348
Cash flow
-18.8%
Cash-on-Cash Return
1.9%
Cap rate
0.9%
Rent to Value Ratio