78223 Investment Properties for Sale
Browse homes for sale and investment properties in 78223. Refine your search by price, property type, or more.
Best cash flowing properties in 78223
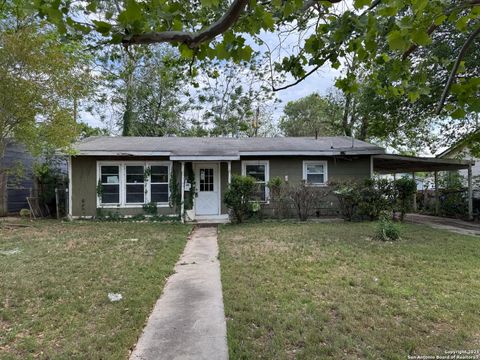
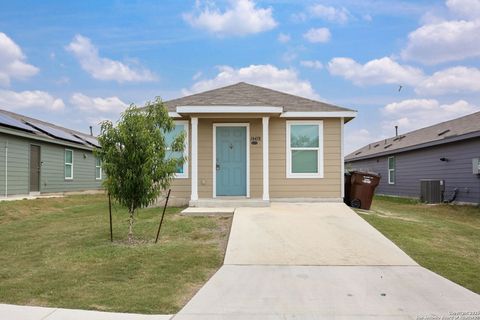
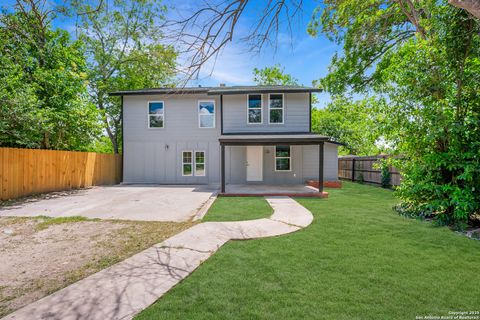
Active
$99,900
3
bds
|
1
ba
|
988
sqft
|
built
1954
274 Gayle Ave, San Antonio, TX 78223
$162
Cash flow
8.5%
Cash-on-Cash Return
8.2%
Cap rate
1.4%
Rent to Value Ratio
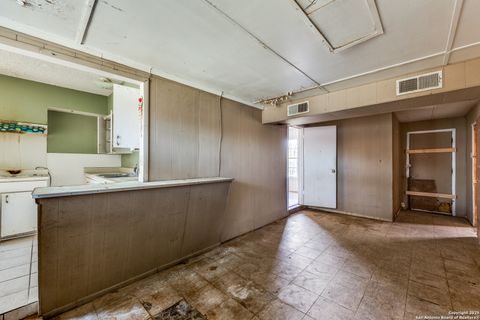
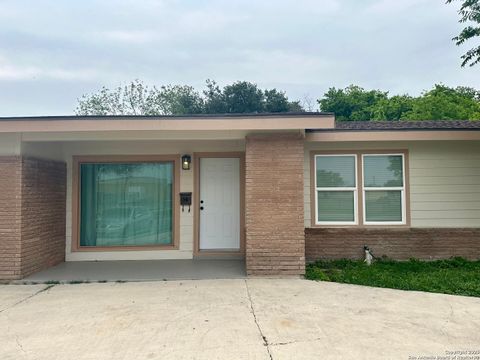
Active
$129,000
3
bds
|
1
ba
|
1,482
sqft
|
built
1960
3302 Kildare Ave, San Antonio, TX 78223
$40
Cash flow
1.6%
Cash-on-Cash Return
6.6%
Cap rate
1.2%
Rent to Value Ratio
137 out of 140 properties for sale in 78223
Limited Results Shown
Create a free account, or log in to reveal all property listings and enjoy the complete experience.
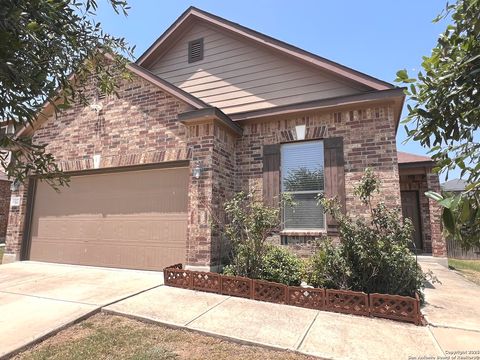
Active
$245,000
4
bds
|
2
ba
|
1,687
sqft
|
built
2016
4527 Southton Way, San Antonio, TX 78223
$-573
Cash flow
-12.2%
Cash-on-Cash Return
3.5%
Cap rate
0.7%
Rent to Value Ratio
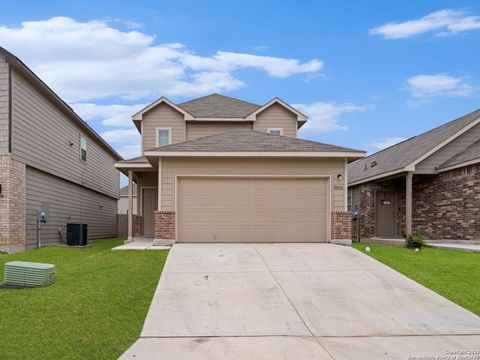
Active
$265,000
4
bds
|
3
ba
|
2,093
sqft
|
built
2021
10518 Green Rock Dr, San Antonio, TX 78223
$-585
Cash flow
-11.5%
Cash-on-Cash Return
3.6%
Cap rate
0.7%
Rent to Value Ratio
Active
$259,000
3
bds
|
2
ba
|
1,670
sqft
|
built
2017
10110 Raspberry Oak, San Antonio, TX 78223
$-687
Cash flow
-13.8%
Cash-on-Cash Return
3.1%
Cap rate
0.7%
Rent to Value Ratio
Active
$125,000
3
bds
|
1
ba
|
1,270
sqft
|
built
1952
103 Pollydale Ave, San Antonio, TX 78223
$-100
Cash flow
-4.2%
Cash-on-Cash Return
5.3%
Cap rate
1.1%
Rent to Value Ratio
Active
$125,000
3
bds
|
1
ba
|
812
sqft
|
built
1957
3711 Southport Dr, San Antonio, TX 78223
$-186
Cash flow
-7.8%
Cash-on-Cash Return
4.5%
Cap rate
0.9%
Rent to Value Ratio
Active
$200,000
3
bds
|
2
ba
|
1,199
sqft
|
built
1960
435 Harcourt Ave, San Antonio, TX 78223
$-359
Cash flow
-9.4%
Cash-on-Cash Return
4.1%
Cap rate
0.8%
Rent to Value Ratio
Active
$177,500
3
bds
|
2
ba
|
1,007
sqft
|
built
2022
14418 Southton Basin, San Antonio, TX 78223
$-107
Cash flow
-3.1%
Cash-on-Cash Return
5.5%
Cap rate
0.9%
Rent to Value Ratio
Active
$259,900
4
bds
|
3
ba
|
2,400
sqft
|
built
2003
7431 Bajo Luna, San Antonio, TX 78223
$-144
Cash flow
-2.9%
Cash-on-Cash Return
5.6%
Cap rate
0.7%
Rent to Value Ratio
Active
$220,000
3
bds
|
2
ba
|
1,368
sqft
|
built
1948
110 Heather Ave, San Antonio, TX 78223
$-336
Cash flow
-8.0%
Cash-on-Cash Return
4.4%
Cap rate
0.8%
Rent to Value Ratio
Active
$279,000
4
bds
|
3
ba
|
2,661
sqft
|
built
2005
10019 Buescher Ln, San Antonio, TX 78223
$-617
Cash flow
-11.5%
Cash-on-Cash Return
3.6%
Cap rate
0.7%
Rent to Value Ratio

Active
$258,000
3
bds
|
3
ba
|
2,068
sqft
|
built
2006
7830 Beechnut Oak, San Antonio, TX 78223
$-335
Cash flow
-6.8%
Cash-on-Cash Return
4.7%
Cap rate
0.8%
Rent to Value Ratio

Active
$339,900
4
bds
|
3
ba
|
3,324
sqft
|
built
1969
4615 Golf View Dr, San Antonio, TX 78223
$-564
Cash flow
-8.7%
Cash-on-Cash Return
4.3%
Cap rate
0.8%
Rent to Value Ratio

Active
$239,888
4
bds
|
3
ba
|
1,663
sqft
|
built
2008
2211 Mission Verde, San Antonio, TX 78223
$-651
Cash flow
-14.2%
Cash-on-Cash Return
3.0%
Cap rate
0.7%
Rent to Value Ratio
Active
$255,000
3
bds
|
3
ba
|
1,757
sqft
|
built
1921
312 Avondale Ave, San Antonio, TX 78223
$-768
Cash flow
-15.7%
Cash-on-Cash Return
2.6%
Cap rate
0.5%
Rent to Value Ratio
Active
$215,999
3
bds
|
2
ba
|
1,598
sqft
|
built
1955
123 Nash Blvd, San Antonio, TX 78223
$-292
Cash flow
-7.1%
Cash-on-Cash Return
4.6%
Cap rate
0.8%
Rent to Value Ratio
Active
$120,000
3
bds
|
1
ba
|
1,040
sqft
|
built
1952
3218 E Southcross Blvd, San Antonio, TX 78223
$-51
Cash flow
-2.2%
Cash-on-Cash Return
5.8%
Cap rate
1.1%
Rent to Value Ratio
Active
$185,000
3
bds
|
2
ba
|
1,716
sqft
|
built
1948
201 Monticello Ct, San Antonio, TX 78223
$-23
Cash flow
-0.6%
Cash-on-Cash Return
6.1%
Cap rate
1.0%
Rent to Value Ratio
Active
$239,000
3
bds
|
2
ba
|
1,463
sqft
|
built
1948
3950 S Walters, San Antonio, TX 78223
$-327
Cash flow
-7.1%
Cash-on-Cash Return
4.6%
Cap rate
0.8%
Rent to Value Ratio
Active
$205,499
3
bds
|
1
ba
|
1,684
sqft
|
built
1955
122 Hartford Ave, San Antonio, TX 78223
$-396
Cash flow
-10.1%
Cash-on-Cash Return
4.0%
Cap rate
0.8%
Rent to Value Ratio
Active
$200,000
3
bds
|
2
ba
|
1,260
sqft
|
built
1962
3354 Bob Billa St, San Antonio, TX 78223
$-303
Cash flow
-7.9%
Cash-on-Cash Return
4.4%
Cap rate
0.8%
Rent to Value Ratio
Active
$170,000
3
bds
|
2
ba
|
1,345
sqft
|
built
2006
9202 Mission Brk, San Antonio, TX 78223
$-230
Cash flow
-7.1%
Cash-on-Cash Return
4.6%
Cap rate
0.9%
Rent to Value Ratio
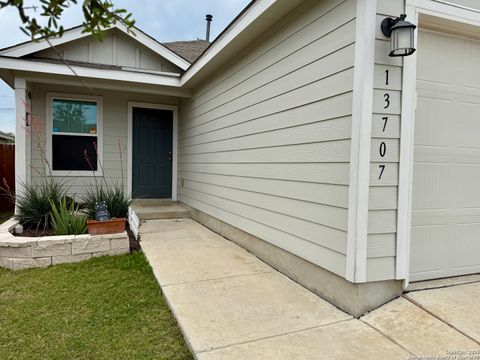
Active
$210,000
3
bds
|
2
ba
|
1,260
sqft
|
built
2020
13707 Arroyo Seco, San Antonio, TX 78223
$-347
Cash flow
-8.6%
Cash-on-Cash Return
4.3%
Cap rate
0.8%
Rent to Value Ratio
Active
$239,999
3
bds
|
2
ba
|
1,372
sqft
|
built
1992
417 Lebanon St, San Antonio, TX 78223
$-437
Cash flow
-9.5%
Cash-on-Cash Return
4.1%
Cap rate
0.7%
Rent to Value Ratio

Active
$249,500
3
bds
|
2
ba
|
1,288
sqft
|
built
1957
135 Dublin Ave, San Antonio, TX 78223
$-484
Cash flow
-10.1%
Cash-on-Cash Return
3.9%
Cap rate
0.6%
Rent to Value Ratio
Active
$205,000
3
bds
|
2
ba
|
1,427
sqft
|
built
2009
8906 Mission Brk, San Antonio, TX 78223
$-457
Cash flow
-11.6%
Cash-on-Cash Return
3.6%
Cap rate
0.8%
Rent to Value Ratio
Active
$195,000
3
bds
|
2
ba
|
1,130
sqft
|
built
1999
327 Juniper St, San Antonio, TX 78223
$-314
Cash flow
-8.4%
Cash-on-Cash Return
4.3%
Cap rate
0.8%
Rent to Value Ratio
Active
$99,900
3
bds
|
1
ba
|
988
sqft
|
built
1954
274 Gayle Ave, San Antonio, TX 78223
$162
Cash flow
8.5%
Cash-on-Cash Return
8.2%
Cap rate
1.4%
Rent to Value Ratio
Active
$210,900
3
bds
|
3
ba
|
1,461
sqft
|
built
2018
6743 Tehama Gate, San Antonio, TX 78223
$-375
Cash flow
-9.3%
Cash-on-Cash Return
4.1%
Cap rate
0.9%
Rent to Value Ratio
Active
$265,000
3
bds
|
3
ba
|
2,241
sqft
|
built
2012
13118 Stetson Trl, San Antonio, TX 78223
$-602
Cash flow
-11.9%
Cash-on-Cash Return
3.5%
Cap rate
0.7%
Rent to Value Ratio
Active
$217,500
3
bds
|
1
ba
|
1,300
sqft
|
built
1950
243 Pool Dr, San Antonio, TX 78223
$-452
Cash flow
-10.8%
Cash-on-Cash Return
3.8%
Cap rate
0.7%
Rent to Value Ratio
Active
$172,000
3
bds
|
1
ba
|
832
sqft
|
built
1958
390 Harcourt Ave, San Antonio, TX 78223
$-211
Cash flow
-6.4%
Cash-on-Cash Return
4.8%
Cap rate
0.8%
Rent to Value Ratio
Active
$249,700
4
bds
|
2
ba
|
1,550
sqft
|
built
1998
311 Lebanon St, San Antonio, TX 78223
$-419
Cash flow
-8.8%
Cash-on-Cash Return
4.3%
Cap rate
0.7%
Rent to Value Ratio
Active
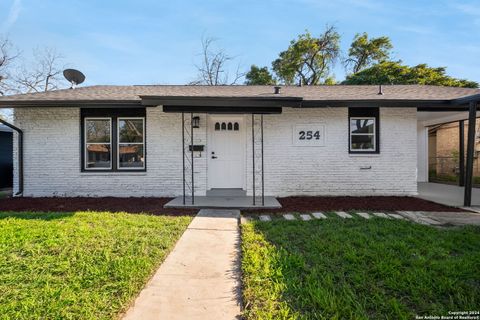
$170,000
4
bds
|
2
ba
|
1,008
sqft
|
built
1958
254 Kate Schenck Ave, San Antonio, TX 78223
$33
Cash flow
1.0%
Cash-on-Cash Return
6.5%
Cap rate
1.1%
Rent to Value Ratio

Active
$205,000
3
bds
|
2
ba
|
1,232
sqft
|
built
1998
318 Margo St, San Antonio, TX 78223
$-357
Cash flow
-9.1%
Cash-on-Cash Return
4.2%
Cap rate
0.8%
Rent to Value Ratio
Active
$179,500
2
bds
|
1
ba
|
780
sqft
|
built
1951
670 Mc Dougal Ave, San Antonio, TX 78223
$-237
Cash flow
-6.9%
Cash-on-Cash Return
4.7%
Cap rate
0.8%
Rent to Value Ratio

Active
$264,999
4
bds
|
3
ba
|
2,060
sqft
|
built
2009
4411 Stetson Park, San Antonio, TX 78223
$-752
Cash flow
-14.8%
Cash-on-Cash Return
2.9%
Cap rate
0.6%
Rent to Value Ratio
Active
$250,000
3
bds
|
2
ba
|
1,484
sqft
|
built
1958
383 Nash Blvd, San Antonio, TX 78223
$-559
Cash flow
-11.7%
Cash-on-Cash Return
3.6%
Cap rate
0.7%
Rent to Value Ratio
Active
$129,000
3
bds
|
1
ba
|
1,482
sqft
|
built
1960
3302 Kildare Ave, San Antonio, TX 78223
$40
Cash flow
1.6%
Cash-on-Cash Return
6.6%
Cap rate
1.2%
Rent to Value Ratio
Active
$110,000
3
bds
|
1
ba
|
1,384
sqft
|
built
1921
335 Hot Wells Blvd, San Antonio, TX 78223
$17
Cash flow
0.8%
Cash-on-Cash Return
6.4%
Cap rate
1.3%
Rent to Value Ratio

Active
$100,000
2
bds
|
1
ba
|
848
sqft
|
built
1926
306 Monticello Ct, San Antonio, TX 78223
$-7
Cash flow
-0.4%
Cash-on-Cash Return
6.2%
Cap rate
1.1%
Rent to Value Ratio