78245 Investment Properties for Sale
Browse homes for sale and investment properties in 78245. Refine your search by price, property type, or more.
Best cash flowing properties in 78245
Active
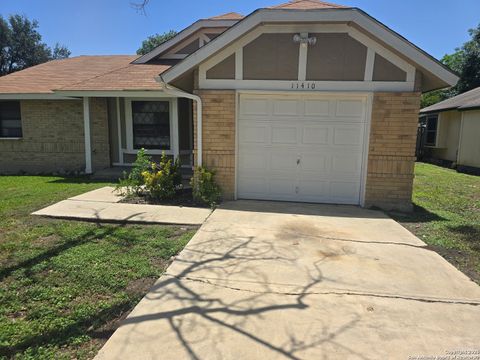
$179,900
3
bds
|
1
ba
|
1,375
sqft
|
built
1984
11410 Hatchet Pass Dr, San Antonio, TX 78245
$-94
Cash flow
-2.7%
Cash-on-Cash Return
5.0%
Cap rate
0.9%
Rent to Value Ratio

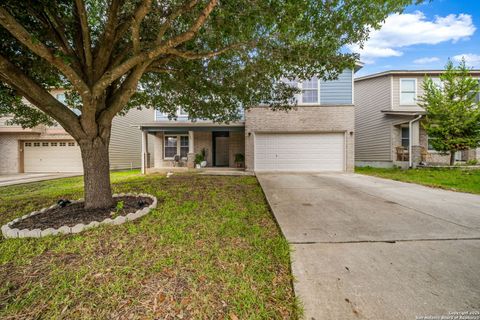
Active
$194,999
3
bds
|
2
ba
|
1,144
sqft
|
built
1978
1119 Boling Brook St, San Antonio, TX 78245
$-207
Cash flow
-5.5%
Cash-on-Cash Return
4.4%
Cap rate
0.8%
Rent to Value Ratio
200 out of 209 properties for sale in 78245
Limited Results Shown
Create a free account, or log in to reveal all property listings and enjoy the complete experience.

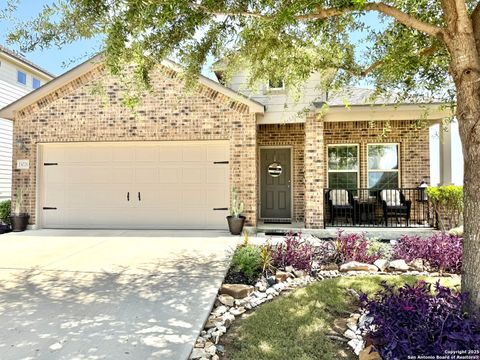
Active
$379,900
4
bds
|
4
ba
|
2,518
sqft
|
built
2016
715 Hard Tack Trl, San Antonio, TX 78245
$-675
Cash flow
-9.3%
Cash-on-Cash Return
3.5%
Cap rate
0.7%
Rent to Value Ratio

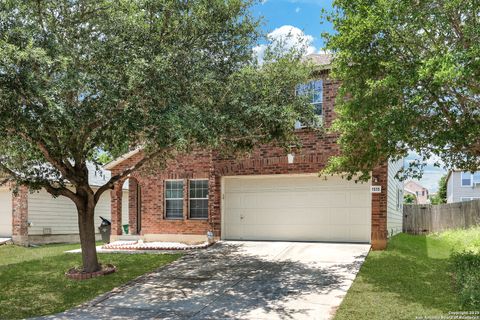
Active
$339,000
3
bds
|
3
ba
|
2,384
sqft
|
built
2020
2110 Themis Way, San Antonio, TX 78245
$-606
Cash flow
-9.3%
Cash-on-Cash Return
3.5%
Cap rate
0.7%
Rent to Value Ratio

Active
$258,000
3
bds
|
2
ba
|
1,466
sqft
|
built
1985
9807 Sugarloaf Dr, San Antonio, TX 78245
$-391
Cash flow
-7.9%
Cash-on-Cash Return
3.9%
Cap rate
0.7%
Rent to Value Ratio

Active
$330,000
4
bds
|
3
ba
|
2,440
sqft
|
built
2022
3542 Silver Set, San Antonio, TX 78245
$-598
Cash flow
-9.5%
Cash-on-Cash Return
3.5%
Cap rate
0.7%
Rent to Value Ratio

Active
$275,000
3
bds
|
3
ba
|
2,249
sqft
|
built
2005
10323 Medio Crk, San Antonio, TX 78245
$-500
Cash flow
-9.5%
Cash-on-Cash Return
3.5%
Cap rate
0.7%
Rent to Value Ratio

Active
$219,000
3
bds
|
3
ba
|
1,128
sqft
|
built
2001
11442 Blue Mesa Dr, San Antonio, TX 78245
$-213
Cash flow
-5.1%
Cash-on-Cash Return
4.5%
Cap rate
0.7%
Rent to Value Ratio

Active
$455,000
4
bds
|
3
ba
|
3,191
sqft
|
built
2013
5102 Thymus Dr, San Antonio, TX 78245
$-1,364
Cash flow
-15.6%
Cash-on-Cash Return
2.1%
Cap rate
0.5%
Rent to Value Ratio

Active
$315,000
5
bds
|
3
ba
|
2,544
sqft
|
built
2016
2027 Emerald Edge, San Antonio, TX 78245
$-466
Cash flow
-7.7%
Cash-on-Cash Return
3.9%
Cap rate
0.7%
Rent to Value Ratio

Active
$295,000
4
bds
|
3
ba
|
2,500
sqft
|
built
2005
10431 Manor Crk, San Antonio, TX 78245
$-718
Cash flow
-12.7%
Cash-on-Cash Return
2.8%
Cap rate
0.6%
Rent to Value Ratio

Active
$420,000
5
bds
|
4
ba
|
2,979
sqft
|
built
2022
3553 Under Par, San Antonio, TX 78245
$-944
Cash flow
-11.7%
Cash-on-Cash Return
3.0%
Cap rate
0.6%
Rent to Value Ratio

Active
$449,999
4
bds
|
4
ba
|
2,647
sqft
|
built
2007
1011 Ranch Fls, San Antonio, TX 78245
$-1,106
Cash flow
-12.8%
Cash-on-Cash Return
2.7%
Cap rate
0.6%
Rent to Value Ratio

Active
$223,000
3
bds
|
2
ba
|
1,398
sqft
|
built
1984
11339 Jarbo Pass Dr, San Antonio, TX 78245
$-269
Cash flow
-6.3%
Cash-on-Cash Return
4.2%
Cap rate
0.8%
Rent to Value Ratio

Active
$495,000
6
bds
|
0
ba
|
2,712
sqft
|
built
2021
10314 Lynwood Br, San Antonio, TX 78245
$-2,075
Cash flow
-21.9%
Cash-on-Cash Return
0.6%
Cap rate
0.3%
Rent to Value Ratio

Active
$274,900
3
bds
|
3
ba
|
1,992
sqft
|
built
2006
9015 Sycamore Cv, San Antonio, TX 78245
$-538
Cash flow
-10.2%
Cash-on-Cash Return
3.3%
Cap rate
0.7%
Rent to Value Ratio

Active
$314,000
5
bds
|
4
ba
|
2,657
sqft
|
built
2011
11306 Camp Creek Trl, San Antonio, TX 78245
$-589
Cash flow
-9.8%
Cash-on-Cash Return
3.4%
Cap rate
0.6%
Rent to Value Ratio

Active
$190,000
3
bds
|
2
ba
|
1,688
sqft
|
built
2007
1402 Hunters Plane, San Antonio, TX 78245
$-282
Cash flow
-7.7%
Cash-on-Cash Return
3.9%
Cap rate
0.8%
Rent to Value Ratio

Active
$260,000
4
bds
|
2
ba
|
1,820
sqft
|
built
1973
9501 Bear Creek Dr, San Antonio, TX 78245
$-728
Cash flow
-14.6%
Cash-on-Cash Return
2.3%
Cap rate
0.5%
Rent to Value Ratio

Active
$239,000
3
bds
|
2
ba
|
1,290
sqft
|
built
1972
9106 Port Hudson St, San Antonio, TX 78245
$-387
Cash flow
-8.4%
Cash-on-Cash Return
3.7%
Cap rate
0.7%
Rent to Value Ratio

Active
$255,000
3
bds
|
2
ba
|
1,286
sqft
|
built
1987
307 Delbert Dr, San Antonio, TX 78245
$-501
Cash flow
-10.3%
Cash-on-Cash Return
3.3%
Cap rate
0.6%
Rent to Value Ratio

Active
$248,000
4
bds
|
3
ba
|
2,508
sqft
|
built
2003
1247 Hunters Plane, San Antonio, TX 78245
$-307
Cash flow
-6.5%
Cash-on-Cash Return
4.2%
Cap rate
0.8%
Rent to Value Ratio
Active
$298,900
3
bds
|
3
ba
|
2,156
sqft
|
built
2008
327 Redbud Trce, San Antonio, TX 78245
$-713
Cash flow
-12.4%
Cash-on-Cash Return
2.8%
Cap rate
0.6%
Rent to Value Ratio

Active
$315,000
4
bds
|
2
ba
|
1,745
sqft
|
built
2022
1404 Pelagos Path, San Antonio, TX 78245
$-437
Cash flow
-7.2%
Cash-on-Cash Return
4.0%
Cap rate
0.7%
Rent to Value Ratio

Active
$292,000
3
bds
|
2
ba
|
1,876
sqft
|
built
2005
202 Willow Grove Dr, San Antonio, TX 78245
$-717
Cash flow
-12.8%
Cash-on-Cash Return
2.7%
Cap rate
0.6%
Rent to Value Ratio
Active
$299,500
3
bds
|
2
ba
|
1,859
sqft
|
built
2019
13026 Bunkhouse, San Antonio, TX 78245
$-459
Cash flow
-8.0%
Cash-on-Cash Return
3.8%
Cap rate
0.7%
Rent to Value Ratio

Active
$285,000
3
bds
|
3
ba
|
2,311
sqft
|
built
2006
10707 Axis Xing, San Antonio, TX 78245
$-466
Cash flow
-8.5%
Cash-on-Cash Return
3.7%
Cap rate
0.7%
Rent to Value Ratio
Active
$365,000
4
bds
|
2
ba
|
2,500
sqft
|
built
2006
1515 Agency Pt, San Antonio, TX 78245
$-921
Cash flow
-13.2%
Cash-on-Cash Return
2.6%
Cap rate
0.5%
Rent to Value Ratio
Active
$454,900
5
bds
|
3
ba
|
3,679
sqft
|
built
2010
15302 Round Pond Pl, San Antonio, TX 78245
$-933
Cash flow
-10.7%
Cash-on-Cash Return
3.2%
Cap rate
0.6%
Rent to Value Ratio

Active
$250,000
3
bds
|
2
ba
|
1,378
sqft
|
built
2010
9115 Everton, San Antonio, TX 78245
$-532
Cash flow
-11.1%
Cash-on-Cash Return
3.1%
Cap rate
0.6%
Rent to Value Ratio

Active
$245,000
3
bds
|
3
ba
|
1,909
sqft
|
built
2013
9858 Twinbear Crk, San Antonio, TX 78245
$-235
Cash flow
-5.0%
Cash-on-Cash Return
4.5%
Cap rate
0.7%
Rent to Value Ratio

Active
$239,900
3
bds
|
2
ba
|
1,299
sqft
|
built
2020
3407 Angus Xing, San Antonio, TX 78245
$-433
Cash flow
-9.4%
Cash-on-Cash Return
3.5%
Cap rate
0.7%
Rent to Value Ratio

Active
$380,000
5
bds
|
4
ba
|
2,695
sqft
|
built
2021
11454 Arabette, San Antonio, TX 78245
$-735
Cash flow
-10.1%
Cash-on-Cash Return
3.4%
Cap rate
0.7%
Rent to Value Ratio

Active
$374,900
4
bds
|
4
ba
|
2,737
sqft
|
built
2021
11711 Folsom Pass, San Antonio, TX 78245
$-724
Cash flow
-10.1%
Cash-on-Cash Return
3.4%
Cap rate
0.7%
Rent to Value Ratio

Active
$480,000
4
bds
|
4
ba
|
3,635
sqft
|
built
2014
12606 Ozona Rnch, San Antonio, TX 78245
$-1,134
Cash flow
-12.3%
Cash-on-Cash Return
2.8%
Cap rate
0.6%
Rent to Value Ratio

Active
$419,900
4
bds
|
3
ba
|
2,080
sqft
|
built
2023
2614 Suncadia Ln, San Antonio, TX 78245
$-746
Cash flow
-9.3%
Cash-on-Cash Return
3.5%
Cap rate
0.7%
Rent to Value Ratio

Active
$260,000
3
bds
|
3
ba
|
1,624
sqft
|
built
2014
10923 Bosal Trl, San Antonio, TX 78245
$-524
Cash flow
-10.5%
Cash-on-Cash Return
3.3%
Cap rate
0.7%
Rent to Value Ratio
Active
$269,999
3
bds
|
2
ba
|
2,176
sqft
|
built
1994
807 S Ellison Dr, San Antonio, TX 78245
$-539
Cash flow
-10.4%
Cash-on-Cash Return
3.3%
Cap rate
0.7%
Rent to Value Ratio

Active
$239,100
3
bds
|
2
ba
|
1,512
sqft
|
built
1985
11407 Tehama Ln, San Antonio, TX 78245
$-403
Cash flow
-8.8%
Cash-on-Cash Return
3.7%
Cap rate
0.7%
Rent to Value Ratio

Active
$489,900
3
bds
|
2
ba
|
2,228
sqft
|
built
2021
14314 Running Wolf, San Antonio, TX 78245
$-1,518
Cash flow
-16.2%
Cash-on-Cash Return
2.0%
Cap rate
0.5%
Rent to Value Ratio