80108 Investment Properties for Sale
Browse homes for sale and investment properties in 80108. Refine your search by price, property type, or more.
Best cash flowing properties in 80108
Active
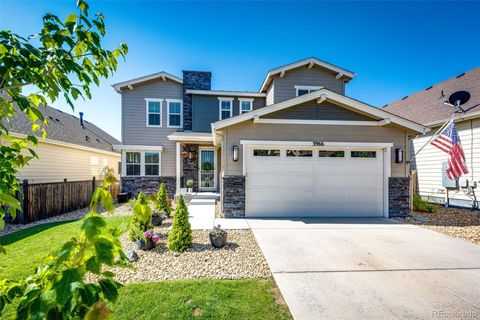
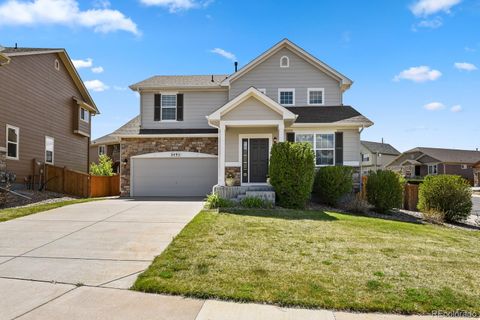
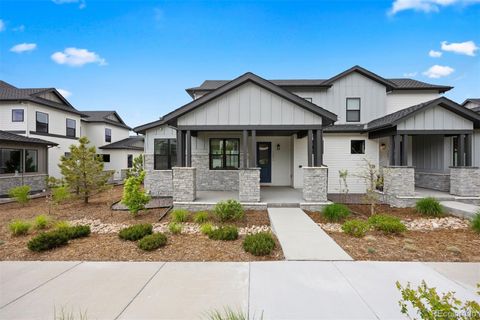
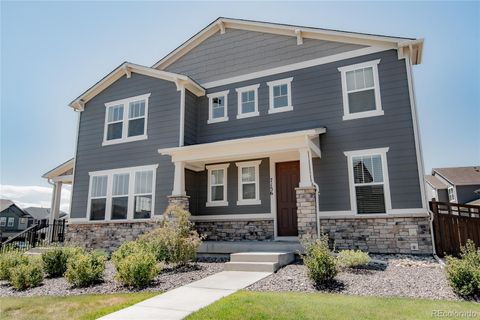
$644,999
4
bds
|
3
ba
|
2,256
sqft
|
built
2016
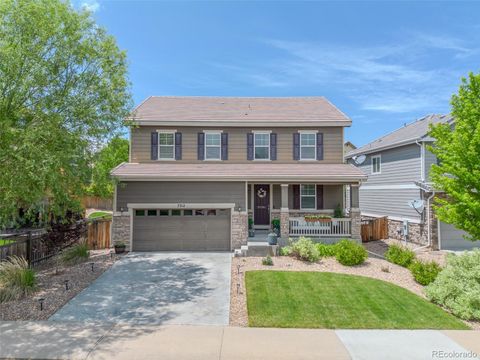
3966 Long Rifle Dr, Castle Rock, CO 80108
$-1,073
Cash flow
-8.7%
Cash-on-Cash Return
3.7%
Cap rate
0.5%
Rent to Value Ratio
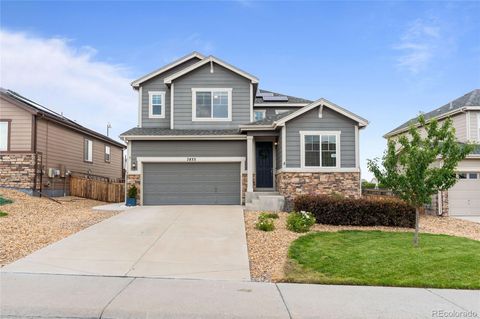
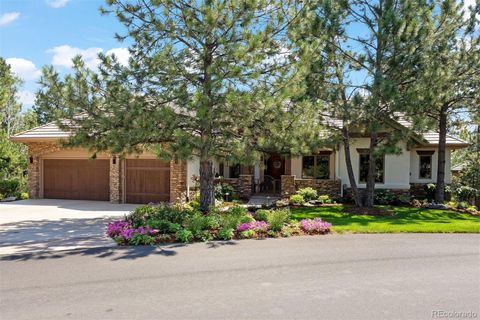
Active
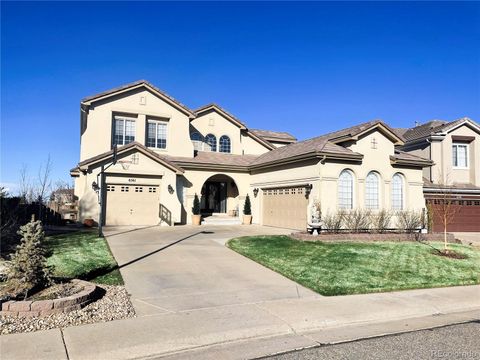
$615,000
4
bds
|
4
ba
|
2,683
sqft
|
built
2017
7833 Bandit Dr, Castle Rock, CO 80108
$-1,106
Cash flow
-9.4%
Cash-on-Cash Return
3.5%
Cap rate
0.6%
Rent to Value Ratio
164 out of 165 properties for sale in 80108
Limited Results Shown
Create a free account, or log in to reveal all property listings and enjoy the complete experience.
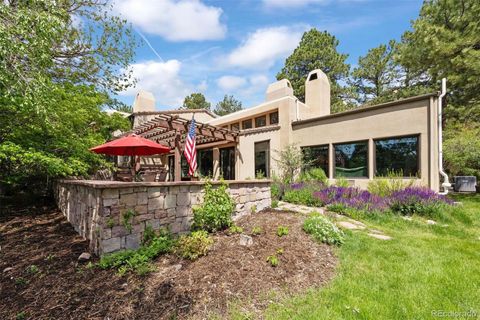
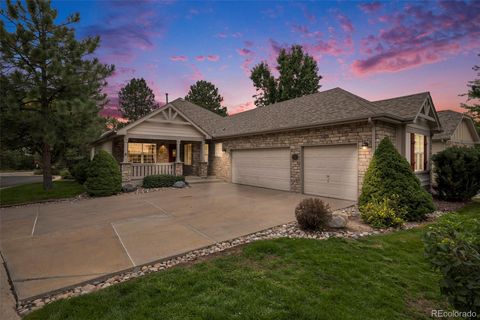
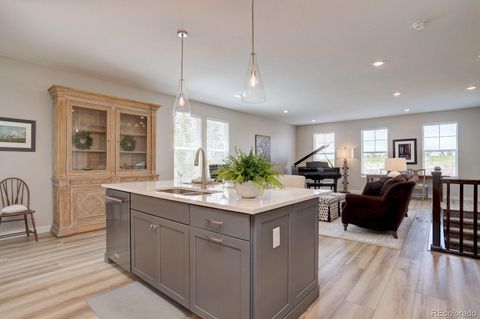
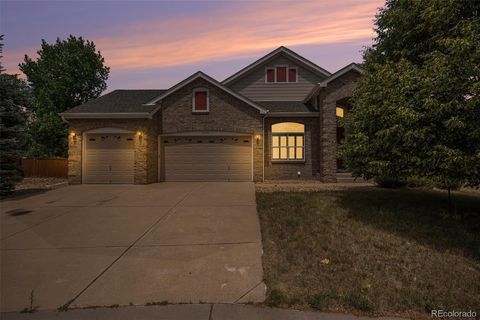
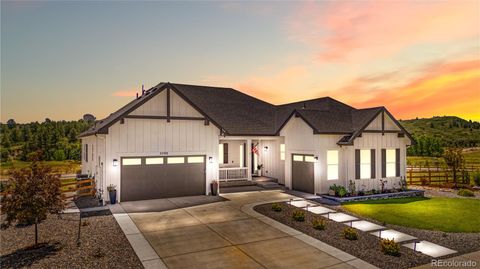
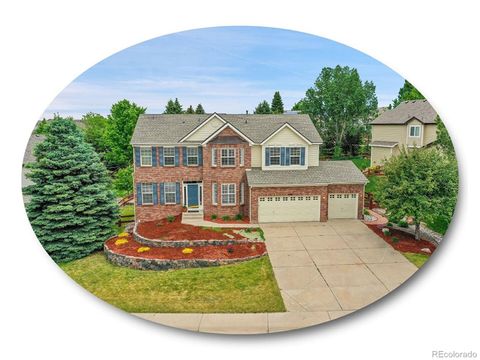
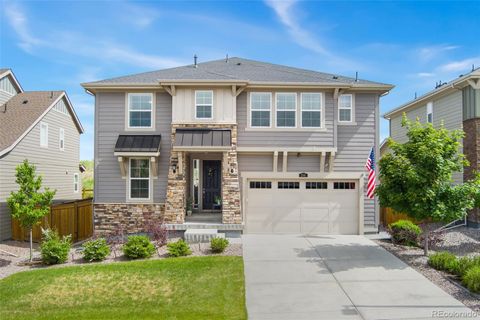
Active
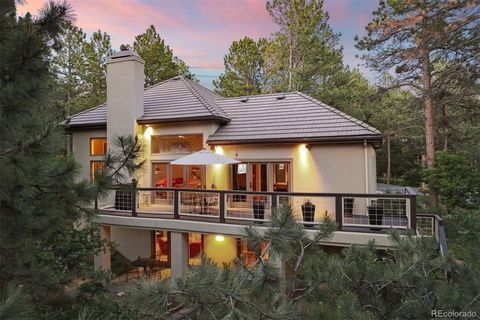
$975,000
3
bds
|
3
ba
|
3,017
sqft
|
built
1984
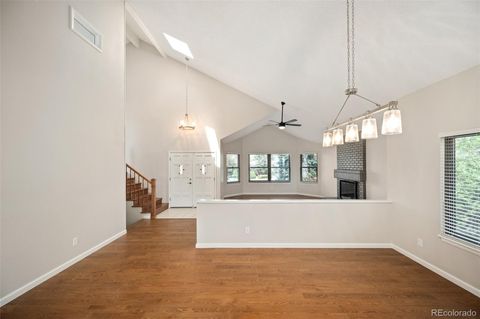
2107 Ridge Plaza Dr, Castle Rock, CO 80108
$-2,622
Cash flow
-14.0%
Cash-on-Cash Return
2.5%
Cap rate
0.5%
Rent to Value Ratio
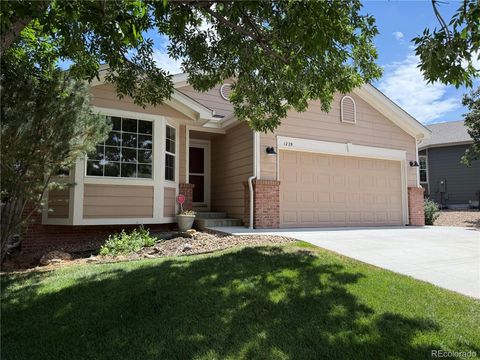
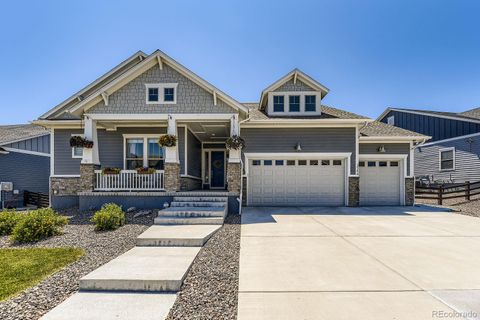
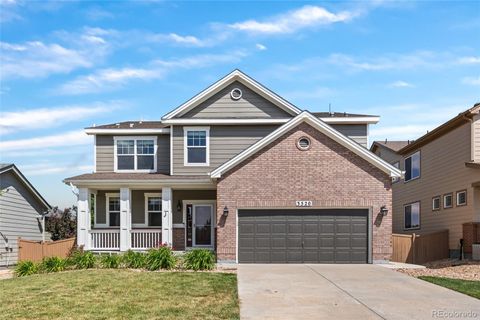
Active
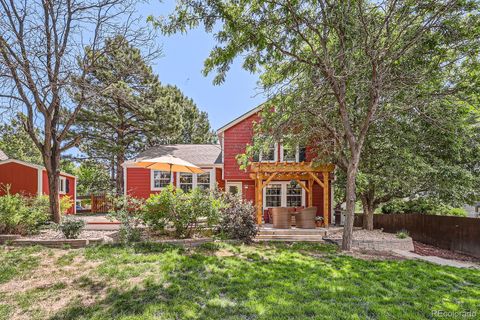
$744,900
5
bds
|
3
ba
|
2,940
sqft
|
built
2000
1229 Berganot Trl, Castle Pines, CO 80108
$-1,542
Cash flow
-10.8%
Cash-on-Cash Return
3.2%
Cap rate
0.5%
Rent to Value Ratio
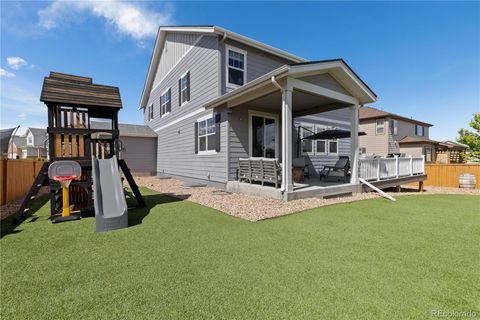
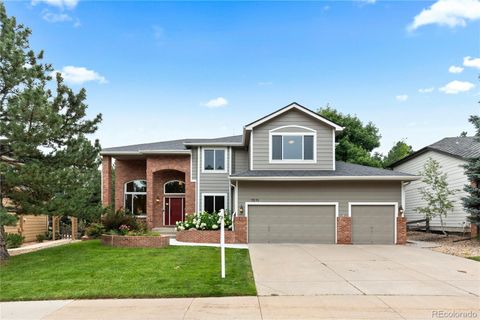
Active
$849,000
3
bds
|
3
ba
|
3,572
sqft
|
built
1998
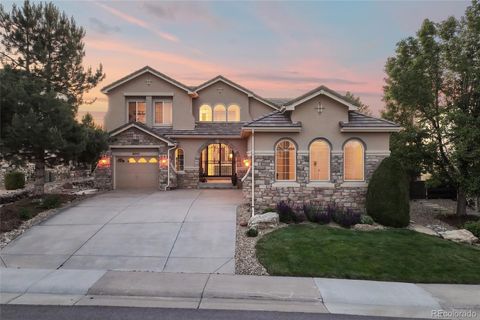
1405 Castlepoint Cir, Castle Pines, CO 80108
$-1,837
Cash flow
-11.3%
Cash-on-Cash Return
3.1%
Cap rate
0.5%
Rent to Value Ratio
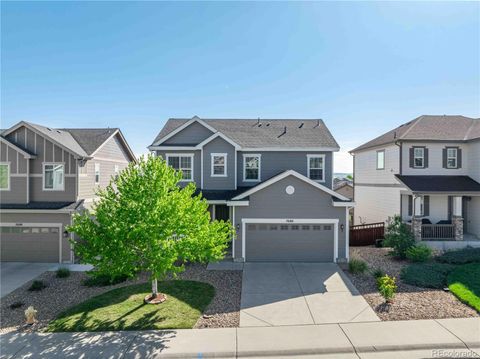
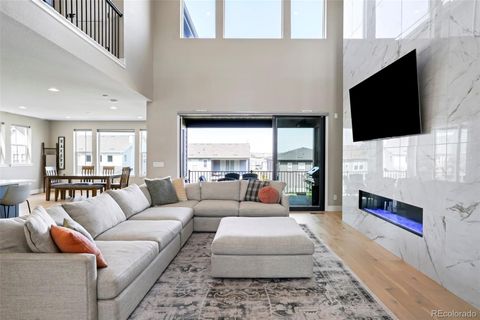
Active
$999,900
5
bds
|
5
ba
|
4,264
sqft
|
built
2022
3344 Carabiner St, Castle Rock, CO 80108
$-3,091
Cash flow
-16.1%
Cash-on-Cash Return
2.0%
Cap rate
0.4%
Rent to Value Ratio
Active
$749,900
4
bds
|
5
ba
|
3,909
sqft
|
built
2018
1315 Sidewinder Cir, Castle Rock, CO 80108
$-1,354
Cash flow
-9.4%
Cash-on-Cash Return
3.5%
Cap rate
0.5%
Rent to Value Ratio
Active
$589,950
3
bds
|
3
ba
|
2,230
sqft
|
built
2013
7686 Grady Cir, Castle Rock, CO 80108
$-1,183
Cash flow
-10.5%
Cash-on-Cash Return
3.3%
Cap rate
0.5%
Rent to Value Ratio
Active
$649,000
4
bds
|
4
ba
|
2,112
sqft
|
built
2013
3495 Amber Sun Cir, Castle Rock, CO 80108
$-1,351
Cash flow
-10.9%
Cash-on-Cash Return
3.2%
Cap rate
0.5%
Rent to Value Ratio
Active
$765,000
3
bds
|
3
ba
|
2,391
sqft
|
built
2021
1926 Sagerock Dr, Castle Pines, CO 80108
$-2,255
Cash flow
-15.4%
Cash-on-Cash Return
2.1%
Cap rate
0.4%
Rent to Value Ratio
Active
$1,479,000
3
bds
|
4
ba
|
4,002
sqft
|
built
1998
867 Homestake Ct, Castle Rock, CO 80108
$-5,317
Cash flow
-18.8%
Cash-on-Cash Return
1.4%
Cap rate
0.3%
Rent to Value Ratio
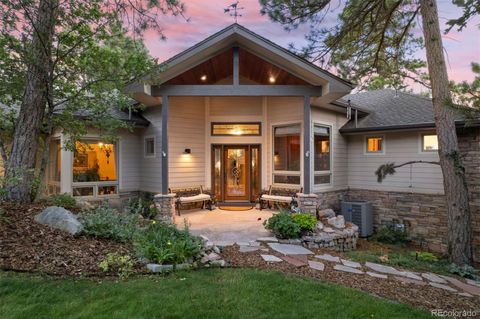
Active
$1,300,000
3
bds
|
3
ba
|
2,968
sqft
|
built
2020
5186 Copper Blush Ct, Castle Rock, CO 80108
$-3,896
Cash flow
-15.6%
Cash-on-Cash Return
2.1%
Cap rate
0.4%
Rent to Value Ratio
Active
$900,000
4
bds
|
4
ba
|
3,031
sqft
|
built
2018
4176 Spanish Oaks Trl, Castle Rock, CO 80108
$-2,186
Cash flow
-12.7%
Cash-on-Cash Return
2.8%
Cap rate
0.4%
Rent to Value Ratio
Active
$1,449,860
4
bds
|
5
ba
|
4,352
sqft
|
built
1996
15 Castle Pines Dr N, Castle Rock, CO 80108
$-4,403
Cash flow
-15.8%
Cash-on-Cash Return
2.0%
Cap rate
0.4%
Rent to Value Ratio
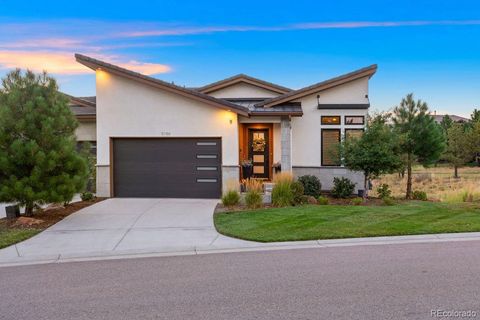
Active
$899,900
5
bds
|
4
ba
|
4,109
sqft
|
built
2024
3624 Rucksack Ct, Castle Rock, CO 80108
$-2,486
Cash flow
-14.4%
Cash-on-Cash Return
2.4%
Cap rate
0.3%
Rent to Value Ratio
Active
$4,750,000
6
bds
|
9
ba
|
10,043
sqft
|
built
2006
1072 Cypress Way, Castle Rock, CO 80108
$-21,395
Cash flow
-23.5%
Cash-on-Cash Return
0.3%
Cap rate
0.1%
Rent to Value Ratio
Active
$715,000
3
bds
|
2
ba
|
2,377
sqft
|
built
2006
7589 Iridium Ct, Castle Rock, CO 80108
$-1,460
Cash flow
-10.7%
Cash-on-Cash Return
3.2%
Cap rate
0.5%
Rent to Value Ratio
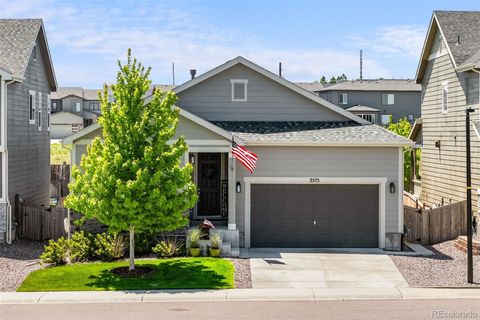
Active
$675,000
5
bds
|
3
ba
|
3,375
sqft
|
built
2020
3575 White Rose Loop, Castle Rock, CO 80108
$-1,404
Cash flow
-10.9%
Cash-on-Cash Return
3.2%
Cap rate
0.5%
Rent to Value Ratio
Active
$3,250,000
8
bds
|
9
ba
|
11,781
sqft
|
built
2003
8717 Ridgepoint Dr, Castle Pines, CO 80108
$-13,246
Cash flow
-21.3%
Cash-on-Cash Return
0.8%
Cap rate
0.2%
Rent to Value Ratio
Active
$1,100,000
4
bds
|
4
ba
|
3,091
sqft
|
built
2001
556 Rachael Pl, Castle Pines, CO 80108
$-2,737
Cash flow
-13.0%
Cash-on-Cash Return
2.7%
Cap rate
0.4%
Rent to Value Ratio
Active
$1,200,000
5
bds
|
4
ba
|
4,300
sqft
|
built
2004
6047 Vacquero Cir, Castle Pines, CO 80108
$-2,874
Cash flow
-12.5%
Cash-on-Cash Return
2.8%
Cap rate
0.4%
Rent to Value Ratio
Active
$1,190,000
5
bds
|
4
ba
|
3,569
sqft
|
built
1981
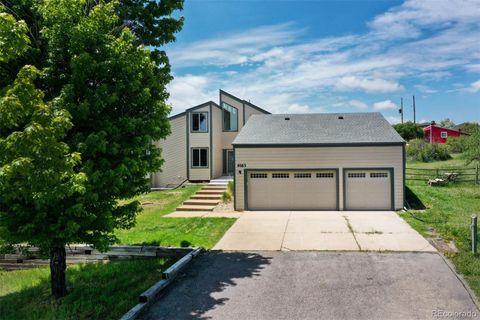
9163 N Palomino Dr, Castle Rock, CO 80108
$-3,399
Cash flow
-14.9%
Cash-on-Cash Return
2.3%
Cap rate
0.3%
Rent to Value Ratio
Active
$799,000
5
bds
|
3
ba
|
2,776
sqft
|
built
1985
18 Brixham Ct, Castle Pines, CO 80108
$-1,806
Cash flow
-11.8%
Cash-on-Cash Return
3.0%
Cap rate
0.5%
Rent to Value Ratio
Active
$670,000
4
bds
|
4
ba
|
2,571
sqft
|
built
2013
7312 Grady Cir, Castle Rock, CO 80108
$-1,550
Cash flow
-12.1%
Cash-on-Cash Return
2.9%
Cap rate
0.5%
Rent to Value Ratio
Active
$895,000
3
bds
|
4
ba
|
2,780
sqft
|
built
2021
7040 Homeplace St, Castle Rock, CO 80108
$-2,306
Cash flow
-13.4%
Cash-on-Cash Return
2.6%
Cap rate
0.5%
Rent to Value Ratio
Active
$2,659,000
4
bds
|
5
ba
|
5,370
sqft
|
built
2003
646 Ruby Trust Dr, Castle Rock, CO 80108
$-10,442
Cash flow
-20.5%
Cash-on-Cash Return
1.0%
Cap rate
0.2%
Rent to Value Ratio
Active
$1,575,000
5
bds
|
4
ba
|
5,415
sqft
|
built
2023
5598 Missoula Trl, Castle Rock, CO 80108
$-6,074
Cash flow
-20.1%
Cash-on-Cash Return
1.1%
Cap rate
0.2%
Rent to Value Ratio
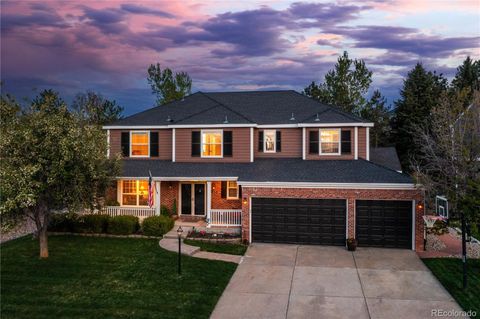
Active
$679,900
4
bds
|
3
ba
|
3,078
sqft
|
built
2012
3520 Desert Ridge Cir, Castle Rock, CO 80108
$-1,319
Cash flow
-10.1%
Cash-on-Cash Return
3.3%
Cap rate
0.5%
Rent to Value Ratio
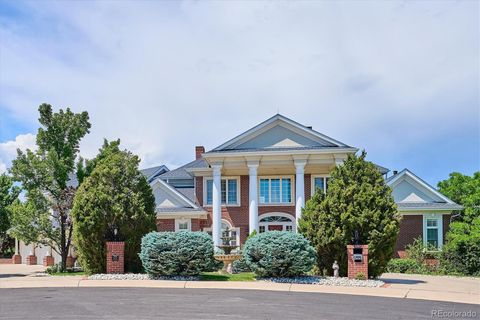
Active
$2,175,000
3
bds
|
3
ba
|
3,452
sqft
|
built
1999
3209 Country Club Pkwy, Castle Rock, CO 80108
$-8,606
Cash flow
-20.6%
Cash-on-Cash Return
0.9%
Cap rate
0.2%
Rent to Value Ratio
Active
$739,000
3
bds
|
2
ba
|
2,397
sqft
|
built
2005
7108 Sapphire Pointe Blvd, Castle Rock, CO 80108
$-1,812
Cash flow
-12.8%
Cash-on-Cash Return
2.7%
Cap rate
0.4%
Rent to Value Ratio
Active
$1,375,000
4
bds
|
5
ba
|
4,559
sqft
|
built
1994
811 Moffat Ct, Castle Rock, CO 80108
$-4,417
Cash flow
-16.8%
Cash-on-Cash Return
1.8%
Cap rate
0.4%
Rent to Value Ratio
Active
$1,124,000
4
bds
|
4
ba
|
3,766
sqft
|
built
2021
6656 Kenzie Cir, Castle Pines, CO 80108
$-2,549
Cash flow
-11.8%
Cash-on-Cash Return
3.0%
Cap rate
0.5%
Rent to Value Ratio
Active
$624,900
3
bds
|
3
ba
|
2,008
sqft
|
built
2021
7156 Bedlam Dr, Castle Pines, CO 80108
$-1,255
Cash flow
-10.5%
Cash-on-Cash Return
3.3%
Cap rate
0.6%
Rent to Value Ratio
Active
$1,060,000
3
bds
|
3
ba
|
2,887
sqft
|
built
2002
6561 Ocaso Dr, Castle Pines, CO 80108
$-2,584
Cash flow
-12.7%
Cash-on-Cash Return
2.8%
Cap rate
0.4%
Rent to Value Ratio
Active
$1,200,000
2
bds
|
3
ba
|
2,896
sqft
|
built
1992
474 Silbrico Way, Castle Rock, CO 80108
$-3,179
Cash flow
-13.8%
Cash-on-Cash Return
2.5%
Cap rate
0.4%
Rent to Value Ratio
Active
$715,000
4
bds
|
4
ba
|
2,378
sqft
|
built
1987
7445 Shoreham Pl, Castle Pines, CO 80108
$-1,282
Cash flow
-9.4%
Cash-on-Cash Return
3.5%
Cap rate
0.5%
Rent to Value Ratio
Active
$999,000
5
bds
|
4
ba
|
3,880
sqft
|
built
2000
8646 Fawnwood Dr, Castle Pines, CO 80108
$-2,264
Cash flow
-11.8%
Cash-on-Cash Return
3.0%
Cap rate
0.4%
Rent to Value Ratio
Active
$839,000
4
bds
|
4
ba
|
2,851
sqft
|
built
2018
154 Back Nine Dr, Castle Pines, CO 80108
$-1,913
Cash flow
-11.9%
Cash-on-Cash Return
2.9%
Cap rate
0.5%
Rent to Value Ratio
Active
$995,000
5
bds
|
4
ba
|
3,660
sqft
|
built
1998
7271 Brixham Cir, Castle Pines, CO 80108
$-2,286
Cash flow
-12.0%
Cash-on-Cash Return
2.9%
Cap rate
0.4%
Rent to Value Ratio
Active
$1,585,000
7
bds
|
7
ba
|
5,772
sqft
|
built
2022
6955 Sunstrand Ct, Castle Pines, CO 80108
$-2,769
Cash flow
-9.1%
Cash-on-Cash Return
3.6%
Cap rate
0.5%
Rent to Value Ratio