80221 Investment Properties for Sale
Browse homes for sale and investment properties in 80221. Refine your search by price, property type, or more.
Best cash flowing properties in 80221
Active
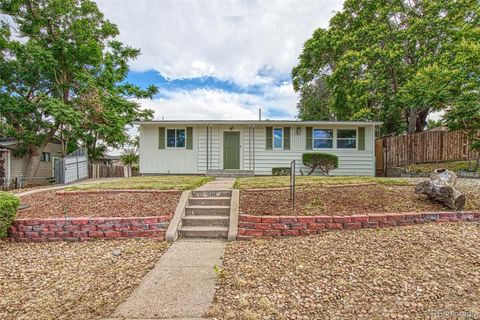
$369,000
3
bds
|
1
ba
|
984
sqft
|
built
1955
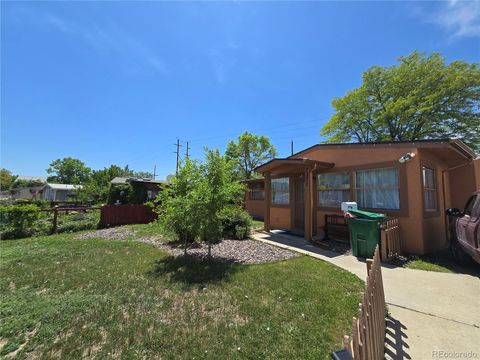
7371 Granada Rd, Denver, CO 80221
$-213
Cash flow
-3.0%
Cash-on-Cash Return
5.0%
Cap rate
0.7%
Rent to Value Ratio
Active
$175,000
1
bds
|
1
ba
|
730
sqft
|
built
1971
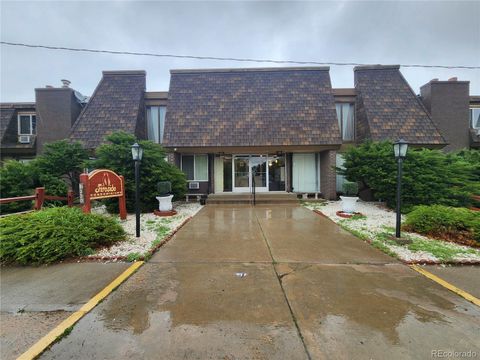
8330 Zuni St, Denver, CO 80221
$-273
Cash flow
-8.1%
Cash-on-Cash Return
3.8%
Cap rate
0.8%
Rent to Value Ratio
95 out of 97 properties for sale in 80221
Limited Results Shown
Create a free account, or log in to reveal all property listings and enjoy the complete experience.
Active
$485,000
5
bds
|
2
ba
|
2,431
sqft
|
built
1955
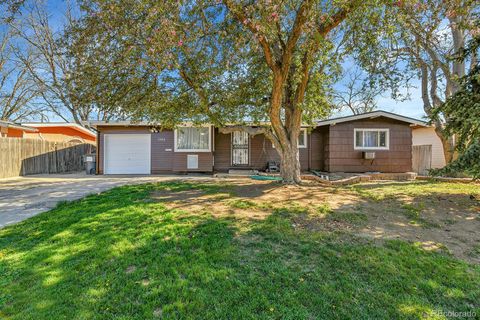
2580 Valley View Dr, Denver, CO 80221
$-622
Cash flow
-6.7%
Cash-on-Cash Return
4.1%
Cap rate
0.6%
Rent to Value Ratio

Active
$699,900
4
bds
|
3
ba
|
2,216
sqft
|
built
2013
1848 W 68th Ave, Denver, CO 80221
$-1,342
Cash flow
-10.0%
Cash-on-Cash Return
3.4%
Cap rate
0.6%
Rent to Value Ratio

Active
$449,000
4
bds
|
2
ba
|
1,878
sqft
|
built
1958
7172 Kalamath St, Denver, CO 80221
$-685
Cash flow
-8.0%
Cash-on-Cash Return
3.8%
Cap rate
0.6%
Rent to Value Ratio
Active
$319,900
2
bds
|
2
ba
|
936
sqft
|
built
2004
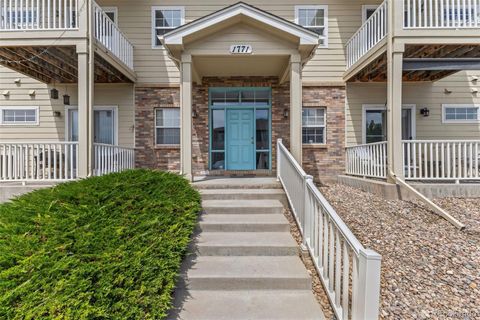
1771 W 53rd Pl, Denver, CO 80221
$-645
Cash flow
-10.5%
Cash-on-Cash Return
3.3%
Cap rate
0.6%
Rent to Value Ratio

Active
$374,950
2
bds
|
1
ba
|
801
sqft
|
built
2022
2876 W 53rd Ave, Denver, CO 80221
$-648
Cash flow
-9.0%
Cash-on-Cash Return
3.6%
Cap rate
0.6%
Rent to Value Ratio

Active
$500,000
3
bds
|
2
ba
|
1,152
sqft
|
built
1949
5515 Zuni St, Denver, CO 80221
$-702
Cash flow
-7.3%
Cash-on-Cash Return
4.0%
Cap rate
0.6%
Rent to Value Ratio

Active
$490,000
3
bds
|
2
ba
|
1,700
sqft
|
built
1956
7001 Alan Dr, Denver, CO 80221
$-886
Cash flow
-9.4%
Cash-on-Cash Return
3.5%
Cap rate
0.5%
Rent to Value Ratio
Active
$650,000
3
bds
|
4
ba
|
2,448
sqft
|
built
2003
2551 W 58th Ave, Denver, CO 80221
$-1,249
Cash flow
-10.0%
Cash-on-Cash Return
3.4%
Cap rate
0.5%
Rent to Value Ratio

Active
$499,000
2
bds
|
3
ba
|
1,568
sqft
|
built
2018
6757 Warren Dr, Denver, CO 80221
$-1,131
Cash flow
-11.8%
Cash-on-Cash Return
3.0%
Cap rate
0.5%
Rent to Value Ratio

Active
$545,000
4
bds
|
3
ba
|
2,552
sqft
|
built
1955
7898 Applewood Ln, Denver, CO 80221
$-930
Cash flow
-8.9%
Cash-on-Cash Return
3.6%
Cap rate
0.5%
Rent to Value Ratio

Active
$749,999
2
bds
|
3
ba
|
1,966
sqft
|
built
2015
4943 Lowell Blvd, Denver, CO 80221
$-1,462
Cash flow
-10.2%
Cash-on-Cash Return
3.3%
Cap rate
0.5%
Rent to Value Ratio
Active
$519,900
4
bds
|
2
ba
|
1,600
sqft
|
built
1956
7000 Avrum Dr, Denver, CO 80221
$-929
Cash flow
-9.3%
Cash-on-Cash Return
3.5%
Cap rate
0.5%
Rent to Value Ratio

Active
$739,000
3
bds
|
4
ba
|
3,340
sqft
|
built
2014
6753 Larsh Dr, Denver, CO 80221
$-1,855
Cash flow
-13.1%
Cash-on-Cash Return
2.7%
Cap rate
0.5%
Rent to Value Ratio

Active
$565,000
4
bds
|
4
ba
|
1,924
sqft
|
built
2020
1575 W 68th Ave, Denver, CO 80221
$-825
Cash flow
-7.6%
Cash-on-Cash Return
3.9%
Cap rate
0.6%
Rent to Value Ratio
Active
$735,000
4
bds
|
4
ba
|
3,495
sqft
|
built
2012
1622 W 67th Ave, Denver, CO 80221
$-1,845
Cash flow
-13.1%
Cash-on-Cash Return
2.7%
Cap rate
0.5%
Rent to Value Ratio
Active
$500,000
2
bds
|
1
ba
|
1,009
sqft
|
built
1922
4955 Julian St, Denver, CO 80221
$-632
Cash flow
-6.6%
Cash-on-Cash Return
4.2%
Cap rate
0.6%
Rent to Value Ratio
Active
$460,000
2
bds
|
2
ba
|
1,224
sqft
|
built
1986
5532 Umatilla St, Denver, CO 80221
$-838
Cash flow
-9.5%
Cash-on-Cash Return
3.5%
Cap rate
0.5%
Rent to Value Ratio

Active
$510,000
3
bds
|
2
ba
|
1,700
sqft
|
built
1955
7070 Warren Dr, Denver, CO 80221
$-751
Cash flow
-7.7%
Cash-on-Cash Return
3.9%
Cap rate
0.5%
Rent to Value Ratio

Active
$1,589,000
4
bds
|
4
ba
|
3,240
sqft
|
built
2019
4966 Knox Ct, Denver, CO 80221
$-3,374
Cash flow
-11.1%
Cash-on-Cash Return
3.1%
Cap rate
0.4%
Rent to Value Ratio

Active
$485,000
3
bds
|
2
ba
|
1,584
sqft
|
built
1955
2420 W 80th Ave, Denver, CO 80221
$-778
Cash flow
-8.4%
Cash-on-Cash Return
3.8%
Cap rate
0.5%
Rent to Value Ratio
Active
$475,000
4
bds
|
2
ba
|
1,800
sqft
|
built
1971
1285 Elder St, Denver, CO 80221
$-763
Cash flow
-8.4%
Cash-on-Cash Return
3.8%
Cap rate
0.5%
Rent to Value Ratio
Active
$457,900
4
bds
|
2
ba
|
1,700
sqft
|
built
1957
7669 Pecos St, Denver, CO 80221
$-314
Cash flow
-3.6%
Cash-on-Cash Return
4.9%
Cap rate
0.7%
Rent to Value Ratio
Active
$475,000
3
bds
|
2
ba
|
1,675
sqft
|
built
1956
7050 Alan Dr, Denver, CO 80221
$-533
Cash flow
-5.9%
Cash-on-Cash Return
4.3%
Cap rate
0.6%
Rent to Value Ratio

Active
$774,000
4
bds
|
4
ba
|
2,744
sqft
|
built
2013
1813 W 67th Ave, Denver, CO 80221
$-1,354
Cash flow
-9.1%
Cash-on-Cash Return
3.6%
Cap rate
0.6%
Rent to Value Ratio
Active
$399,800
2
bds
|
1
ba
|
809
sqft
|
built
2022
2876 W 53rd Ave, Denver, CO 80221
$-502
Cash flow
-6.6%
Cash-on-Cash Return
4.2%
Cap rate
0.6%
Rent to Value Ratio

Active
$715,000
4
bds
|
4
ba
|
2,954
sqft
|
built
2013
6735 Avrum Dr, Denver, CO 80221
$-1,312
Cash flow
-9.6%
Cash-on-Cash Return
3.5%
Cap rate
0.6%
Rent to Value Ratio
Active
$699,800
7
bds
|
5
ba
|
3,424
sqft
|
built
1918
3350 W 64th Ave, Westminster, CO 80221
$-2,104
Cash flow
-15.7%
Cash-on-Cash Return
2.1%
Cap rate
0.4%
Rent to Value Ratio
Active
$485,000
4
bds
|
2
ba
|
2,290
sqft
|
built
1957
7644 Wyandot St, Denver, CO 80221
$-889
Cash flow
-9.6%
Cash-on-Cash Return
3.5%
Cap rate
0.5%
Rent to Value Ratio
Active
$499,900
3
bds
|
2
ba
|
2,495
sqft
|
built
1958
1303 Lipan Dr, Denver, CO 80221
$-712
Cash flow
-7.4%
Cash-on-Cash Return
4.0%
Cap rate
0.6%
Rent to Value Ratio
Active
$430,000
3
bds
|
2
ba
|
1,171
sqft
|
built
1955
600 Bronco Rd, Denver, CO 80221
$-377
Cash flow
-4.6%
Cash-on-Cash Return
4.6%
Cap rate
0.6%
Rent to Value Ratio

Active
$499,000
4
bds
|
2
ba
|
1,336
sqft
|
built
1936
5260 Newton St, Denver, CO 80221
$-643
Cash flow
-6.7%
Cash-on-Cash Return
4.1%
Cap rate
0.6%
Rent to Value Ratio
Active
$485,000
4
bds
|
2
ba
|
1,992
sqft
|
built
1959
2612 Meadowbrook Dr, Denver, CO 80221
$-636
Cash flow
-6.8%
Cash-on-Cash Return
4.1%
Cap rate
0.6%
Rent to Value Ratio
Active
$424,900
4
bds
|
2
ba
|
1,700
sqft
|
built
1971
1325 Elder St, Denver, CO 80221
$-750
Cash flow
-9.2%
Cash-on-Cash Return
3.6%
Cap rate
0.5%
Rent to Value Ratio

Active
$375,000
2
bds
|
1
ba
|
624
sqft
|
built
1951
6736 Grove St, Denver, CO 80221
$-585
Cash flow
-8.1%
Cash-on-Cash Return
3.8%
Cap rate
0.5%
Rent to Value Ratio
Active
$506,000
4
bds
|
2
ba
|
2,060
sqft
|
built
1957
7820 Tejon St, Denver, CO 80221
$-780
Cash flow
-8.0%
Cash-on-Cash Return
3.8%
Cap rate
0.6%
Rent to Value Ratio
Active
$569,000
3
bds
|
2
ba
|
1,236
sqft
|
built
1942
4901 Bryant St, Denver, CO 80221
$-1,364
Cash flow
-12.5%
Cash-on-Cash Return
2.8%
Cap rate
0.4%
Rent to Value Ratio
Active
$695,000
2
bds
|
3
ba
|
1,407
sqft
|
built
2016
4922 Lowell Blvd, Denver, CO 80221
$-1,236
Cash flow
-9.3%
Cash-on-Cash Return
3.5%
Cap rate
0.5%
Rent to Value Ratio

Active
$599,900
5
bds
|
2
ba
|
2,016
sqft
|
built
1994
6550 Clay St, Denver, CO 80221
$-1,514
Cash flow
-13.2%
Cash-on-Cash Return
2.7%
Cap rate
0.4%
Rent to Value Ratio