80221 Investment Properties for Sale
Browse homes for sale and investment properties in 80221. Refine your search by price, property type, or more.
Best cash flowing properties in 80221
Active
$205,000
1
bds
|
1
ba
|
730
sqft
|
built
1971
8330 Zuni St, Denver, CO 80221
$-515
Cash flow
-13.1%
Cash-on-Cash Return
3.2%
Cap rate
0.7%
Rent to Value Ratio
Active
$375,000
2
bds
|
1
ba
|
624
sqft
|
built
1951
6736 Grove St, Denver, CO 80221
$-585
Cash flow
-8.1%
Cash-on-Cash Return
3.8%
Cap rate
0.5%
Rent to Value Ratio
135 out of 138 properties for sale in 80221
Limited Results Shown
Create a free account, or log in to reveal all property listings and enjoy the complete experience.
Active
$540,000
4
bds
|
2
ba
|
2,000
sqft
|
built
1960
8239 Nola Dr, Denver, CO 80221
$-1,086
Cash flow
-10.5%
Cash-on-Cash Return
3.3%
Cap rate
0.5%
Rent to Value Ratio
Active
$500,000
4
bds
|
2
ba
|
1,992
sqft
|
built
1959
2612 Meadowbrook Dr, Denver, CO 80221
$-707
Cash flow
-7.4%
Cash-on-Cash Return
4.0%
Cap rate
0.6%
Rent to Value Ratio
Active
$375,000
2
bds
|
1
ba
|
624
sqft
|
built
1951
6736 Grove St, Denver, CO 80221
$-585
Cash flow
-8.1%
Cash-on-Cash Return
3.8%
Cap rate
0.5%
Rent to Value Ratio
Active
$695,000
2
bds
|
0
ba
|
1,407
sqft
|
built
2016
4922 Lowell Blvd, Denver, CO 80221
$-1,575
Cash flow
-11.8%
Cash-on-Cash Return
3.5%
Cap rate
0.5%
Rent to Value Ratio
Active
$649,950
4
bds
|
3
ba
|
2,138
sqft
|
built
2018
7888 Tejon St, Denver, CO 80221
$-1,913
Cash flow
-15.4%
Cash-on-Cash Return
2.7%
Cap rate
0.4%
Rent to Value Ratio
Active
$630,000
4
bds
|
4
ba
|
2,082
sqft
|
built
2021
6791 Navajo Ct, Denver, CO 80221
$-1,908
Cash flow
-15.8%
Cash-on-Cash Return
2.6%
Cap rate
0.4%
Rent to Value Ratio
Active
$499,000
2
bds
|
3
ba
|
1,348
sqft
|
built
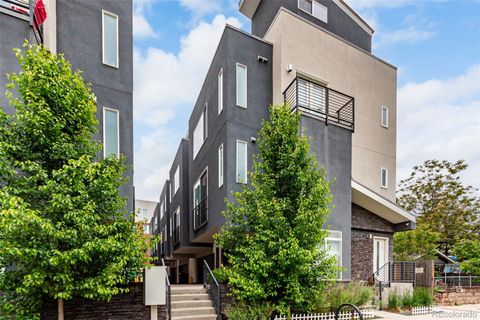
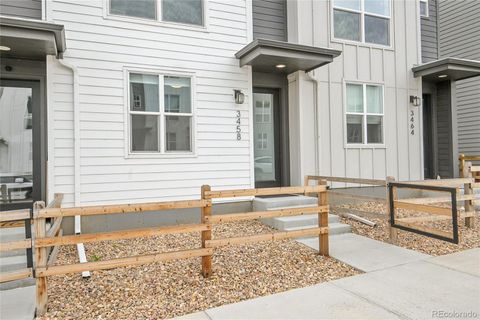
2022
3458 W 63rd Ave, Denver, CO 80221
$-996
Cash flow
-10.4%
Cash-on-Cash Return
3.9%
Cap rate
0.6%
Rent to Value Ratio
Active
$424,900
3
bds
|
1
ba
|
984
sqft
|
built
1955
741 Cortez St, Denver, CO 80221
$-689
Cash flow
-8.5%
Cash-on-Cash Return
4.3%
Cap rate
0.6%
Rent to Value Ratio
Active
$585,000
5
bds
|
2
ba
|
2,092
sqft
|
built
1956
7799 Pecos St, Denver, CO 80221
$-1,319
Cash flow
-11.8%
Cash-on-Cash Return
3.6%
Cap rate
0.5%
Rent to Value Ratio
Active
$580,000
4
bds
|
2
ba
|
1,822
sqft
|
built
1948
2196 W 56th Ave, Denver, CO 80221
$-1,126
Cash flow
-10.1%
Cash-on-Cash Return
3.9%
Cap rate
0.6%
Rent to Value Ratio
Active
$685,000
3
bds
|
2
ba
|
1,357
sqft
|
built
1949
5125 Umatilla St, Denver, CO 80221
$-1,495
Cash flow
-11.4%
Cash-on-Cash Return
3.6%
Cap rate
0.5%
Rent to Value Ratio
Active
$380,000
2
bds
|
1
ba
|
756
sqft
|
built
1950
6691 Hooker St, Denver, CO 80221
$-805
Cash flow
-11.1%
Cash-on-Cash Return
3.7%
Cap rate
0.5%
Rent to Value Ratio
Active
$825,000
4
bds
|
4
ba
|
3,082
sqft
|
built
2016
6619 Mariposa Ct, Denver, CO 80221
$-2,265
Cash flow
-14.3%
Cash-on-Cash Return
3.0%
Cap rate
0.5%
Rent to Value Ratio
Active
$219,900
2
bds
|
1
ba
|
800
sqft
|
built
1971
8330 Zuni St, Denver, CO 80221
$-629
Cash flow
-14.9%
Cash-on-Cash Return
2.8%
Cap rate
0.6%
Rent to Value Ratio
Active
$850,000
4
bds
|
4
ba
|
3,082
sqft
|
built
2013
6747 Raritan Dr, Denver, CO 80221
$-2,322
Cash flow
-14.3%
Cash-on-Cash Return
3.0%
Cap rate
0.5%
Rent to Value Ratio
Active
$514,000
3
bds
|
2
ba
|
974
sqft
|
built
1941
5100 Clay St, Denver, CO 80221
$-954
Cash flow
-9.7%
Cash-on-Cash Return
4.0%
Cap rate
0.5%
Rent to Value Ratio
Active
$440,000
2
bds
|
1
ba
|
723
sqft
|
built
1947
1730 W 51st Ave, Denver, CO 80221
$-755
Cash flow
-9.0%
Cash-on-Cash Return
4.2%
Cap rate
0.6%
Rent to Value Ratio
Active
$539,900
4
bds
|
2
ba
|
1,700
sqft
|
built
1956
7020 Avrum Dr, Denver, CO 80221
$-1,292
Cash flow
-12.5%
Cash-on-Cash Return
3.4%
Cap rate
0.5%
Rent to Value Ratio
Active
$525,000
4
bds
|
2
ba
|
850
sqft
|
built
1958
7126 Joan St, Denver, CO 80221
$-1,466
Cash flow
-14.6%
Cash-on-Cash Return
2.9%
Cap rate
0.4%
Rent to Value Ratio
Active
$509,900
3
bds
|
2
ba
|
1,573
sqft
|
built
1955
7081 Warren Dr, Denver, CO 80221
$-1,013
Cash flow
-10.4%
Cash-on-Cash Return
3.9%
Cap rate
0.5%
Rent to Value Ratio
Active
$490,000
4
bds
|
2
ba
|
1,900
sqft
|
built
1964
8353 Adams Way, Denver, CO 80221
$-855
Cash flow
-9.1%
Cash-on-Cash Return
4.2%
Cap rate
0.6%
Rent to Value Ratio
Active
$1,000,000
3
bds
|
2
ba
|
1,620
sqft
|
built
2016
3440 W 66th Ave, Denver, CO 80221
$-3,901
Cash flow
-20.4%
Cash-on-Cash Return
1.6%
Cap rate
0.2%
Rent to Value Ratio
Active
$430,000
3
bds
|
2
ba
|
1,650
sqft
|
built
1956
7251 Larsh Dr, Denver, CO 80221
$-846
Cash flow
-10.3%
Cash-on-Cash Return
3.9%
Cap rate
0.5%
Rent to Value Ratio
Active
$490,000
3
bds
|
2
ba
|
1,552
sqft
|
built
1957
7875 Cyd Dr, Denver, CO 80221
$-909
Cash flow
-9.7%
Cash-on-Cash Return
4.0%
Cap rate
0.6%
Rent to Value Ratio
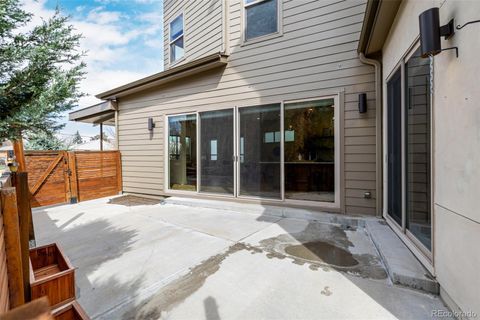
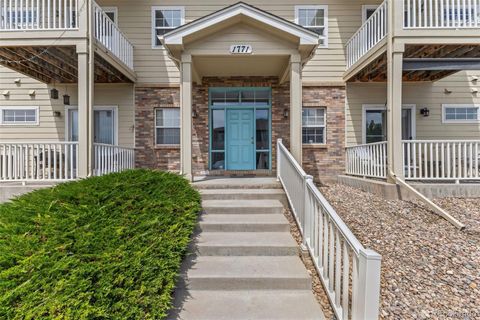
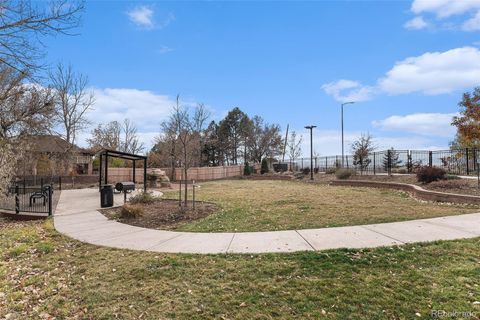
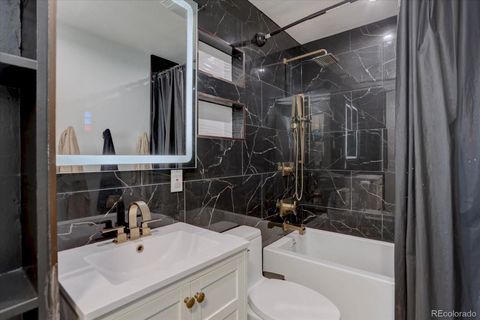
Active
$334,000
2
bds
|
2
ba
|
936
sqft
|
built
2004
1771 W 53rd Pl, Denver, CO 80221
$-893
Cash flow
-13.9%
Cash-on-Cash Return
3.1%
Cap rate
0.6%
Rent to Value Ratio
Active
$534,900
5
bds
|
2
ba
|
2,241
sqft
|
built
1955
7170 Zuni St, Denver, CO 80221
$-858
Cash flow
-8.4%
Cash-on-Cash Return
4.3%
Cap rate
0.6%
Rent to Value Ratio
Active
$430,000
4
bds
|
2
ba
|
1,850
sqft
|
built
1971
7845 Conifer Rd, Denver, CO 80221
$-697
Cash flow
-8.5%
Cash-on-Cash Return
4.3%
Cap rate
0.6%
Rent to Value Ratio
Active
$709,000
4
bds
|
3
ba
|
2,216
sqft
|
built
2013
1848 W 68th Ave, Denver, CO 80221
$-1,732
Cash flow
-12.7%
Cash-on-Cash Return
3.3%
Cap rate
0.6%
Rent to Value Ratio

Active
$459,000
4
bds
|
2
ba
|
1,878
sqft
|
built
1958
7172 Kalamath St, Denver, CO 80221
$-956
Cash flow
-10.9%
Cash-on-Cash Return
3.8%
Cap rate
0.5%
Rent to Value Ratio
Active
$335,000
2
bds
|
2
ba
|
936
sqft
|
built
2004
1771 W 53rd Pl, Denver, CO 80221
$-880
Cash flow
-13.7%
Cash-on-Cash Return
3.1%
Cap rate
0.6%
Rent to Value Ratio
Active
$675,000
3
bds
|
3
ba
|
2,000
sqft
|
built
2021
3580 W 62nd Ave, Denver, CO 80221
$-1,595
Cash flow
-12.3%
Cash-on-Cash Return
3.4%
Cap rate
0.6%
Rent to Value Ratio
Active
$513,000
4
bds
|
2
ba
|
1,960
sqft
|
built
1962
1641 Orchard Dr, Denver, CO 80221
$-1,015
Cash flow
-10.3%
Cash-on-Cash Return
3.9%
Cap rate
0.5%
Rent to Value Ratio
Active
$675,000
3
bds
|
4
ba
|
2,448
sqft
|
built
2003
2551 W 58th Ave, Denver, CO 80221
$-1,697
Cash flow
-13.1%
Cash-on-Cash Return
3.2%
Cap rate
0.5%
Rent to Value Ratio
Active
$539,900
4
bds
|
2
ba
|
1,665
sqft
|
built
1969
7609 Sherman Pl, Denver, CO 80221
$-816
Cash flow
-7.9%
Cash-on-Cash Return
4.5%
Cap rate
0.6%
Rent to Value Ratio
Active
$889,990
6
bds
|
6
ba
|
3,406
sqft
|
built
2013
6715 Raritan Dr, Denver, CO 80221
$-2,929
Cash flow
-17.2%
Cash-on-Cash Return
2.3%
Cap rate
0.4%
Rent to Value Ratio
Active
$205,000
1
bds
|
1
ba
|
730
sqft
|
built
1971
8330 Zuni St, Denver, CO 80221
$-515
Cash flow
-13.1%
Cash-on-Cash Return
3.2%
Cap rate
0.7%
Rent to Value Ratio
Active
$600,000
3
bds
|
2
ba
|
1,152
sqft
|
built
1949
5515 Zuni St, Denver, CO 80221
$-1,468
Cash flow
-12.8%
Cash-on-Cash Return
3.3%
Cap rate
0.5%
Rent to Value Ratio
Active
$505,000
5
bds
|
2
ba
|
2,431
sqft
|
built
1955
2580 Valley View Dr, Denver, CO 80221
$-963
Cash flow
-9.9%
Cash-on-Cash Return
4.0%
Cap rate
0.6%
Rent to Value Ratio
Active
$575,000
3
bds
|
2
ba
|
1,699
sqft
|
built
1949
4921 Beach Ct, Denver, CO 80221
$-1,128
Cash flow
-10.2%
Cash-on-Cash Return
3.9%
Cap rate
0.5%
Rent to Value Ratio
Active
$639,900
4
bds
|
2
ba
|
2,599
sqft
|
built
1951
3501 W 53rd Ave, Denver, CO 80221
$-1,276
Cash flow
-10.4%
Cash-on-Cash Return
3.9%
Cap rate
0.6%
Rent to Value Ratio