80221 Investment Properties for Sale
Browse homes for sale and investment properties in 80221. Refine your search by price, property type, or more.
Best cash flowing properties in 80221
Active
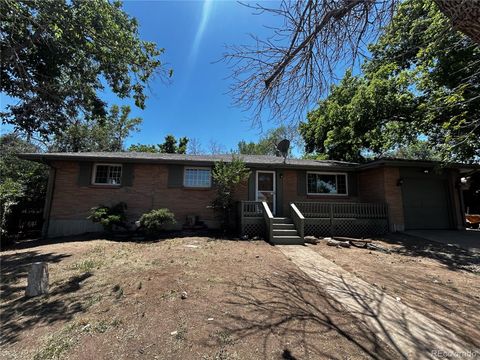
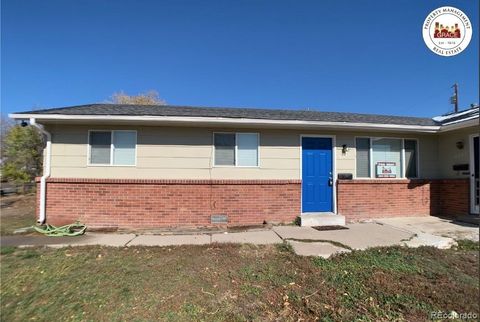
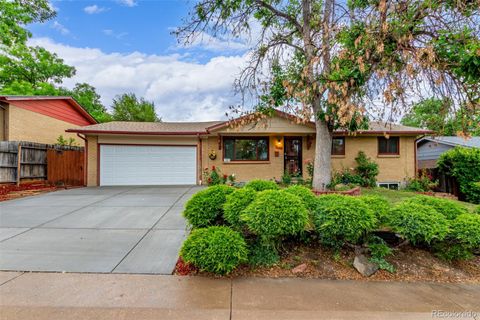
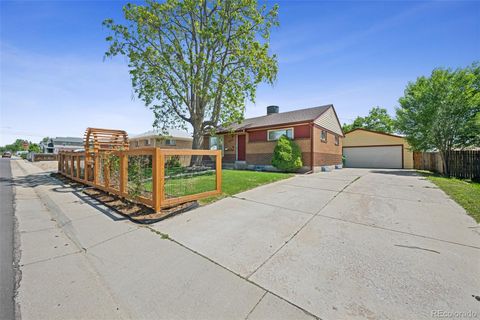
$375,000
6
bds
|
2
ba
|
2,012
sqft
|
built
1960
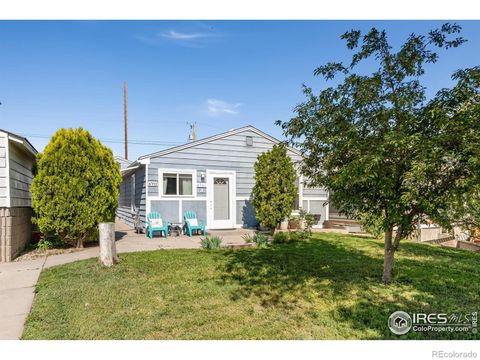
8319 Quivas Way, Denver, CO 80221
$-507
Cash flow
-7.1%
Cash-on-Cash Return
4.6%
Cap rate
0.7%
Rent to Value Ratio
Active
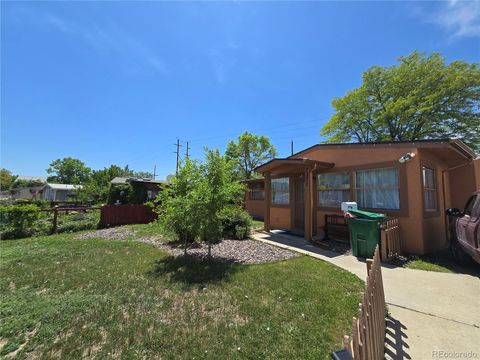
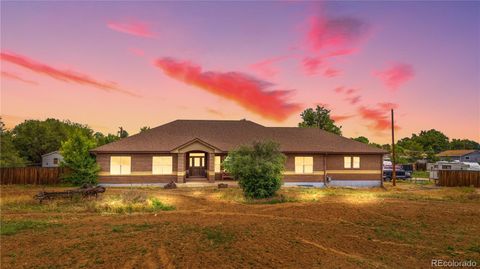
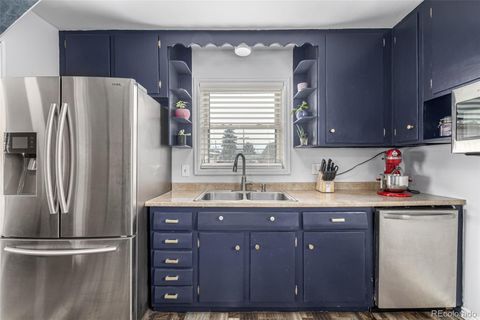
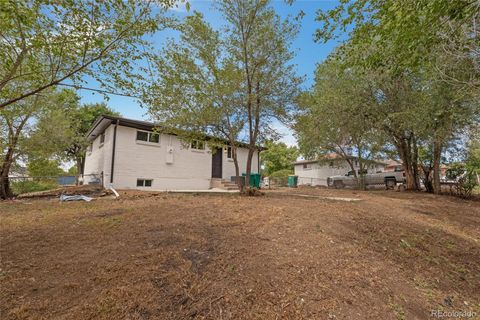
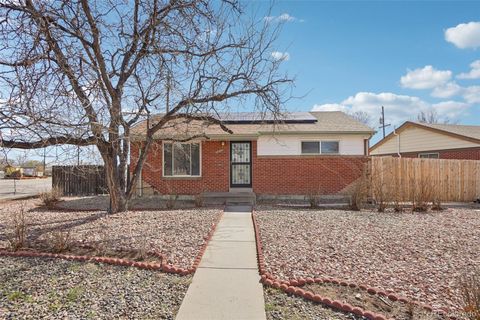
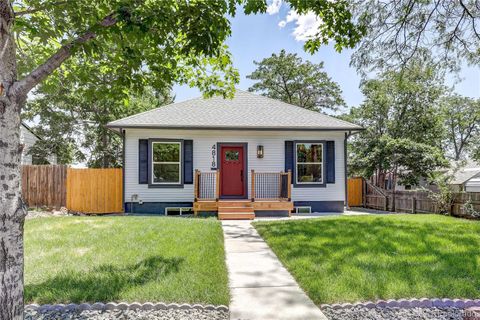
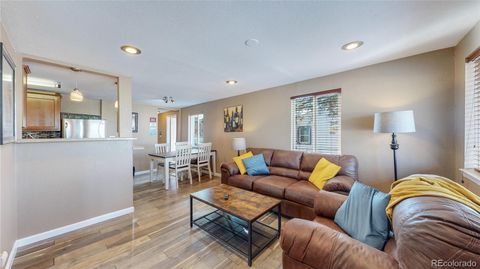
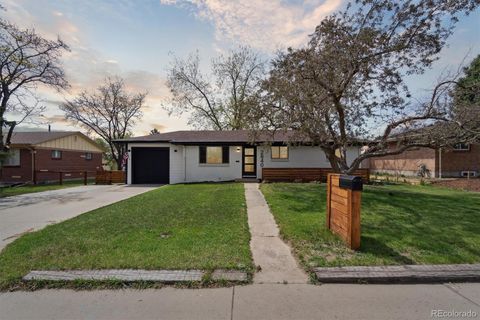
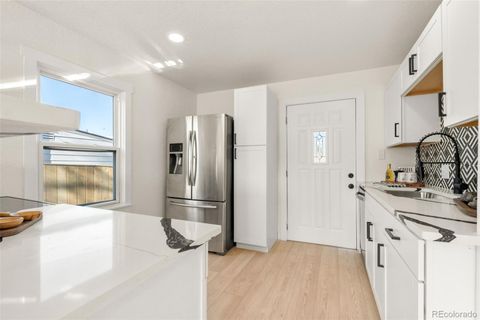
$395,000
3
bds
|
1
ba
|
984
sqft
|
built
1955
7371 Granada Rd, Denver, CO 80221
$-529
Cash flow
-7.0%
Cash-on-Cash Return
4.7%
Cap rate
0.6%
Rent to Value Ratio
135 out of 138 properties for sale in 80221
Limited Results Shown
Create a free account, or log in to reveal all property listings and enjoy the complete experience.
Active
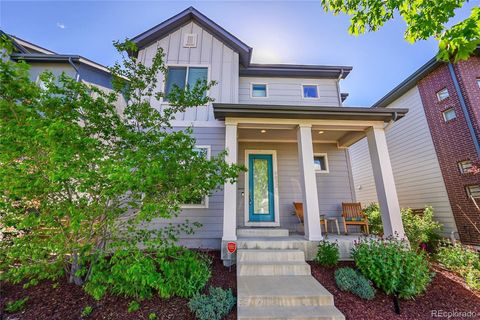
$640,000
4
bds
|
4
ba
|
2,335
sqft
|
built
2020
6700 Clay St, Denver, CO 80221
$-2,046
Cash flow
-16.7%
Cash-on-Cash Return
2.4%
Cap rate
0.5%
Rent to Value Ratio
Active
$699,900
4
bds
|
4
ba
|
2,794
sqft
|
built
2014
1857 W 67th Pl, Denver, CO 80221
$-2,144
Cash flow
-16.0%
Cash-on-Cash Return
2.6%
Cap rate
0.5%
Rent to Value Ratio
Active
$548,000
5
bds
|
2
ba
|
1,736
sqft
|
built
1972
6600 Knox Ct, Denver, CO 80221
$-1,639
Cash flow
-15.6%
Cash-on-Cash Return
2.7%
Cap rate
0.4%
Rent to Value Ratio
Active
$1,299,950
5
bds
|
4
ba
|
3,596
sqft
|
built
2008
1195 W 70th Ave, Denver, CO 80221
$-5,007
Cash flow
-20.1%
Cash-on-Cash Return
1.6%
Cap rate
0.3%
Rent to Value Ratio
Active
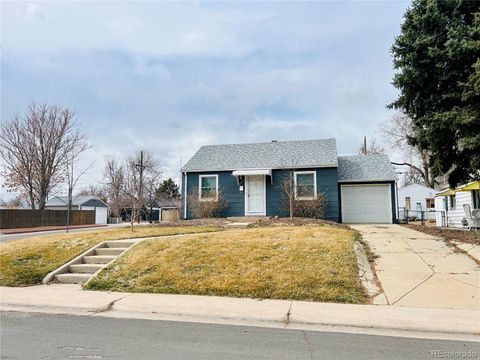
$469,999
3
bds
|
2
ba
|
1,615
sqft
|
built
1956
7296 Quivas St, Denver, CO 80221
$-713
Cash flow
-7.9%
Cash-on-Cash Return
4.4%
Cap rate
0.6%
Rent to Value Ratio
Active
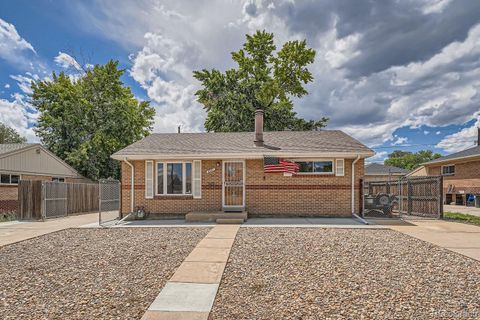
$475,000
3
bds
|
2
ba
|
1,650
sqft
|
built
1959
7946 Joan Dr, Denver, CO 80221
$-686
Cash flow
-7.5%
Cash-on-Cash Return
4.5%
Cap rate
0.6%
Rent to Value Ratio
Active
$550,000
5
bds
|
2
ba
|
1,924
sqft
|
built
1961
6743 King St, Denver, CO 80221
$-1,632
Cash flow
-15.5%
Cash-on-Cash Return
2.7%
Cap rate
0.4%
Rent to Value Ratio
Active
$750,000
3
bds
|
3
ba
|
2,029
sqft
|
built
2016
6632 Osage St, Denver, CO 80221
$-2,103
Cash flow
-14.6%
Cash-on-Cash Return
2.9%
Cap rate
0.5%
Rent to Value Ratio
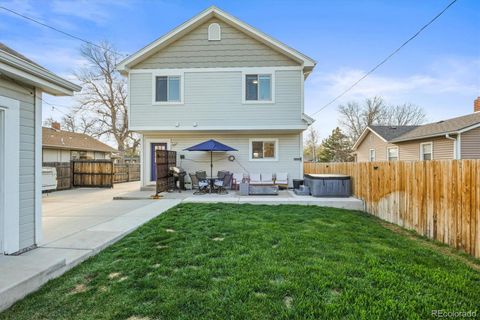
Active
$375,000
6
bds
|
2
ba
|
2,012
sqft
|
built
1960
8319 Quivas Way, Denver, CO 80221
$-507
Cash flow
-7.1%
Cash-on-Cash Return
4.6%
Cap rate
0.7%
Rent to Value Ratio
Active
$419,900
2
bds
|
1
ba
|
719
sqft
|
built
1947
1701 W 50th Ave, Denver, CO 80221
$-652
Cash flow
-8.1%
Cash-on-Cash Return
4.4%
Cap rate
0.6%
Rent to Value Ratio
Active
$444,000
2
bds
|
2
ba
|
1,275
sqft
|
built
1955
7180 Zuni St, Denver, CO 80221
$-848
Cash flow
-10.0%
Cash-on-Cash Return
4.0%
Cap rate
0.6%
Rent to Value Ratio
Active
$790,000
4
bds
|
4
ba
|
2,744
sqft
|
built
2013
1813 W 67th Ave, Denver, CO 80221
$-1,812
Cash flow
-12.0%
Cash-on-Cash Return
3.5%
Cap rate
0.6%
Rent to Value Ratio
Active
$699,800
7
bds
|
5
ba
|
3,424
sqft
|
built
1918
3350 W 64th Ave, Westminster, CO 80221
$-2,445
Cash flow
-18.2%
Cash-on-Cash Return
2.1%
Cap rate
0.4%
Rent to Value Ratio
Active
$615,000
3
bds
|
2
ba
|
1,341
sqft
|
built
1924
4933 Grove St, Denver, CO 80221
$-1,310
Cash flow
-11.1%
Cash-on-Cash Return
3.7%
Cap rate
0.5%
Rent to Value Ratio

Active
$624,900
3
bds
|
4
ba
|
2,016
sqft
|
built
2018
1419 W 67th Ave, Denver, CO 80221
$-1,894
Cash flow
-15.8%
Cash-on-Cash Return
2.6%
Cap rate
0.5%
Rent to Value Ratio
Active
$399,800
2
bds
|
1
ba
|
809
sqft
|
built
2022
2876 W 53rd Ave, Denver, CO 80221
$-697
Cash flow
-9.1%
Cash-on-Cash Return
4.2%
Cap rate
0.6%
Rent to Value Ratio

Active
$735,000
4
bds
|
4
ba
|
2,954
sqft
|
built
2013
6735 Avrum Dr, Denver, CO 80221
$-1,765
Cash flow
-12.5%
Cash-on-Cash Return
3.4%
Cap rate
0.5%
Rent to Value Ratio

Active
$855,000
6
bds
|
3
ba
|
3,327
sqft
|
built
1927
3246 W 53rd Ave, Denver, CO 80221
$-2,517
Cash flow
-15.4%
Cash-on-Cash Return
2.7%
Cap rate
0.4%
Rent to Value Ratio
Active
$1,100,000
5
bds
|
4
ba
|
2,569
sqft
|
built
2018
4942 Grove St, Denver, CO 80221
$-3,441
Cash flow
-16.3%
Cash-on-Cash Return
2.5%
Cap rate
0.4%
Rent to Value Ratio
Active
$465,000
4
bds
|
2
ba
|
1,700
sqft
|
built
1957
7669 Pecos St, Denver, CO 80221
$-575
Cash flow
-6.5%
Cash-on-Cash Return
4.8%
Cap rate
0.7%
Rent to Value Ratio
Active
$550,000
4
bds
|
4
ba
|
2,278
sqft
|
built
2019
6771 Canosa St, Denver, CO 80221
$-1,391
Cash flow
-13.2%
Cash-on-Cash Return
3.2%
Cap rate
0.6%
Rent to Value Ratio
Active
$524,000
4
bds
|
2
ba
|
2,290
sqft
|
built
1957
7644 Wyandot St, Denver, CO 80221
$-1,330
Cash flow
-13.2%
Cash-on-Cash Return
3.2%
Cap rate
0.4%
Rent to Value Ratio

Active
$434,900
2
bds
|
1
ba
|
620
sqft
|
built
1942
3040 W 66th Ave, Denver, CO 80221
$-698
Cash flow
-8.4%
Cash-on-Cash Return
4.3%
Cap rate
0.6%
Rent to Value Ratio
Active
$475,000
4
bds
|
2
ba
|
1,800
sqft
|
built
1971
1285 Elder St, Denver, CO 80221
$-763
Cash flow
-8.4%
Cash-on-Cash Return
3.8%
Cap rate
0.5%
Rent to Value Ratio
Active
$649,800
3
bds
|
2
ba
|
1,870
sqft
|
built
1940
4818 Bryant St, Denver, CO 80221
$-1,488
Cash flow
-11.9%
Cash-on-Cash Return
2.9%
Cap rate
0.4%
Rent to Value Ratio
Active
$569,000
3
bds
|
2
ba
|
1,236
sqft
|
built
1942
4901 Bryant St, Denver, CO 80221
$-1,642
Cash flow
-15.1%
Cash-on-Cash Return
2.8%
Cap rate
0.4%
Rent to Value Ratio
Active
$479,900
3
bds
|
2
ba
|
1,671
sqft
|
built
1955
6991 Warren Dr, Denver, CO 80221
$-849
Cash flow
-9.2%
Cash-on-Cash Return
4.1%
Cap rate
0.6%
Rent to Value Ratio
Active
$519,000
4
bds
|
2
ba
|
2,060
sqft
|
built
1957
7820 Tejon St, Denver, CO 80221
$-1,095
Cash flow
-11.0%
Cash-on-Cash Return
3.7%
Cap rate
0.5%
Rent to Value Ratio
Active
$494,900
3
bds
|
2
ba
|
1,110
sqft
|
built
1948
3282 W 66th Ave, Denver, CO 80221
$-1,095
Cash flow
-11.5%
Cash-on-Cash Return
3.6%
Cap rate
0.5%
Rent to Value Ratio
Active
$539,999
5
bds
|
3
ba
|
1,000
sqft
|
built
1959
2840 Cottonwood Dr, Denver, CO 80221
$-1,398
Cash flow
-13.5%
Cash-on-Cash Return
3.2%
Cap rate
0.4%
Rent to Value Ratio
Active
$450,000
2
bds
|
2
ba
|
1,052
sqft
|
built
1947
4822 Bryant St, Denver, CO 80221
$-566
Cash flow
-6.6%
Cash-on-Cash Return
4.8%
Cap rate
0.6%
Rent to Value Ratio
Active
$434,000
4
bds
|
2
ba
|
1,700
sqft
|
built
1971
1325 Elder St, Denver, CO 80221
$-1,005
Cash flow
-12.1%
Cash-on-Cash Return
3.5%
Cap rate
0.5%
Rent to Value Ratio
Active
$629,900
4
bds
|
4
ba
|
2,198
sqft
|
built
2018
6834 Clay St, Denver, CO 80221
$-1,950
Cash flow
-16.2%
Cash-on-Cash Return
2.6%
Cap rate
0.5%
Rent to Value Ratio
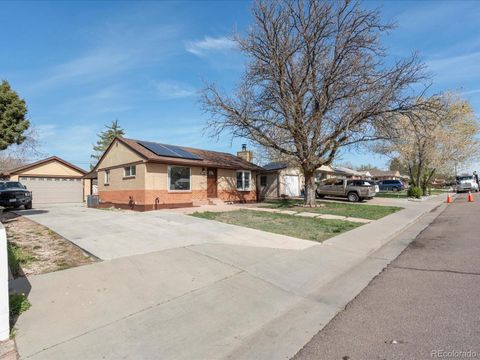
Active
$395,000
3
bds
|
1
ba
|
984
sqft
|
built
1955
7371 Granada Rd, Denver, CO 80221
$-529
Cash flow
-7.0%
Cash-on-Cash Return
4.7%
Cap rate
0.6%
Rent to Value Ratio
Active
$675,000
4
bds
|
4
ba
|
2,315
sqft
|
built
2020
2804 W 53rd Ave, Denver, CO 80221
$-1,397
Cash flow
-10.8%
Cash-on-Cash Return
3.8%
Cap rate
0.5%
Rent to Value Ratio
Active
$670,000
3
bds
|
4
ba
|
1,317
sqft
|
built
2018
2824 W Parkside Pl, Denver, CO 80221
$-1,109
Cash flow
-8.6%
Cash-on-Cash Return
4.3%
Cap rate
0.6%
Rent to Value Ratio
Active
$574,900
3
bds
|
2
ba
|
1,400
sqft
|
built
1958
2881 W 65th Ave, Denver, CO 80221
$-1,341
Cash flow
-12.2%
Cash-on-Cash Return
3.5%
Cap rate
0.5%
Rent to Value Ratio
Active
$485,000
3
bds
|
2
ba
|
1,520
sqft
|
built
1957
7625 Turner Dr, Denver, CO 80221
$-917
Cash flow
-9.9%
Cash-on-Cash Return
4.0%
Cap rate
0.6%
Rent to Value Ratio
Active
$797,500
4
bds
|
4
ba
|
3,114
sqft
|
built
2012
1730 W 67th Ave, Denver, CO 80221
$-1,862
Cash flow
-12.2%
Cash-on-Cash Return
3.5%
Cap rate
0.6%
Rent to Value Ratio

Active
$599,900
5
bds
|
2
ba
|
2,016
sqft
|
built
1994
6550 Clay St, Denver, CO 80221
$-1,807
Cash flow
-15.7%
Cash-on-Cash Return
2.7%
Cap rate
0.4%
Rent to Value Ratio