80601 Investment Properties for Sale
Browse homes for sale and investment properties in 80601. Refine your search by price, property type, or more.
Best cash flowing properties in 80601

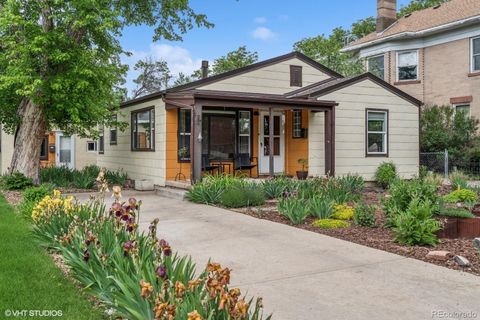
Active
$290,000
3
bds
|
1
ba
|
792
sqft
|
built
1916
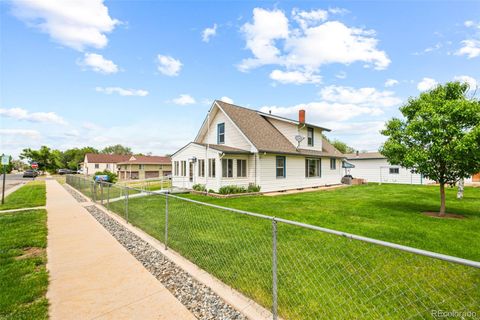
240 N 4th Ave, Brighton, CO 80601
$-178
Cash flow
-3.2%
Cash-on-Cash Return
4.9%
Cap rate
0.7%
Rent to Value Ratio

Active
$395,000
5
bds
|
2
ba
|
1,828
sqft
|
built
1973
362 Dogwood Ave, Brighton, CO 80601
$-199
Cash flow
-2.6%
Cash-on-Cash Return
5.1%
Cap rate
0.7%
Rent to Value Ratio
65 out of 70 properties for sale in 80601
Limited Results Shown
Create a free account, or log in to reveal all property listings and enjoy the complete experience.
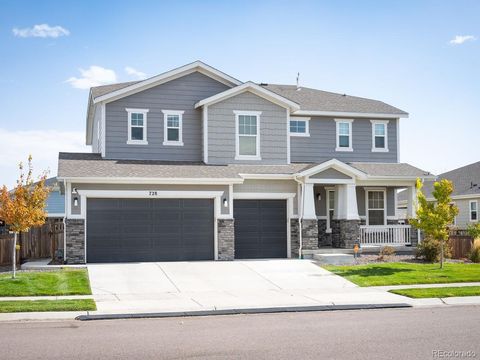
Active
$735,000
4
bds
|
4
ba
|
3,133
sqft
|
built
2019
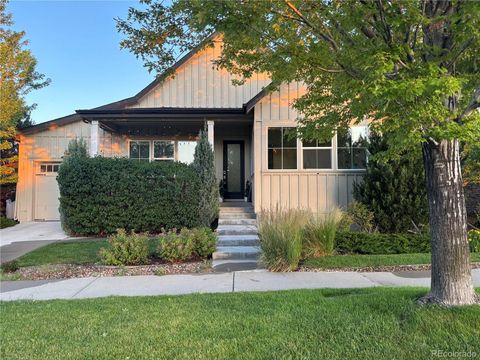
728 Larkspur Ct, Brighton, CO 80601
$-1,410
Cash flow
-10.0%
Cash-on-Cash Return
3.4%
Cap rate
0.5%
Rent to Value Ratio
Active
$500,000
3
bds
|
2
ba
|
1,608
sqft
|
built
1944
113 S 4th Ave, Brighton, CO 80601
$-642
Cash flow
-6.7%
Cash-on-Cash Return
4.1%
Cap rate
0.6%
Rent to Value Ratio
Active
$470,000
3
bds
|
3
ba
|
1,564
sqft
|
built
2005
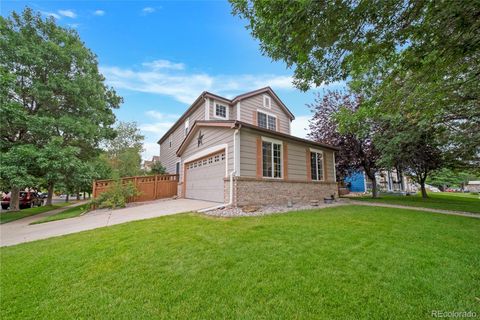
4436 Windmill Dr, Brighton, CO 80601
$-747
Cash flow
-8.3%
Cash-on-Cash Return
3.8%
Cap rate
0.6%
Rent to Value Ratio
Active
$473,900
3
bds
|
3
ba
|
1,816
sqft
|
built
2022
676 Hearthstone Ave, Brighton, CO 80601
$-772
Cash flow
-8.5%
Cash-on-Cash Return
3.7%
Cap rate
0.6%
Rent to Value Ratio

Active
$589,000
4
bds
|
3
ba
|
2,113
sqft
|
built
2005
3978 Balderas St, Brighton, CO 80601
$-1,043
Cash flow
-9.2%
Cash-on-Cash Return
3.6%
Cap rate
0.5%
Rent to Value Ratio

Active
$680,000
5
bds
|
4
ba
|
3,956
sqft
|
built
2019
1982 Griffin Dr, Brighton, CO 80601
$-1,530
Cash flow
-11.7%
Cash-on-Cash Return
3.0%
Cap rate
0.5%
Rent to Value Ratio

Active
$549,900
4
bds
|
3
ba
|
1,973
sqft
|
built
1996
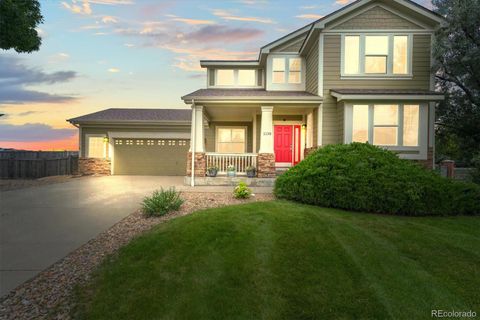
551 Longhurst Pl, Brighton, CO 80601
$-951
Cash flow
-9.0%
Cash-on-Cash Return
3.6%
Cap rate
0.5%
Rent to Value Ratio

Active
$975,000
4
bds
|
3
ba
|
2,578
sqft
|
built
1999
16791 Telluride St, Brighton, CO 80601
$-2,574
Cash flow
-13.8%
Cash-on-Cash Return
2.5%
Cap rate
0.4%
Rent to Value Ratio

Active
$670,000
5
bds
|
3
ba
|
3,622
sqft
|
built
2018
5540 Juniper Dr, Brighton, CO 80601
$-1,431
Cash flow
-11.1%
Cash-on-Cash Return
3.1%
Cap rate
0.5%
Rent to Value Ratio
Active
$580,000
4
bds
|
3
ba
|
2,789
sqft
|
built
2014
19 S 45th Ave, Brighton, CO 80601
$-895
Cash flow
-8.1%
Cash-on-Cash Return
3.8%
Cap rate
0.6%
Rent to Value Ratio

Active
$650,000
4
bds
|
4
ba
|
4,319
sqft
|
built
2020
607 Azalea St, Brighton, CO 80601
$-1,143
Cash flow
-9.2%
Cash-on-Cash Return
3.6%
Cap rate
0.6%
Rent to Value Ratio

Active
$485,000
3
bds
|
3
ba
|
1,912
sqft
|
built
2000
395 Longspur Dr, Brighton, CO 80601
$-903
Cash flow
-9.7%
Cash-on-Cash Return
3.4%
Cap rate
0.6%
Rent to Value Ratio

Active
$454,999
4
bds
|
3
ba
|
1,567
sqft
|
built
1999
1086 Mockingbird St, Brighton, CO 80601
$-712
Cash flow
-8.2%
Cash-on-Cash Return
3.8%
Cap rate
0.6%
Rent to Value Ratio

Active
$449,000
3
bds
|
3
ba
|
1,611
sqft
|
built
2005
5055 Pelican St, Brighton, CO 80601
$-804
Cash flow
-9.3%
Cash-on-Cash Return
3.5%
Cap rate
0.6%
Rent to Value Ratio
Active
$699,900
5
bds
|
4
ba
|
4,054
sqft
|
built
2002
1138 Coneflower Way, Brighton, CO 80601
$-1,423
Cash flow
-10.6%
Cash-on-Cash Return
3.2%
Cap rate
0.5%
Rent to Value Ratio

Active
$399,500
2
bds
|
1
ba
|
870
sqft
|
built
1949
544 S 3rd Ave, Brighton, CO 80601
$-506
Cash flow
-6.6%
Cash-on-Cash Return
4.2%
Cap rate
0.6%
Rent to Value Ratio

Active
$530,000
4
bds
|
3
ba
|
2,463
sqft
|
built
2016
467 S 36th Ave, Brighton, CO 80601
$-749
Cash flow
-7.4%
Cash-on-Cash Return
4.0%
Cap rate
0.6%
Rent to Value Ratio
Active
$623,000
5
bds
|
4
ba
|
3,560
sqft
|
built
2003
3406 Purcell St, Brighton, CO 80601
$-593
Cash flow
-5.0%
Cash-on-Cash Return
4.5%
Cap rate
0.6%
Rent to Value Ratio

Active
$624,900
5
bds
|
3
ba
|
2,772
sqft
|
built
2020
3074 Kestrel St, Brighton, CO 80601
$-1,165
Cash flow
-9.7%
Cash-on-Cash Return
3.4%
Cap rate
0.6%
Rent to Value Ratio
Active
$425,000
2
bds
|
1
ba
|
1,075
sqft
|
built
2010
5242 Longs Peak St, Brighton, CO 80601
$-805
Cash flow
-9.9%
Cash-on-Cash Return
3.4%
Cap rate
0.6%
Rent to Value Ratio

Active
$560,000
4
bds
|
3
ba
|
2,532
sqft
|
built
2007
329 Apache Plume St, Brighton, CO 80601
$-1,039
Cash flow
-9.7%
Cash-on-Cash Return
3.5%
Cap rate
0.6%
Rent to Value Ratio

Active
$525,000
3
bds
|
2
ba
|
2,076
sqft
|
built
2002
3563 Watada Dr, Brighton, CO 80601
$-722
Cash flow
-7.2%
Cash-on-Cash Return
4.0%
Cap rate
0.6%
Rent to Value Ratio
Active
$538,500
5
bds
|
3
ba
|
2,060
sqft
|
built
2001
5292 Goldfinch St, Brighton, CO 80601
$-1,091
Cash flow
-10.6%
Cash-on-Cash Return
3.2%
Cap rate
0.5%
Rent to Value Ratio

Active
$530,000
3
bds
|
2
ba
|
1,581
sqft
|
built
2022
4776 Kipp Pl, Brighton, CO 80601
$-965
Cash flow
-9.5%
Cash-on-Cash Return
3.5%
Cap rate
0.6%
Rent to Value Ratio

Active
$750,000
6
bds
|
4
ba
|
4,270
sqft
|
built
2012
4649 Spinning Wheel Dr, Brighton, CO 80601
$-1,422
Cash flow
-9.9%
Cash-on-Cash Return
3.4%
Cap rate
0.5%
Rent to Value Ratio

Active
$390,000
3
bds
|
2
ba
|
1,250
sqft
|
built
1939
276 N 9th Ave, Brighton, CO 80601
$-530
Cash flow
-7.1%
Cash-on-Cash Return
4.0%
Cap rate
0.6%
Rent to Value Ratio

Active
$455,000
4
bds
|
3
ba
|
1,992
sqft
|
built
2009
4670 Quandary Peak St, Brighton, CO 80601
$-782
Cash flow
-9.0%
Cash-on-Cash Return
3.6%
Cap rate
0.6%
Rent to Value Ratio

Active
$465,000
3
bds
|
3
ba
|
1,506
sqft
|
built
2005
4426 Windmill Dr, Brighton, CO 80601
$-723
Cash flow
-8.1%
Cash-on-Cash Return
3.8%
Cap rate
0.6%
Rent to Value Ratio

Active
$364,000
2
bds
|
1
ba
|
1,240
sqft
|
built
1999
765 Mockingbird St, Brighton, CO 80601
$-566
Cash flow
-8.1%
Cash-on-Cash Return
3.8%
Cap rate
0.6%
Rent to Value Ratio

Active
$360,000
4
bds
|
1
ba
|
1,116
sqft
|
built
1934
410 N 6th Ave, Brighton, CO 80601
$-530
Cash flow
-7.7%
Cash-on-Cash Return
3.9%
Cap rate
0.6%
Rent to Value Ratio

Active
$375,000
2
bds
|
2
ba
|
1,221
sqft
|
built
1939
235 N 7th Ave, Brighton, CO 80601
$-231
Cash flow
-3.2%
Cash-on-Cash Return
4.9%
Cap rate
0.7%
Rent to Value Ratio

Active
$545,000
3
bds
|
3
ba
|
2,347
sqft
|
built
2020
5995 Fencerow Pl, Brighton, CO 80601
$-957
Cash flow
-9.2%
Cash-on-Cash Return
3.6%
Cap rate
0.6%
Rent to Value Ratio
Active
$539,900
6
bds
|
1
ba
|
1,235
sqft
|
built
1917
276 N 5th Ave, Brighton, CO 80601
$-992
Cash flow
-9.6%
Cash-on-Cash Return
3.5%
Cap rate
0.5%
Rent to Value Ratio

Active
$544,000
5
bds
|
4
ba
|
2,793
sqft
|
built
2006
186 S 45th Ave, Brighton, CO 80601
$-699
Cash flow
-6.7%
Cash-on-Cash Return
4.1%
Cap rate
0.7%
Rent to Value Ratio

Active
$500,000
4
bds
|
3
ba
|
1,960
sqft
|
built
2007
4641 Quandary Peak St, Brighton, CO 80601
$-924
Cash flow
-9.6%
Cash-on-Cash Return
3.5%
Cap rate
0.6%
Rent to Value Ratio

Active
$549,000
4
bds
|
3
ba
|
2,113
sqft
|
built
2005
3745 Balderas St, Brighton, CO 80601
$-793
Cash flow
-7.5%
Cash-on-Cash Return
3.9%
Cap rate
0.6%
Rent to Value Ratio

Active
$567,900
4
bds
|
3
ba
|
2,570
sqft
|
built
2017
1523 Honeysuckle Ct, Brighton, CO 80601
$-931
Cash flow
-8.6%
Cash-on-Cash Return
3.7%
Cap rate
0.6%
Rent to Value Ratio

Active
$475,000
3
bds
|
2
ba
|
1,929
sqft
|
built
1973
865 S 8th Ave, Brighton, CO 80601
$-551
Cash flow
-6.1%
Cash-on-Cash Return
4.3%
Cap rate
0.6%
Rent to Value Ratio