80816 Investment Properties for Sale
Browse homes for sale and investment properties in 80816. Refine your search by price, property type, or more.
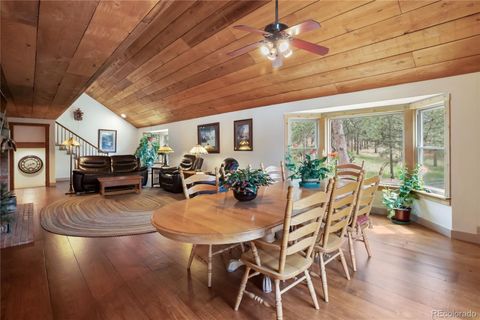
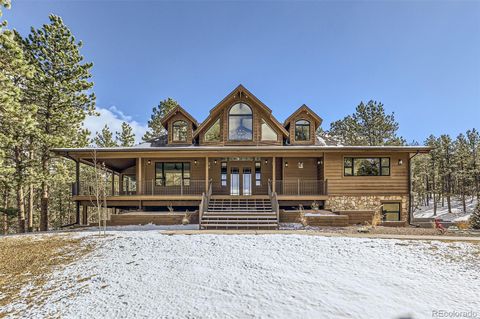
Best cash flowing properties in 80816
Active
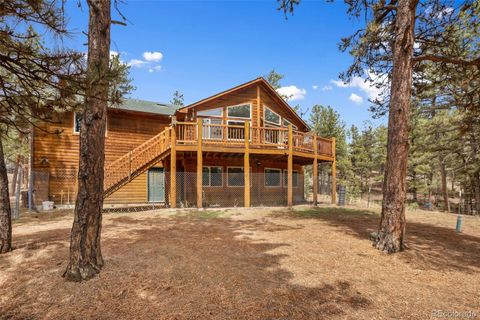
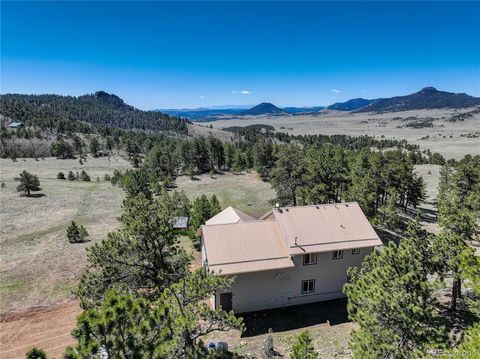
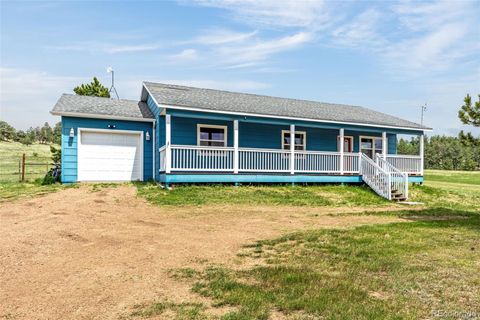
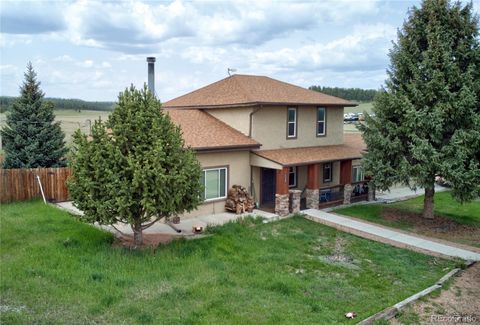
$323,750
3
bds
|
1
ba
|
1,008
sqft
|
built
1983
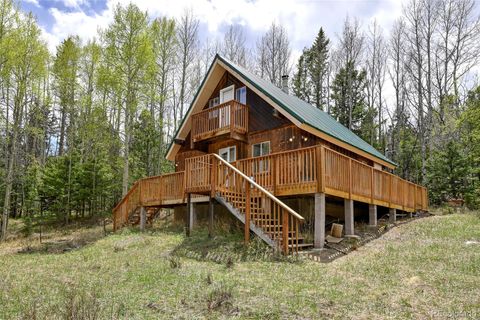
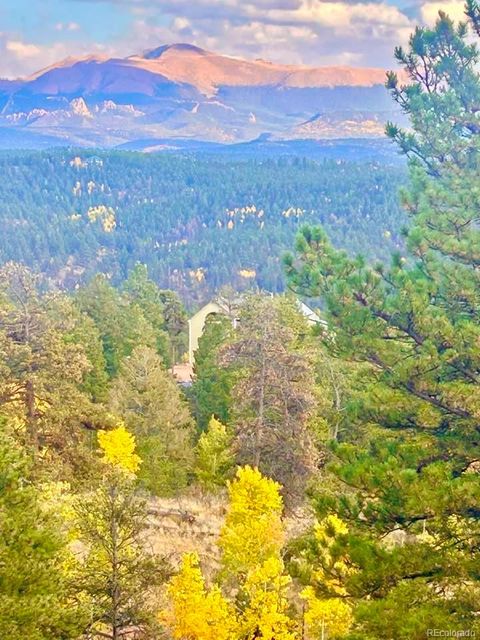
454 Eagle Rock Rd, Florissant, CO 80816
$-223
Cash flow
-3.6%
Cash-on-Cash Return
5.4%
Cap rate
0.7%
Rent to Value Ratio

Active
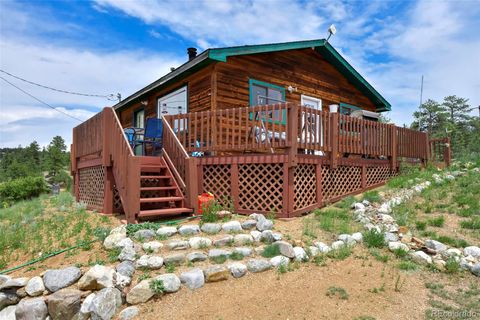
$348,000
2
bds
|
1
ba
|
1,200
sqft
|
built
1997
441 Paint Pony Ln, Florissant, CO 80816
$-367
Cash flow
-5.5%
Cash-on-Cash Return
5.0%
Cap rate
0.6%
Rent to Value Ratio
53 out of 60 properties for sale in 80816
Limited Results Shown
Create a free account, or log in to reveal all property listings and enjoy the complete experience.
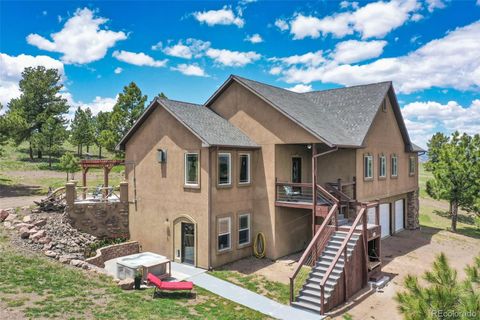
Active
$499,900
3
bds
|
2
ba
|
1,460
sqft
|
built
1988
204 Kutsu Ridge Rd, Florissant, CO 80816
$-1,080
Cash flow
-11.3%
Cash-on-Cash Return
3.7%
Cap rate
0.5%
Rent to Value Ratio
Active
$498,750
2
bds
|
1
ba
|
1,144
sqft
|
built
2001
290 Eagle Rock Rd, Florissant, CO 80816
$-775
Cash flow
-8.1%
Cash-on-Cash Return
4.4%
Cap rate
0.6%
Rent to Value Ratio
Active
$1,900,000
4
bds
|
4
ba
|
2,972
sqft
|
built
2008
2 Golden Eagle Hts, Florissant, CO 80816
$-6,745
Cash flow
-18.5%
Cash-on-Cash Return
2.0%
Cap rate
0.3%
Rent to Value Ratio

Active
$422,500
2
bds
|
2
ba
|
960
sqft
|
built
2014
28 E Nevada Cir, Florissant, CO 80816
$-890
Cash flow
-11.0%
Cash-on-Cash Return
3.7%
Cap rate
0.5%
Rent to Value Ratio
Active
$565,000
3
bds
|
3
ba
|
2,569
sqft
|
built
2001
82 Bradshaw Rd, Florissant, CO 80816
$-1,215
Cash flow
-11.2%
Cash-on-Cash Return
3.7%
Cap rate
0.5%
Rent to Value Ratio

Active
$569,000
3
bds
|
2
ba
|
1,440
sqft
|
built
2020
874 Hackamore Dr, Florissant, CO 80816
$-1,210
Cash flow
-11.1%
Cash-on-Cash Return
3.7%
Cap rate
0.5%
Rent to Value Ratio
Active
$849,000
4
bds
|
3
ba
|
2,706
sqft
|
built
2006
2413 County Rd 403, Florissant, CO 80816
$-1,474
Cash flow
-9.1%
Cash-on-Cash Return
4.2%
Cap rate
0.5%
Rent to Value Ratio
Active
$505,000
2
bds
|
1
ba
|
832
sqft
|
built
1973
201 Lake Dr, Florissant, CO 80816
$-1,199
Cash flow
-12.4%
Cash-on-Cash Return
3.4%
Cap rate
0.4%
Rent to Value Ratio
Active
$435,000
3
bds
|
3
ba
|
1,611
sqft
|
built
1997
840 Obsidian Dr, Florissant, CO 80816
$-789
Cash flow
-9.5%
Cash-on-Cash Return
4.1%
Cap rate
0.5%
Rent to Value Ratio
Active
$1,249,000
3
bds
|
3
ba
|
3,282
sqft
|
built
1997
361 Crystal Peak Rd, Florissant, CO 80816
$-3,911
Cash flow
-16.3%
Cash-on-Cash Return
2.5%
Cap rate
0.3%
Rent to Value Ratio
Active
$500,000
2
bds
|
2
ba
|
1,992
sqft
|
built
1997
877 N Mountain Estates Rd, Florissant, CO 80816
$-728
Cash flow
-7.6%
Cash-on-Cash Return
4.5%
Cap rate
0.6%
Rent to Value Ratio
Active
$399,000
3
bds
|
2
ba
|
1,624
sqft
|
built
1995
1641 Kiowa Rd, Florissant, CO 80816
$-596
Cash flow
-7.8%
Cash-on-Cash Return
4.5%
Cap rate
0.6%
Rent to Value Ratio
Active
$569,000
3
bds
|
2
ba
|
1,654
sqft
|
built
2003
318 Southgate Rd, Florissant, CO 80816
$-1,278
Cash flow
-11.7%
Cash-on-Cash Return
3.6%
Cap rate
0.5%
Rent to Value Ratio
Active
$775,000
4
bds
|
3
ba
|
2,580
sqft
|
built
2011
777 Deerview Dr, Florissant, CO 80816
$-1,533
Cash flow
-10.3%
Cash-on-Cash Return
3.9%
Cap rate
0.5%
Rent to Value Ratio
Active
$595,000
4
bds
|
3
ba
|
2,847
sqft
|
built
1996
143 Stonehenge Dr, Florissant, CO 80816
$-1,419
Cash flow
-12.4%
Cash-on-Cash Return
3.4%
Cap rate
0.5%
Rent to Value Ratio
Active
$680,000
3
bds
|
2
ba
|
2,975
sqft
|
built
2000
115 White Tail Ln, Florissant, CO 80816
$-1,459
Cash flow
-11.2%
Cash-on-Cash Return
3.7%
Cap rate
0.5%
Rent to Value Ratio
Active
$525,000
3
bds
|
2
ba
|
1,277
sqft
|
built
1999
37 Surrey Ln, Florissant, CO 80816
$-863
Cash flow
-8.6%
Cash-on-Cash Return
3.7%
Cap rate
0.5%
Rent to Value Ratio
Active
$435,000
3
bds
|
2
ba
|
1,232
sqft
|
built
2005
406 High Pasture Rd, Florissant, CO 80816
$-552
Cash flow
-6.6%
Cash-on-Cash Return
4.2%
Cap rate
0.5%
Rent to Value Ratio
Active
$735,000
3
bds
|
4
ba
|
2,230
sqft
|
built
1986
34 Nebraska Cir, Florissant, CO 80816
$-2,018
Cash flow
-14.3%
Cash-on-Cash Return
3.0%
Cap rate
0.4%
Rent to Value Ratio
Active
$580,000
3
bds
|
3
ba
|
1,925
sqft
|
built
2008
1563 Southpark Rd, Florissant, CO 80816
$-917
Cash flow
-8.2%
Cash-on-Cash Return
3.8%
Cap rate
0.5%
Rent to Value Ratio
Active
$715,000
4
bds
|
3
ba
|
2,249
sqft
|
built
1992
309 Western Hills Dr, Florissant, CO 80816
$-1,299
Cash flow
-9.5%
Cash-on-Cash Return
3.5%
Cap rate
0.4%
Rent to Value Ratio
Active
$650,000
4
bds
|
0
ba
|
2,375
sqft
|
built
2001
517 Crystal Peak Rd, Florissant, CO 80816
$-1,358
Cash flow
-10.9%
Cash-on-Cash Return
3.8%
Cap rate
0.5%
Rent to Value Ratio
Active
$390,000
3
bds
|
2
ba
|
1,216
sqft
|
built
1997
1360 Kiowa Rd, Florissant, CO 80816
$-529
Cash flow
-7.1%
Cash-on-Cash Return
4.6%
Cap rate
0.6%
Rent to Value Ratio
Active
$799,900
4
bds
|
2
ba
|
2,751
sqft
|
built
1983
381 Saddleback Creek Dr, Florissant, CO 80816
$-2,503
Cash flow
-16.3%
Cash-on-Cash Return
2.5%
Cap rate
0.3%
Rent to Value Ratio
Active
$599,000
3
bds
|
2
ba
|
1,890
sqft
|
built
2021
348 Duesouth Rd, Florissant, CO 80816
$-1,092
Cash flow
-9.5%
Cash-on-Cash Return
4.1%
Cap rate
0.5%
Rent to Value Ratio
Active
$675,000
3
bds
|
3
ba
|
3,189
sqft
|
built
1977
688 Obsidian Dr, Florissant, CO 80816
$-1,729
Cash flow
-13.4%
Cash-on-Cash Return
3.2%
Cap rate
0.4%
Rent to Value Ratio
Active
$539,000
3
bds
|
2
ba
|
1,680
sqft
|
built
1993
518 Drees Dr, Florissant, CO 80816
$-937
Cash flow
-9.1%
Cash-on-Cash Return
4.2%
Cap rate
0.5%
Rent to Value Ratio
Active
$505,000
3
bds
|
2
ba
|
1,392
sqft
|
built
2001
25 Amanda Cir, Florissant, CO 80816
$-997
Cash flow
-10.3%
Cash-on-Cash Return
3.9%
Cap rate
0.5%
Rent to Value Ratio

Active
$365,000
1
bds
|
1
ba
|
640
sqft
|
built
1961
274 Midland Rd, Florissant, CO 80816
$-607
Cash flow
-8.7%
Cash-on-Cash Return
4.3%
Cap rate
0.5%
Rent to Value Ratio

Active
$534,900
2
bds
|
2
ba
|
1,258
sqft
|
built
1977
490 Elkhorn Rd, Florissant, CO 80816
$-1,036
Cash flow
-10.1%
Cash-on-Cash Return
3.9%
Cap rate
0.5%
Rent to Value Ratio

Active
$535,000
3
bds
|
3
ba
|
2,287
sqft
|
built
2004
69 Crescent Dr, Florissant, CO 80816
$-972
Cash flow
-9.5%
Cash-on-Cash Return
4.1%
Cap rate
0.5%
Rent to Value Ratio
Active
$1,900,000
5
bds
|
4
ba
|
5,301
sqft
|
built
2002
584 Pikes Peak Dr, Florissant, CO 80816
$-7,078
Cash flow
-19.4%
Cash-on-Cash Return
1.8%
Cap rate
0.2%
Rent to Value Ratio

Active
$799,000
5
bds
|
3
ba
|
2,894
sqft
|
built
1981
1738 Wildhorn Rd, Florissant, CO 80816
$-2,262
Cash flow
-14.8%
Cash-on-Cash Return
2.9%
Cap rate
0.4%
Rent to Value Ratio
Active
$660,000
4
bds
|
2
ba
|
1,944
sqft
|
built
1982
13599 County Rd 1, Florissant, CO 80816
$-1,117
Cash flow
-8.8%
Cash-on-Cash Return
3.6%
Cap rate
0.5%
Rent to Value Ratio

Active
$440,000
3
bds
|
2
ba
|
1,548
sqft
|
built
1995
936 Matterhorn Dr, Florissant, CO 80816
$-571
Cash flow
-6.8%
Cash-on-Cash Return
4.1%
Cap rate
0.5%
Rent to Value Ratio

Active
$375,000
3
bds
|
1
ba
|
1,118
sqft
|
built
1966
281 Mesa Dr, Florissant, CO 80816
$-530
Cash flow
-7.4%
Cash-on-Cash Return
4.6%
Cap rate
0.6%
Rent to Value Ratio

Active
$670,000
4
bds
|
3
ba
|
2,825
sqft
|
built
2019
654 High Pasture Rd, Florissant, CO 80816
$-1,202
Cash flow
-9.4%
Cash-on-Cash Return
4.1%
Cap rate
0.5%
Rent to Value Ratio
Active
$540,000
2
bds
|
2
ba
|
1,330
sqft
|
built
1995
958 Meadows Ln, Florissant, CO 80816
$-979
Cash flow
-9.5%
Cash-on-Cash Return
4.1%
Cap rate
0.5%
Rent to Value Ratio