80863 Investment Properties for Sale
Browse homes for sale and investment properties in 80863. Refine your search by price, property type, or more.
Best cash flowing properties in 80863
Active
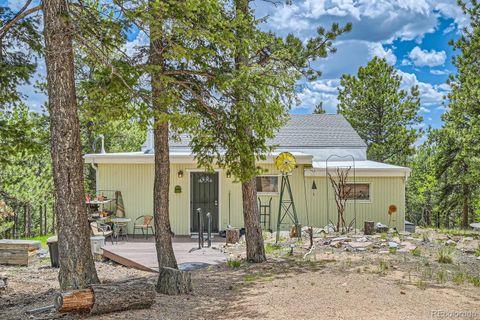
$250,000
2
bds
|
1
ba
|
1,330
sqft
|
built
1960
376 Gardenia Rd, Woodland Park, CO 80863
$239
Cash flow
5.0%
Cash-on-Cash Return
6.8%
Cap rate
0.9%
Rent to Value Ratio

Active
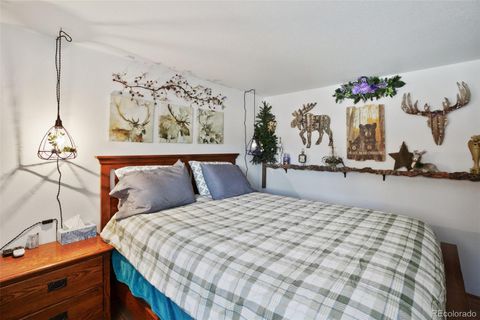
$250,000
2
bds
|
1
ba
|
728
sqft
|
built
1982
310 Blossom Rd, Woodland Park, CO 80863
$-85
Cash flow
-1.8%
Cash-on-Cash Return
5.3%
Cap rate
0.6%
Rent to Value Ratio
60 out of 63 properties for sale in 80863
Limited Results Shown
Create a free account, or log in to reveal all property listings and enjoy the complete experience.

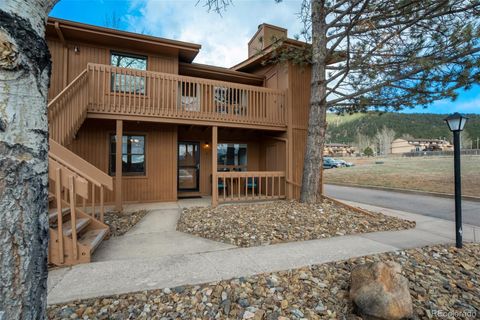
Active
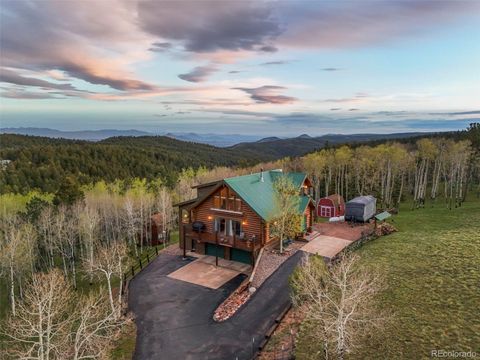
$415,000
2
bds
|
2
ba
|
1,188
sqft
|
built
2008
399 Gardenia Rd, Woodland Park, CO 80863
$-695
Cash flow
-8.7%
Cash-on-Cash Return
4.3%
Cap rate
0.6%
Rent to Value Ratio
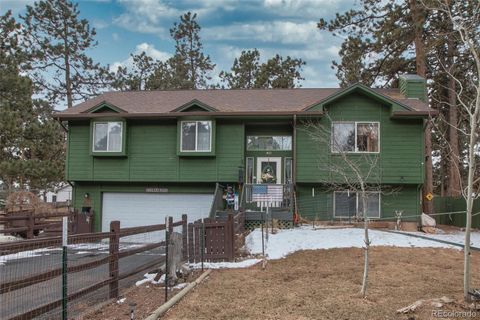
Active
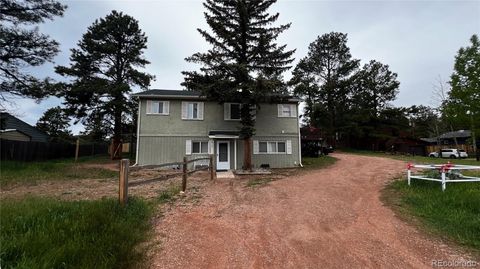
$425,000
2
bds
|
0
ba
|
816
sqft
|
built
2002
429 Gentian Rd, Woodland Park, CO 80863
$-795
Cash flow
-9.8%
Cash-on-Cash Return
4.0%
Cap rate
0.5%
Rent to Value Ratio

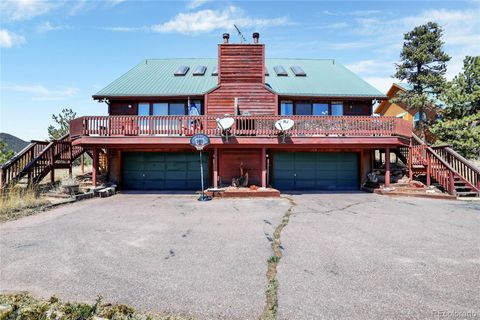
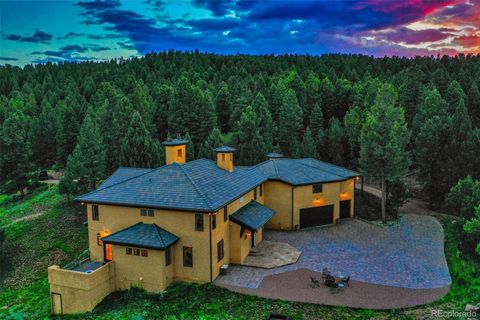
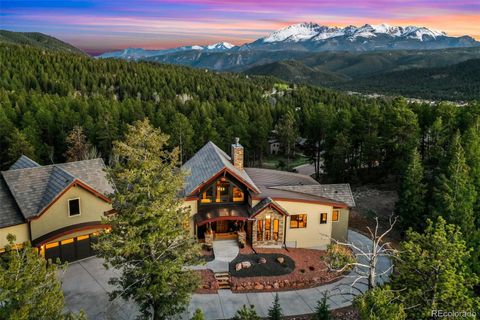
Active
$2,248,000
4
bds
|
2
ba
|
4,852
sqft
|
built
1980
2120 Lee Circle Dr, Woodland Park, CO 80863
$-9,222
Cash flow
-21.4%
Cash-on-Cash Return
1.3%
Cap rate
0.2%
Rent to Value Ratio

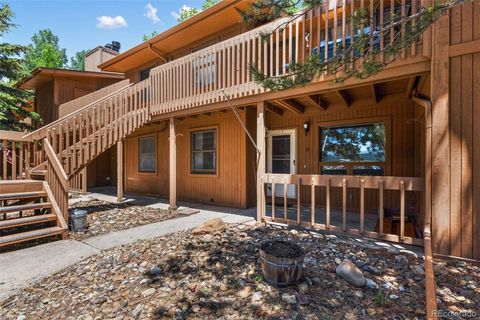
Active
$1,189,000
5
bds
|
6
ba
|
6,523
sqft
|
built
1996
725 Sun Valley Dr, Woodland Park, CO 80863
$-3,964
Cash flow
-17.4%
Cash-on-Cash Return
2.3%
Cap rate
0.3%
Rent to Value Ratio

Active
$535,000
3
bds
|
3
ba
|
2,118
sqft
|
built
2002
310 Evergreen St, Woodland Park, CO 80863
$-1,284
Cash flow
-12.5%
Cash-on-Cash Return
3.4%
Cap rate
0.5%
Rent to Value Ratio
Active
$1,075,000
3
bds
|
3
ba
|
2,734
sqft
|
built
2001
11690 Rampart Range Rd, Woodland Park, CO 80863
$-3,201
Cash flow
-15.5%
Cash-on-Cash Return
2.7%
Cap rate
0.4%
Rent to Value Ratio

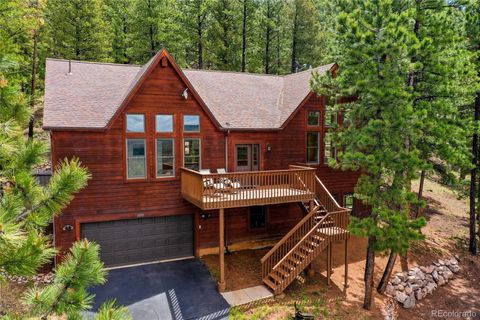
Active
$650,000
4
bds
|
3
ba
|
2,360
sqft
|
built
1977
2169 Spruce Rd, Woodland Park, CO 80863
$-1,766
Cash flow
-14.2%
Cash-on-Cash Return
3.0%
Cap rate
0.4%
Rent to Value Ratio
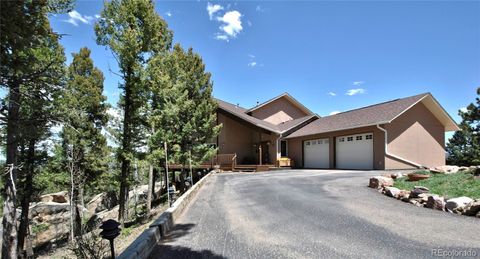
Active
$505,000
4
bds
|
2
ba
|
1,868
sqft
|
built
1974
418 N Baldwin St, Woodland Park, CO 80863
$-1,634
Cash flow
-16.9%
Cash-on-Cash Return
2.4%
Cap rate
0.3%
Rent to Value Ratio
Active
$599,900
3
bds
|
2
ba
|
1,092
sqft
|
built
1971
500 W Kelly Rd, Woodland Park, CO 80863
$-1,522
Cash flow
-13.2%
Cash-on-Cash Return
3.2%
Cap rate
0.4%
Rent to Value Ratio

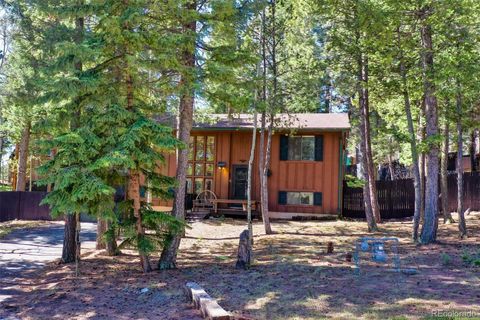
Active
$295,550
1
bds
|
1
ba
|
672
sqft
|
built
2002
345 Klitowya Trl, Woodland Park, CO 80863
$-390
Cash flow
-6.9%
Cash-on-Cash Return
4.7%
Cap rate
0.6%
Rent to Value Ratio
Active
$850,000
3
bds
|
4
ba
|
3,784
sqft
|
built
2003
931 Heather Ct, Woodland Park, CO 80863
$-1,607
Cash flow
-9.9%
Cash-on-Cash Return
4.0%
Cap rate
0.5%
Rent to Value Ratio
Active
$550,000
3
bds
|
2
ba
|
2,160
sqft
|
built
1994
2206 Spruce Rd, Woodland Park, CO 80863
$-1,086
Cash flow
-10.3%
Cash-on-Cash Return
3.9%
Cap rate
0.5%
Rent to Value Ratio
Active
$744,900
3
bds
|
2
ba
|
1,595
sqft
|
built
2019
14077 S State Highway 67, Woodland Park, CO 80863
$-1,716
Cash flow
-12.0%
Cash-on-Cash Return
3.5%
Cap rate
0.5%
Rent to Value Ratio
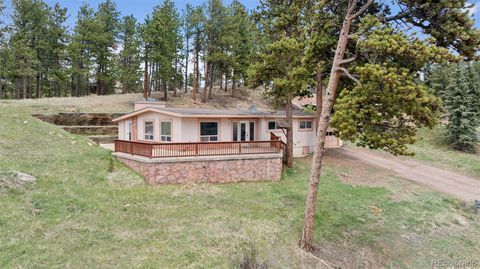
Active
$289,900
2
bds
|
0
ba
|
1,012
sqft
|
built
1981
401 Forest Edge Rd, Woodland Park, CO 80863
$-733
Cash flow
-13.2%
Cash-on-Cash Return
3.2%
Cap rate
0.6%
Rent to Value Ratio
Active
$510,000
3
bds
|
2
ba
|
1,786
sqft
|
built
1996
411 W Bowman Ave, Woodland Park, CO 80863
$-1,099
Cash flow
-11.2%
Cash-on-Cash Return
3.7%
Cap rate
0.5%
Rent to Value Ratio
Active
$620,000
4
bds
|
4
ba
|
2,208
sqft
|
built
1983
900 Ponderosa Way, Woodland Park, CO 80863
$-1,570
Cash flow
-13.2%
Cash-on-Cash Return
3.2%
Cap rate
0.5%
Rent to Value Ratio
Active
$230,000
2
bds
|
2
ba
|
1,012
sqft
|
built
1981
401 Forest Edge Rd, Woodland Park, CO 80863
$-443
Cash flow
-10.0%
Cash-on-Cash Return
4.0%
Cap rate
0.7%
Rent to Value Ratio
Active
$2,999,900
6
bds
|
8
ba
|
9,097
sqft
|
built
2004
419 Lucky Lady Dr, Woodland Park, CO 80863
$-13,077
Cash flow
-22.7%
Cash-on-Cash Return
1.0%
Cap rate
0.2%
Rent to Value Ratio

Active
$750,000
3
bds
|
3
ba
|
2,141
sqft
|
built
1990
2601 Vista Glen Ct, Woodland Park, CO 80863
$-1,950
Cash flow
-13.6%
Cash-on-Cash Return
3.1%
Cap rate
0.4%
Rent to Value Ratio
Active
$495,000
3
bds
|
2
ba
|
1,832
sqft
|
built
1957
150 Apache Trl, Woodland Park, CO 80863
$-879
Cash flow
-9.3%
Cash-on-Cash Return
4.1%
Cap rate
0.5%
Rent to Value Ratio
Active
$355,000
2
bds
|
2
ba
|
1,500
sqft
|
built
1985
590 Greenway Ct, Woodland Park, CO 80863
$-980
Cash flow
-14.4%
Cash-on-Cash Return
3.0%
Cap rate
0.6%
Rent to Value Ratio
Active
$519,000
3
bds
|
2
ba
|
1,778
sqft
|
built
2003
635 Wakanda Trl, Woodland Park, CO 80863
$-1,151
Cash flow
-11.6%
Cash-on-Cash Return
3.6%
Cap rate
0.5%
Rent to Value Ratio
Active
$2,250,000
4
bds
|
6
ba
|
5,143
sqft
|
built
2016
290 Thunder Ridge Dr, Woodland Park, CO 80863
$-10,186
Cash flow
-23.6%
Cash-on-Cash Return
0.8%
Cap rate
0.2%
Rent to Value Ratio
Active
$775,000
3
bds
|
3
ba
|
3,306
sqft
|
built
1996
1321 Forest Edge Rd, Woodland Park, CO 80863
$-2,068
Cash flow
-13.9%
Cash-on-Cash Return
3.1%
Cap rate
0.4%
Rent to Value Ratio
Active
$789,000
3
bds
|
3
ba
|
3,486
sqft
|
built
1998
319 Summit Rd, Woodland Park, CO 80863
$-2,007
Cash flow
-13.3%
Cash-on-Cash Return
3.2%
Cap rate
0.4%
Rent to Value Ratio
Active
$499,900
3
bds
|
2
ba
|
1,632
sqft
|
built
1977
1321 W Midland Ave, Woodland Park, CO 80863
$-1,250
Cash flow
-13.0%
Cash-on-Cash Return
3.3%
Cap rate
0.4%
Rent to Value Ratio
Active
$2,395,000
4
bds
|
5
ba
|
4,984
sqft
|
built
2013
201 Fox Mountain Dr, Woodland Park, CO 80863
$-9,688
Cash flow
-21.1%
Cash-on-Cash Return
1.4%
Cap rate
0.2%
Rent to Value Ratio
Active
$1,250,000
3
bds
|
3
ba
|
3,415
sqft
|
built
1999
111 E Lovell Gulch Rd, Woodland Park, CO 80863
$-4,092
Cash flow
-17.1%
Cash-on-Cash Return
2.3%
Cap rate
0.3%
Rent to Value Ratio
Active
$779,900
4
bds
|
2
ba
|
2,496
sqft
|
built
2020
1378 Millstone Ln, Woodland Park, CO 80863
$-1,605
Cash flow
-10.7%
Cash-on-Cash Return
3.2%
Cap rate
0.4%
Rent to Value Ratio
Active
$650,000
3
bds
|
2
ba
|
2,000
sqft
|
built
2017
1136 Ptarmigan Dr, Woodland Park, CO 80863
$-1,745
Cash flow
-14.0%
Cash-on-Cash Return
3.0%
Cap rate
0.4%
Rent to Value Ratio
Active
$625,000
3
bds
|
2
ba
|
1,803
sqft
|
built
1986
1955 Valley View Dr, Woodland Park, CO 80863
$-1,594
Cash flow
-13.3%
Cash-on-Cash Return
3.2%
Cap rate
0.4%
Rent to Value Ratio

Active
$465,000
3
bds
|
3
ba
|
2,163
sqft
|
built
1979
720 Northwoods Dr W, Woodland Park, CO 80863
$-884
Cash flow
-9.9%
Cash-on-Cash Return
4.0%
Cap rate
0.5%
Rent to Value Ratio

Active
$500,000
4
bds
|
2
ba
|
2,170
sqft
|
built
1985
120 Red Rock Ct, Woodland Park, CO 80863
$-1,020
Cash flow
-10.6%
Cash-on-Cash Return
3.8%
Cap rate
0.5%
Rent to Value Ratio

Active
$830,000
4
bds
|
3
ba
|
3,051
sqft
|
built
1997
1321 Masters Dr, Woodland Park, CO 80863
$-1,832
Cash flow
-11.5%
Cash-on-Cash Return
3.6%
Cap rate
0.5%
Rent to Value Ratio
Active
$729,900
4
bds
|
3
ba
|
2,876
sqft
|
built
1980
120 Blue Sky Ave, Woodland Park, CO 80863
$-1,856
Cash flow
-13.3%
Cash-on-Cash Return
3.2%
Cap rate
0.4%
Rent to Value Ratio

Active
$498,500
3
bds
|
3
ba
|
2,041
sqft
|
built
1973
95 Club Dr, Woodland Park, CO 80863
$-777
Cash flow
-8.1%
Cash-on-Cash Return
4.4%
Cap rate
0.6%
Rent to Value Ratio

Active
$570,000
3
bds
|
2
ba
|
1,428
sqft
|
built
1985
1300 Thomas Cir, Woodland Park, CO 80863
$-1,357
Cash flow
-12.4%
Cash-on-Cash Return
3.4%
Cap rate
0.5%
Rent to Value Ratio

Active
$695,000
3
bds
|
4
ba
|
3,883
sqft
|
built
2000
352 Gray Horse Cir, Woodland Park, CO 80863
$-1,151
Cash flow
-8.6%
Cash-on-Cash Return
4.3%
Cap rate
0.6%
Rent to Value Ratio