80863 Investment Properties for Sale
Browse homes for sale and investment properties in 80863. Refine your search by price, property type, or more.
Best cash flowing properties in 80863

Active
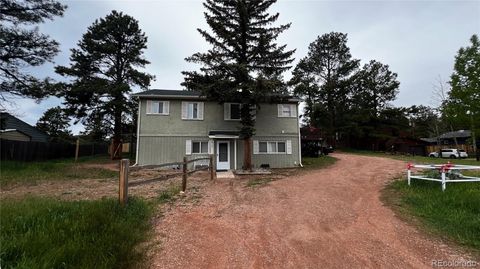
$200,000
2
bds
|
1
ba
|
728
sqft
|
built
1982
310 Blossom Rd, Woodland Park, CO 80863
$0
Cash flow
n/a
Cash-on-Cash Return
n/a
Cap rate
n/a
Rent to Value Ratio

Active
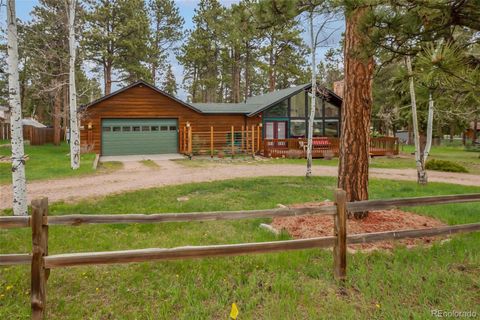
$285,000
1
bds
|
1
ba
|
672
sqft
|
built
2002
345 Klitowya Trl, Woodland Park, CO 80863
$-196
Cash flow
-3.6%
Cash-on-Cash Return
4.9%
Cap rate
0.6%
Rent to Value Ratio
40 out of 78 properties for sale in 80863
Limited Results Shown
Create a free account, or log in to reveal all property listings and enjoy the complete experience.
Active
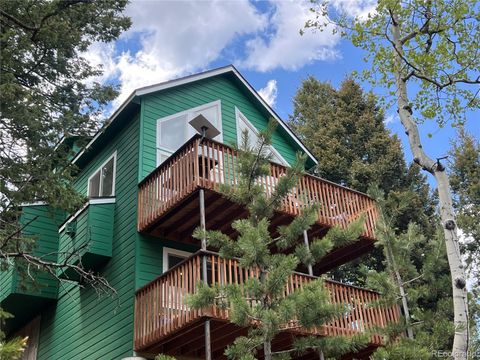
$399,000
4
bds
|
1
ba
|
816
sqft
|
built
2002
429 Gentian Rd, Woodland Park, CO 80863
$-464
Cash flow
-6.1%
Cash-on-Cash Return
4.3%
Cap rate
0.6%
Rent to Value Ratio
Active
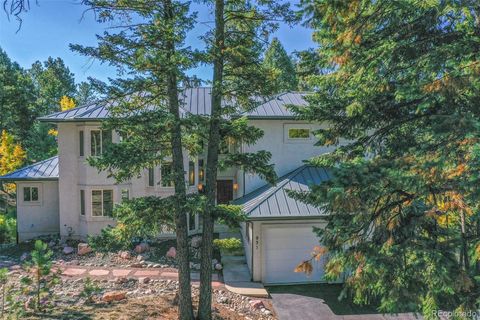
$1,225,000
4
bds
|
4
ba
|
3,960
sqft
|
built
2007
700 Sunrise Cir, Woodland Park, CO 80863
$-3,828
Cash flow
-16.3%
Cash-on-Cash Return
1.9%
Cap rate
0.3%
Rent to Value Ratio
Active
$2,199,999
4
bds
|
2
ba
|
4,852
sqft
|
built
1980
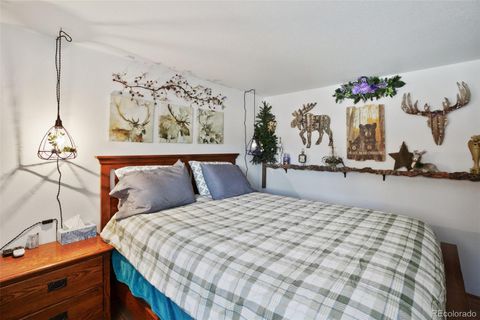
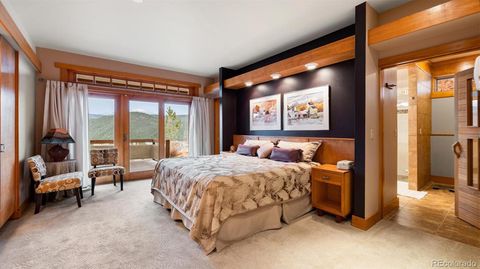
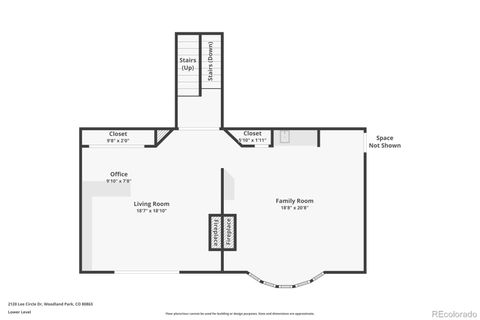
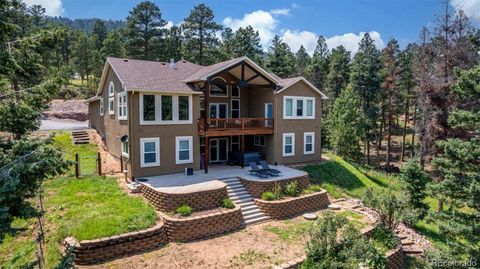
2120 Lee Circle Dr, Woodland Park, CO 80863
$-7,897
Cash flow
-18.7%
Cash-on-Cash Return
1.4%
Cap rate
0.2%
Rent to Value Ratio
Active
$989,900
5
bds
|
4
ba
|
3,524
sqft
|
built
2000
556 Crystola Ct, Woodland Park, CO 80863
$-1,987
Cash flow
-10.5%
Cash-on-Cash Return
3.3%
Cap rate
0.4%
Rent to Value Ratio
Active
$485,000
4
bds
|
2
ba
|
1,868
sqft
|
built
1974
418 N Baldwin St, Woodland Park, CO 80863
$-1,293
Cash flow
-13.9%
Cash-on-Cash Return
2.5%
Cap rate
0.4%
Rent to Value Ratio
Active
$825,000
3
bds
|
4
ba
|
3,784
sqft
|
built
2003
931 Heather Ct, Woodland Park, CO 80863
$-1,073
Cash flow
-6.8%
Cash-on-Cash Return
4.1%
Cap rate
0.5%
Rent to Value Ratio
Active
$599,900
3
bds
|
2
ba
|
1,092
sqft
|
built
1971
500 W Kelly Rd, Woodland Park, CO 80863
$-1,229
Cash flow
-10.7%
Cash-on-Cash Return
3.2%
Cap rate
0.4%
Rent to Value Ratio
Active
$389,000
2
bds
|
2
ba
|
1,316
sqft
|
built
2018
501 Wakanda Trl, Woodland Park, CO 80863
$-403
Cash flow
-5.4%
Cash-on-Cash Return
4.4%
Cap rate
0.6%
Rent to Value Ratio
Active
$685,000
3
bds
|
2
ba
|
1,595
sqft
|
built
2019
14077 S State Highway 67, Woodland Park, CO 80863
$-1,069
Cash flow
-8.1%
Cash-on-Cash Return
3.8%
Cap rate
0.5%
Rent to Value Ratio

Active
$750,000
3
bds
|
3
ba
|
2,141
sqft
|
built
1990
2601 Vista Glen Ct, Woodland Park, CO 80863
$-1,583
Cash flow
-11.0%
Cash-on-Cash Return
3.1%
Cap rate
0.4%
Rent to Value Ratio
Active
$2,999,900
6
bds
|
8
ba
|
9,097
sqft
|
built
2004
419 Lucky Lady Dr, Woodland Park, CO 80863
$-11,611
Cash flow
-20.2%
Cash-on-Cash Return
1.0%
Cap rate
0.2%
Rent to Value Ratio

Active
$450,000
3
bds
|
2
ba
|
1,832
sqft
|
built
1957
150 Apache Trl, Woodland Park, CO 80863
$-425
Cash flow
-4.9%
Cash-on-Cash Return
4.5%
Cap rate
0.6%
Rent to Value Ratio
Active
$760,000
3
bds
|
3
ba
|
3,306
sqft
|
built
1996
1321 Forest Edge Rd, Woodland Park, CO 80863
$-1,619
Cash flow
-11.1%
Cash-on-Cash Return
3.1%
Cap rate
0.4%
Rent to Value Ratio
Active
$1,250,000
3
bds
|
3
ba
|
3,415
sqft
|
built
1999
111 E Lovell Gulch Rd, Woodland Park, CO 80863
$-3,481
Cash flow
-14.5%
Cash-on-Cash Return
2.3%
Cap rate
0.3%
Rent to Value Ratio
Active
$515,000
3
bds
|
2
ba
|
1,778
sqft
|
built
2003
635 Wakanda Trl, Woodland Park, CO 80863
$-878
Cash flow
-8.9%
Cash-on-Cash Return
3.6%
Cap rate
0.5%
Rent to Value Ratio
Active
$739,900
4
bds
|
2
ba
|
2,496
sqft
|
built
2020
1378 Millstone Ln, Woodland Park, CO 80863
$-1,415
Cash flow
-10.0%
Cash-on-Cash Return
3.4%
Cap rate
0.5%
Rent to Value Ratio
Active
$2,395,000
4
bds
|
5
ba
|
4,984
sqft
|
built
2013
201 Fox Mountain Dr, Woodland Park, CO 80863
$-8,518
Cash flow
-18.6%
Cash-on-Cash Return
1.4%
Cap rate
0.2%
Rent to Value Ratio
Active
$325,000
2
bds
|
2
ba
|
1,500
sqft
|
built
1985
590 Greenway Ct, Woodland Park, CO 80863
$-665
Cash flow
-10.7%
Cash-on-Cash Return
3.2%
Cap rate
0.7%
Rent to Value Ratio
Active
$465,000
3
bds
|
2
ba
|
1,520
sqft
|
built
1981
430 Shady Ln, Woodland Park, CO 80863
$-655
Cash flow
-7.3%
Cash-on-Cash Return
4.0%
Cap rate
0.5%
Rent to Value Ratio

Active
$695,000
3
bds
|
4
ba
|
3,883
sqft
|
built
2000
352 Gray Horse Cir, Woodland Park, CO 80863
$-812
Cash flow
-6.1%
Cash-on-Cash Return
4.3%
Cap rate
0.6%
Rent to Value Ratio

Active
$570,000
3
bds
|
2
ba
|
1,428
sqft
|
built
1985
1300 Thomas Cir, Woodland Park, CO 80863
$-1,078
Cash flow
-9.9%
Cash-on-Cash Return
3.4%
Cap rate
0.5%
Rent to Value Ratio
Active
$697,700
4
bds
|
3
ba
|
2,982
sqft
|
built
1982
1003 Kings Crown Rd, Woodland Park, CO 80863
$-1,539
Cash flow
-11.5%
Cash-on-Cash Return
3.0%
Cap rate
0.4%
Rent to Value Ratio
Active
$370,000
1
bds
|
1
ba
|
672
sqft
|
built
2002
526 Wakanda Trl, Woodland Park, CO 80863
$-490
Cash flow
-6.9%
Cash-on-Cash Return
4.1%
Cap rate
0.5%
Rent to Value Ratio
Active
$575,000
4
bds
|
0
ba
|
1,532
sqft
|
built
1972
1148 Parkview Rd, Woodland Park, CO 80863
$-831
Cash flow
-7.5%
Cash-on-Cash Return
3.9%
Cap rate
0.5%
Rent to Value Ratio
Active
$764,800
3
bds
|
3
ba
|
2,639
sqft
|
built
2001
320 Summit Rd, Woodland Park, CO 80863
$-1,676
Cash flow
-11.4%
Cash-on-Cash Return
3.0%
Cap rate
0.4%
Rent to Value Ratio

Active
$499,900
4
bds
|
4
ba
|
2,369
sqft
|
built
2006
808 Misty Pines Cir, Woodland Park, CO 80863
$-1,009
Cash flow
-10.5%
Cash-on-Cash Return
3.3%
Cap rate
0.6%
Rent to Value Ratio
Active
$749,000
4
bds
|
3
ba
|
2,746
sqft
|
built
1996
2255 Spruce Rd, Woodland Park, CO 80863
$-1,593
Cash flow
-11.1%
Cash-on-Cash Return
3.1%
Cap rate
0.4%
Rent to Value Ratio
Active
$462,500
2
bds
|
2
ba
|
1,720
sqft
|
built
1986
1908 Valley View Dr, Woodland Park, CO 80863
$-501
Cash flow
-5.7%
Cash-on-Cash Return
4.4%
Cap rate
0.6%
Rent to Value Ratio
Active
$460,000
2
bds
|
2
ba
|
1,424
sqft
|
built
2021
269 Klitowya Trl, Woodland Park, CO 80863
$-612
Cash flow
-6.9%
Cash-on-Cash Return
4.1%
Cap rate
0.5%
Rent to Value Ratio
Active
$439,500
2
bds
|
2
ba
|
960
sqft
|
built
2004
155 Squilchuck Trl, Woodland Park, CO 80863
$-487
Cash flow
-5.8%
Cash-on-Cash Return
4.3%
Cap rate
0.6%
Rent to Value Ratio
Active
$769,000
4
bds
|
4
ba
|
3,338
sqft
|
built
2001
1300 W Midland Ave, Woodland Park, CO 80863
$-1,936
Cash flow
-13.1%
Cash-on-Cash Return
2.7%
Cap rate
0.4%
Rent to Value Ratio
Active
$399,000
3
bds
|
2
ba
|
1,560
sqft
|
built
2012
50 Dakota Ln, Woodland Park, CO 80863
$-495
Cash flow
-6.5%
Cash-on-Cash Return
4.2%
Cap rate
0.6%
Rent to Value Ratio
Active
$484,000
2
bds
|
2
ba
|
1,638
sqft
|
built
1993
47 Aspen Rd, Woodland Park, CO 80863
$-477
Cash flow
-5.1%
Cash-on-Cash Return
4.5%
Cap rate
0.6%
Rent to Value Ratio
Active
$2,200,000
5
bds
|
8
ba
|
9,395
sqft
|
built
2001
221 Columbine Pl, Woodland Park, CO 80863
$-8,546
Cash flow
-20.3%
Cash-on-Cash Return
1.0%
Cap rate
0.2%
Rent to Value Ratio
Active
$625,000
3
bds
|
4
ba
|
2,680
sqft
|
built
2006
1511 Crestview Way, Woodland Park, CO 80863
$-1,211
Cash flow
-10.1%
Cash-on-Cash Return
3.4%
Cap rate
0.5%
Rent to Value Ratio
Active
$689,000
3
bds
|
3
ba
|
2,478
sqft
|
built
1999
350 Panther Ct, Woodland Park, CO 80863
$-1,358
Cash flow
-10.3%
Cash-on-Cash Return
3.3%
Cap rate
0.4%
Rent to Value Ratio
Active
$610,000
3
bds
|
2
ba
|
1,803
sqft
|
built
1986
1955 Valley View Dr, Woodland Park, CO 80863
$-1,218
Cash flow
-10.4%
Cash-on-Cash Return
3.3%
Cap rate
0.4%
Rent to Value Ratio
Active
$650,000
3
bds
|
2
ba
|
2,000
sqft
|
built
2017
1136 Ptarmigan Dr, Woodland Park, CO 80863
$-1,428
Cash flow
-11.5%
Cash-on-Cash Return
3.0%
Cap rate
0.4%
Rent to Value Ratio