84098 Investment Properties for Sale
Browse homes for sale and investment properties in 84098. Refine your search by price, property type, or more.
Best cash flowing properties in 84098
Active
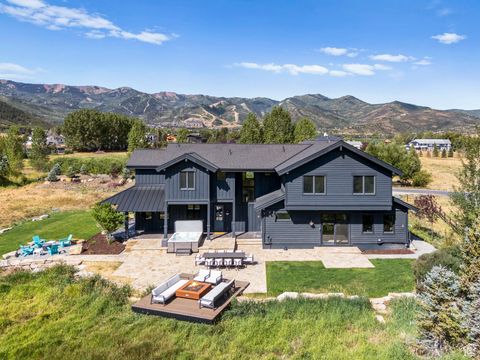
$844,900
3
bds
|
3
ba
|
1,763
sqft
|
built
2020
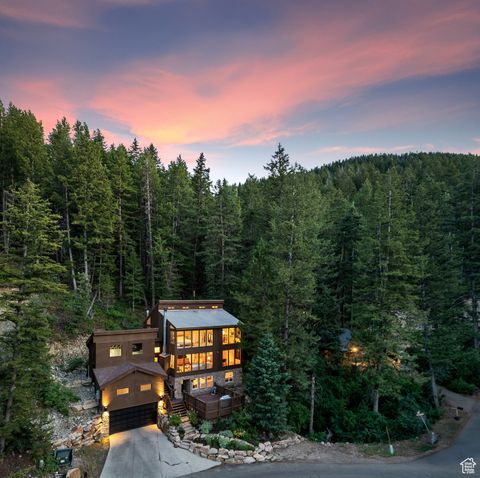
6698 N Silver Creek Dr, Park City, UT 84098
$-849
Cash flow
-5.2%
Cash-on-Cash Return
4.5%
Cap rate
0.7%
Rent to Value Ratio

Active
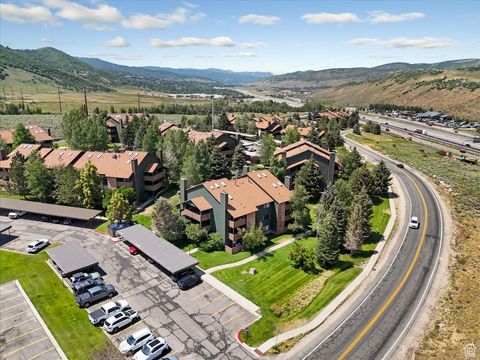
$354,000
bds
|
1
ba
|
338
sqft
|
built
2020
2670 Canyons Resort Dr, Park City, UT 84098
$-1,098
Cash flow
-16.2%
Cash-on-Cash Return
2.0%
Cap rate
0.6%
Rent to Value Ratio
217 out of 286 properties for sale in 84098
Limited Results Shown
Create a free account, or log in to reveal all property listings and enjoy the complete experience.
Active
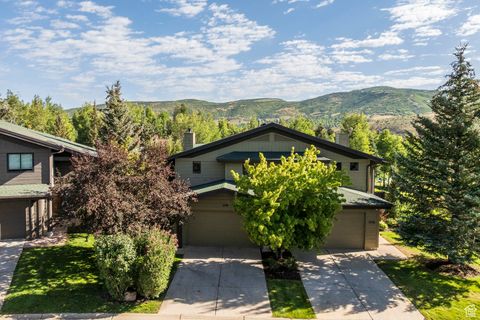
$1,295,000
3
bds
|
2
ba
|
3,167
sqft
|
built
1980
485 Upper Evergreen Dr, Park City, UT 84098
$-3,012
Cash flow
-12.1%
Cash-on-Cash Return
2.9%
Cap rate
0.4%
Rent to Value Ratio
Active
$550,000
1
bds
|
1
ba
|
650
sqft
|
built
1979
2025 Canyons Resort Dr, Park City, UT 84098
$-1,674
Cash flow
-15.9%
Cash-on-Cash Return
2.0%
Cap rate
0.5%
Rent to Value Ratio
Active
$3,250,000
4
bds
|
4
ba
|
2,905
sqft
|
built
2017
6458 Golden Bear Loop W, Park City, UT 84098
$-12,879
Cash flow
-20.7%
Cash-on-Cash Return
0.9%
Cap rate
0.2%
Rent to Value Ratio
Active
$4,650,000
5
bds
|
5
ba
|
4,329
sqft
|
built
2018
2755 E Bitter Brush Dr, Park City, UT 84098
$-18,152
Cash flow
-20.4%
Cash-on-Cash Return
1.0%
Cap rate
0.2%
Rent to Value Ratio
Active
$5,250,000
5
bds
|
6
ba
|
6,142
sqft
|
built
2007
8267 N Ranch Garden Rd, Park City, UT 84098
$-22,348
Cash flow
-22.2%
Cash-on-Cash Return
0.6%
Cap rate
0.1%
Rent to Value Ratio
Active
$1,350,000
2
bds
|
3
ba
|
1,089
sqft
|
built
2018
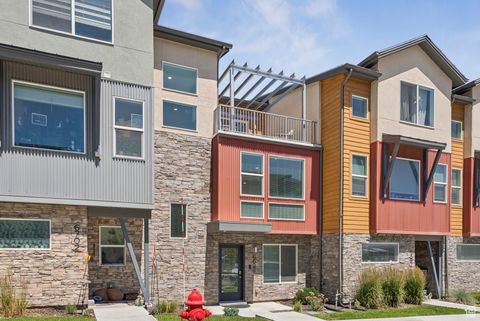
3793 Blackstone Dr, Park City, UT 84098
$-4,466
Cash flow
-17.3%
Cash-on-Cash Return
1.7%
Cap rate
0.4%
Rent to Value Ratio
Active
$4,000,000
5
bds
|
4
ba
|
4,763
sqft
|
built
2015
836 E Canyon Gate Rd, Park City, UT 84098
$-14,349
Cash flow
-18.7%
Cash-on-Cash Return
1.4%
Cap rate
0.2%
Rent to Value Ratio
Active
$875,000
2
bds
|
2
ba
|
1,385
sqft
|
built
2015
6169 Park Ln S, Park City, UT 84098
$-2,412
Cash flow
-14.4%
Cash-on-Cash Return
2.4%
Cap rate
0.4%
Rent to Value Ratio
Active
$519,999
2
bds
|
2
ba
|
854
sqft
|
built
1983
6935 N 2200 W, Park City, UT 84098
$-1,347
Cash flow
-13.5%
Cash-on-Cash Return
2.6%
Cap rate
0.5%
Rent to Value Ratio
Active
$489,950
2
bds
|
2
ba
|
854
sqft
|
built
1984
6905 N 2200 W, Park City, UT 84098
$-1,516
Cash flow
-16.1%
Cash-on-Cash Return
2.0%
Cap rate
0.4%
Rent to Value Ratio
Active
$3,990,000
6
bds
|
7
ba
|
6,874
sqft
|
built
2004
1978 Kidd Cir, Park City, UT 84098
$-14,820
Cash flow
-19.4%
Cash-on-Cash Return
1.2%
Cap rate
0.2%
Rent to Value Ratio
Active
$2,800,000
4
bds
|
4
ba
|
2,460
sqft
|
built
2006
8052 Western Sky, Park City, UT 84098
$-9,733
Cash flow
-18.1%
Cash-on-Cash Return
1.5%
Cap rate
0.3%
Rent to Value Ratio
Active
$2,200,000
5
bds
|
5
ba
|
4,524
sqft
|
built
2005
3239 Creek Rd, Park City, UT 84098
$-5,571
Cash flow
-13.2%
Cash-on-Cash Return
2.6%
Cap rate
0.4%
Rent to Value Ratio
Active
$600,000
1
bds
|
1
ba
|
650
sqft
|
built
1979
2025 Canyons Resort Dr, Park City, UT 84098
$-2,048
Cash flow
-17.8%
Cash-on-Cash Return
1.6%
Cap rate
0.4%
Rent to Value Ratio
Active
$1,500,000
6
bds
|
3
ba
|
4,601
sqft
|
built
1992
7850 Cedar Way, Park City, UT 84098
$-3,170
Cash flow
-11.0%
Cash-on-Cash Return
3.1%
Cap rate
0.4%
Rent to Value Ratio
Active
$6,500,000
5
bds
|
4
ba
|
4,205
sqft
|
built
2007
4746 Old Meadow Ln, Park City, UT 84098
$-26,234
Cash flow
-21.1%
Cash-on-Cash Return
0.8%
Cap rate
0.1%
Rent to Value Ratio
Active
$948,000
4
bds
|
4
ba
|
1,943
sqft
|
built
1995
2708 Cottage Loop, Park City, UT 84098
$-2,631
Cash flow
-14.5%
Cash-on-Cash Return
2.3%
Cap rate
0.4%
Rent to Value Ratio
Active
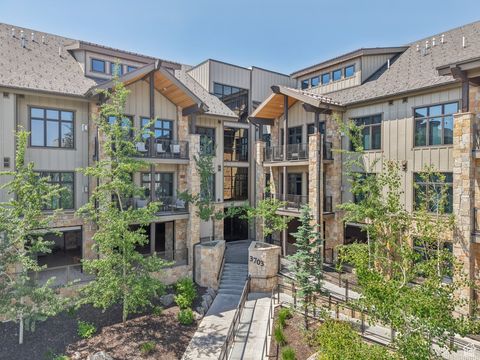
$1,595,000
2
bds
|
3
ba
|
1,160
sqft
|
built
2019
3703 Blackstone Dr, Park City, UT 84098
$-5,726
Cash flow
-18.7%
Cash-on-Cash Return
1.4%
Cap rate
0.3%
Rent to Value Ratio
Active
$525,000
2
bds
|
2
ba
|
854
sqft
|
built
1983
6821 N 2200 W, Park City, UT 84098
$-1,585
Cash flow
-15.8%
Cash-on-Cash Return
2.1%
Cap rate
0.5%
Rent to Value Ratio
Active
$3,795,000
2
bds
|
4
ba
|
2,998
sqft
|
built
2001
4830 Bear View Dr, Park City, UT 84098
$-15,262
Cash flow
-21.0%
Cash-on-Cash Return
0.9%
Cap rate
0.1%
Rent to Value Ratio
Active
$435,000
bds
|
1
ba
|
335
sqft
|
built
2008
3000 Canyons Resort Dr, Park City, UT 84098
$-2,008
Cash flow
-24.1%
Cash-on-Cash Return
0.1%
Cap rate
0.4%
Rent to Value Ratio
Active
$5,950,000
5
bds
|
6
ba
|
5,977
sqft
|
built
2015
3428 Westview Trl, Park City, UT 84098
$-24,113
Cash flow
-21.1%
Cash-on-Cash Return
0.8%
Cap rate
0.1%
Rent to Value Ratio
Active
$3,790,000
6
bds
|
7
ba
|
6,550
sqft
|
built
1999
2044 Mahre Dr, Park City, UT 84098
$-13,684
Cash flow
-18.8%
Cash-on-Cash Return
1.3%
Cap rate
0.2%
Rent to Value Ratio
Active
$11,200,000
7
bds
|
9
ba
|
12,110
sqft
|
built
2015
7005 N Greenfield Dr, Park City, UT 84098
$-50,985
Cash flow
-23.8%
Cash-on-Cash Return
0.2%
Cap rate
0.0%
Rent to Value Ratio
Active
$1,190,000
5
bds
|
4
ba
|
2,550
sqft
|
built
1999
5428 Bobsled Blvd, Park City, UT 84098
$-2,436
Cash flow
-10.7%
Cash-on-Cash Return
3.2%
Cap rate
0.5%
Rent to Value Ratio
Active
$1,115,000
2
bds
|
2
ba
|
1,282
sqft
|
built
2015
1370 Center Dr, Park City, UT 84098
$-3,563
Cash flow
-16.7%
Cash-on-Cash Return
1.8%
Cap rate
0.3%
Rent to Value Ratio
Active
$3,950,000
4
bds
|
5
ba
|
4,276
sqft
|
built
2013
7357 Pine Ridge Dr, Park City, UT 84098
$-14,700
Cash flow
-19.4%
Cash-on-Cash Return
1.2%
Cap rate
0.2%
Rent to Value Ratio
Active
$2,100,000
4
bds
|
4
ba
|
4,351
sqft
|
built
1992
4320 Hidden Cove Rd, Park City, UT 84098
$-6,041
Cash flow
-15.0%
Cash-on-Cash Return
2.2%
Cap rate
0.3%
Rent to Value Ratio
Active
$2,230,000
5
bds
|
4
ba
|
4,104
sqft
|
built
2022
415 Earl St, Park City, UT 84098
$-7,510
Cash flow
-17.6%
Cash-on-Cash Return
1.6%
Cap rate
0.3%
Rent to Value Ratio
Active
$1,750,000
5
bds
|
3
ba
|
2,872
sqft
|
built
1988
280 E Countryside Cir, Park City, UT 84098
$-4,561
Cash flow
-13.6%
Cash-on-Cash Return
2.6%
Cap rate
0.4%
Rent to Value Ratio
Active
$1,895,000
2
bds
|
3
ba
|
1,417
sqft
|
built
2008
4264 Willow Draw Dr, Park City, UT 84098
$-6,906
Cash flow
-19.0%
Cash-on-Cash Return
1.3%
Cap rate
0.3%
Rent to Value Ratio
Active
$995,000
1
bds
|
1
ba
|
882
sqft
|
built
1981
1237 Lower Cove Rd, Park City, UT 84098
$-3,270
Cash flow
-17.1%
Cash-on-Cash Return
1.7%
Cap rate
0.3%
Rent to Value Ratio
Active
$354,000
bds
|
1
ba
|
338
sqft
|
built
2020
2670 Canyons Resort Dr, Park City, UT 84098
$-1,098
Cash flow
-16.2%
Cash-on-Cash Return
2.0%
Cap rate
0.6%
Rent to Value Ratio
Active
$1,349,000
3
bds
|
4
ba
|
2,423
sqft
|
built
2007
3017 Canyon Link Dr, Park City, UT 84098
$-4,489
Cash flow
-17.4%
Cash-on-Cash Return
1.7%
Cap rate
0.3%
Rent to Value Ratio
Active
$2,395,450
5
bds
|
5
ba
|
4,144
sqft
|
built
1991
3271 Big Spruce Way, Park City, UT 84098
$-6,936
Cash flow
-15.1%
Cash-on-Cash Return
2.2%
Cap rate
0.3%
Rent to Value Ratio
Active
$3,880,000
6
bds
|
6
ba
|
3,163
sqft
|
built
2016
3668 Blackstone Dr, Park City, UT 84098
$-15,432
Cash flow
-20.8%
Cash-on-Cash Return
0.9%
Cap rate
0.2%
Rent to Value Ratio
Active
$1,390,000
3
bds
|
3
ba
|
2,755
sqft
|
built
1980
1513 Meadow Loop Rd, Park City, UT 84098
$-4,466
Cash flow
-16.8%
Cash-on-Cash Return
1.8%
Cap rate
0.3%
Rent to Value Ratio
Active
$385,000
bds
|
1
ba
|
402
sqft
|
built
2020
2670 Canyons Resort Dr, Park City, UT 84098
$-1,572
Cash flow
-21.3%
Cash-on-Cash Return
0.8%
Cap rate
0.4%
Rent to Value Ratio